

Abstract
Mammalian type II taste cells release the afferent neurotransmitter adenosine triphosphate (ATP) through ATP-permeable ion channels, most likely to be connexin (Cx) and/or pannexin hemichannels. Here, we show that ion channels responsible for voltage-gated (VG) outward currents in type II cells are ATP permeable and demonstrate a strong correlation between the magnitude of the VG current and the intensity of ATP release. These findings suggest that slowly deactivating ion channels transporting the VG outward currents can also mediate ATP secretion in type II cells. In line with this inference, we studied a dependence of ATP secretion on membrane voltage with a cellular ATP sensor using different pulse protocols. These were designed on the basis of predictions of a model of voltage-dependent transient ATP efflux. Consistently with curves that were simulated for ATP release mediated by ATP-permeable channels deactivating slowly, the bell-like and Langmuir isotherm–like potential dependencies were characteristic of ATP secretion obtained for prolonged and short electrical stimulations of taste cells, respectively. These observations strongly support the idea that ATP is primarily released via slowly deactivating channels. Depolarizing voltage pulses produced negligible Ca2+ transients in the cytoplasm of cells releasing ATP, suggesting that ATP secretion is mainly governed by membrane voltage under our recording conditions. With the proviso that natural connexons and pannexons are kinetically similar to exogenously expressed hemichannels, our findings suggest that VG ATP release in type II cells is primarily mediated by Cx hemichannels.
INTRODUCTION
In the taste bud, type II chemosensory cells express G protein–coupled taste receptors to detect sapid molecules of the sweet, bitter, or umami categories (for reviews see Chandrashekar et al., 2006 and Roper, 2007). These cells release ATP, the most likely afferent neurotransmitter in the peripheral taste organ (Finger et al., 2005), on electrical stimulation (Romanov et al., 2007) and in response to tastants (Huang et al., 2007). The ATP secretion can occur in the absence of Ca2+ influx and/or Ca2+ release and is inhibited by certain channel blockers, suggesting that type II cells release ATP via ATP-permeable ion channels rather than by using the classical exocytotic mechanism (Huang et al., 2007; Romanov et al., 2007). Type II taste cells express multiple junctional proteins, including pannexin (Px)1 and several connexins (Cx's) (Huang et al., 2007; Romanov et al., 2007), which alone or in combination can mediate ATP secretion. Romanov et al. (2007) have argued for Cx hemichannels as a likely pathway for ATP secretion, mostly based on the effects of octanol and Cx mimetic peptide 43GAP26, both of which inhibited ATP efflux in taste cells. Huang et al. (2007) have found that Px1 is the most abundant gap-junction protein in type II cells, compared with Cx30 and Cx43, and that 5 μM carbenoxolone, a potent blocker of Px1 hemichannels at this concentration, severely diminishes ATP secretion stimulated by tastants. Given these findings and based on data from the literature (e.g., Dahl and Locovei, 2006), Huang et al. (2007) speculated in favor of Px1 hemichannels as a conduit of ATP release.
In fact, the Cx- and Px-mediated pathways can hardly be unambiguously distinguished in natural cells using solely the inhibitory analysis: (1) subtype-specific blockers for Cx and Px hemichannels are not available (Bruzzone et al., 2005; Wang et al., 2007; Schaper et al., 2008); (2) cells can express multiple Px and Cx isoforms; and (3) natural hemichannels can function as heterooligomers (Mese et al., 2007) with peculiar sensitivity to blockers. The assay of taste cells with the deleted px1 gene would provide direct and the most convincing evidence in favor or against Px1 as the principal mediator of ATP secretion. However, Px1-null mice are not available at the moment.
In heterologous systems, Cx and Px1 hemichannels exhibited different functional features, including sensitivity to intracellular and extracellular Ca2+ and gating kinetics. Assuming that natural Cx and Px1 hemichannels are similarly distinct in their biophysical properties, we studied certain aspects of ATP secretion in electrically stimulated taste cells with a combination of different methods to elucidate whether connexons or pannexons were primarily involved.
MATERIALS AND METHODS
Electrophysiology
All experiments were conducted in accordance with the Guide for the Care and Use of Laboratory Animals. Taste cells were isolated from mouse (6–8-wk old; Naval Medical Research Institute) circumvallate papilla as described previously (Baryshnikov et al., 2003). Ion currents were recorded, filtered, and analyzed using an Axopatch 200A amplifier, a DigiData 1322A interface, and the pClamp8 software (all from MDS Analytical Technologies). Series resistance, which generally ranged within 7–15 MΩ, was routinely compensated for by up to 70%. The recording chamber and the perfusion system have been described previously (Kolesnikov and Margolskee, 1998). To prevent a loss of intracellular components and cell desensitization, the perforated patch approach was used in most experiments using pipettes containing (in mM): 140 CsCl, 1 MgCl2, 0.5 EGTA, 10 HEPES-CsOH, pH 7.2, and 400 μg/ml amphotericin B. The basic bath solution contained (in mM): 140 NaCl, 5 KCl, 1 MgCl2, 1 CaCl2, 10 HEPES-NaOH (pH 7.4), and 5 glucose. All chemicals were from Sigma-Aldrich. Experiments were performed at 23–25°C.
ATP Biosensor
Cells of the COS-1 line, which endogenously express P2Y receptors coupled to Ca2+ mobilization, were used as a cellular sensor to ATP. The COS-1 cell line was routinely maintained in Dulbecco's modified Eagle's medium (Invitrogen) containing 10% (vol/vol) fetal bovine serum (HyClone), 1% glutamine, and the antibiotics penicillin (100 U/ml) and streptomycin (100 μg/ml; all supplements from Sigma-Aldrich). Cells were grown in 35-mm–diameter dishes in a humidified atmosphere (5% CO2/95% O2) at 37°C. Cells were suspended in Hanks's solution containing 0.25% trypsin and collected in a 1.5-ml centrifuge tube after terminating the reaction with 10% fetal bovine serum (HyClone).
Imaging
Calcium transients in COS-1 cells were visualized with an ICCD camera (IC-200; Photon Technology International) using an Axioscope-2 microscope and a water-immersion objective (Achroplan 40×; NA = 0.8; Carl Zeiss, Inc.). For Ca2+ imaging, taste cells and/or biosensor cells were loaded with 4 μM Fluo-4AM for 35 min in the presence of pluronic (0.002%; both from Invitrogen) at room temperature. Dye-loaded cells were transferred to a recording chamber, and their fluorescence was excited with a light-emitting diode (Luxion) at 480 nm. Cell emission was filtered at 535 ± 25 nm (Chroma Technology Corp.), and sequential fluorescence images were acquired every 0.5–2 s with Workbench 5.2 software (INDEC Biosystems). To select biosensor with appropriate nucleotide sensitivity, COS-1 cells were stimulated by 100–300 nM ATP that negligibly affected type II taste cells, which were also in the physiological chamber.
RESULTS
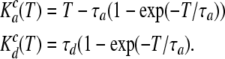
Taste cells were isolated from mouse circumvallate papillae and identified electrophysiologically, as described previously (Romanov and Kolesnikov, 2006; Romanov et al., 2007). In a heterogeneous population of taste bud cells, only type II cells are capable of releasing ATP upon their stimulation (Huang et al., 2007; Romanov et al., 2007). These taste cells express Px1 and multiple Cx's, including Cx26, Cx30.3, Cx31.1, Cx33, and Cx43, which can provide a molecular basis for ATP secretion (Huang et al., 2007; Romanov et al., 2007). A few of these channel proteins form functional voltage-gated (VG) hemichannels in type II cells responsible for voltage-dependent accumulation of tracers, such as Lucifer Yellow, 6-carboxifluorescein (Romanov et al., 2007), and fluorescein (not depicted). These hemichannels also mediate large VG outward currents observed under the Cs+in/Na+out gradient (Fig. 1 A) (Romanov et al., 2007). Their molecular identity has not been elucidated yet.
Figure 1.

Effects of hemichannel blockers on VG outward currents and ATP secretion in taste cells of the type II. (A) Representative recordings of VG currents in control (top panels) and after a 10-min incubation with the Cx mimetic peptide 43GAP26 (500 μM; n = 21), 3 mM octanol (n = 11), Px mimetic peptide 10Px1 (300 μM; n = 9), and 20 μM carbenoxolone (n = 7) in the bath. The traces presented in different panels were obtained from four different cells, which were held at −70 mV and polarized by 100-ms voltage pulses between −100 and 50 mV with the 10-mV decrement, as shown in the top left panel. (B) VG currents on the 100-ms depolarization to 20 mV recorded in control cells (n = 32) and in cells preincubated either with 10Px1 (300 μM; n = 7) or with 43GAP26 (300 μM; n = 12) for 30 min. The difference between the averaged current magnitudes in control and in the presence of 10Px1 is not statistically significant at the P < 0.05 confidence level. (C) Evolution of steady-state VG currents measured in the end of voltage pulses (•, ▾) and ATP sensor responses (○, ▵) after the addition of 43GAP26 (300 μM; •, ○; n = 14), and Px1 mimetic peptide 10Px1 (300 μM; ▾, ▵; n = 9) to the bath at t = 0. The VG currents were elicited by the 100-ms depolarization of taste cells from −70 to 0 mV that did not stimulate detectable ATP efflux. The secretion of ATP was elicited by the 2-s depolarization of taste cells to 10 mV. In B and C, the data are presented as a mean ± SD. In all cases, VG currents were recorded with 140 mM CsCl in the recording pipette and 140 mM NaCl in the bath using the perforated patch approach.
The current concept of voltage-dependent gating of hemichannels is based exclusively on studies of recombinant Px1 and Cx's. The transient gating of Px1 hemichannels was analyzed in a few studies, which revealed that these channels activate and deactivate quickly and inactivate slowly (Bruzzone et al., 2003, 2005). The hemichannels formed by Cx30, Cx32, Cx45, Cx46, and Cx50 activate and deactivate slowly and exhibit no inactivation (Castro et al., 1999; Valiunas and Weingart, 2000; Valiunas, 2002; Bader and Weingart, 2004; Essenfelder et al., 2004; Bruzzone et al., 2005). Although the molecular architecture and biophysical properties of natural hemichannels are not known with certainty, it is very likely that kinetically, they are similar to recombinant hemichannels. If so, Cx hemichannels rather than Px1 hemichannels should mediate VG outward currents in type II cells that exhibit slow deactivation and no inactivation (Fig. 1 A). This inference is supported by the following observations.
Several mimetic peptides from extracellular loops of connexon subunits have been demonstrated to inhibit the activity of the particular Cx hemichannels and junctional channels, as well as ATP secretion presumably mediated by connexons (Chaytor et al., 1997, 2001; Leybaert et al., 2003; Martin et al., 2005; De Vuyst et al., 2006). We used distinctive mimetic peptides as a relatively specific probe of hemichannel activity (Romanov et al., 2007) and found that the Cx peptide 43GAP26 dramatically inhibited VG outward currents (Fig. 1, A, first panel from left, and C, filled circles) within 10 min. The other Cx-inhibiting compound octanol (3 mM) suppressed VG outward currents in type II cells as well (Fig. 1 A, second panel). Given that taste cells express Px1 (Huang et al., 2007; Romanov et al., 2007), we also tried the Px mimetic peptide 10Px1 that has been documented to completely inhibit recombinant Px1 hemichannels at the concentration of 100 μM (Pelegrin and Surprenant, 2006, 2007). However, 300 μM 10Px1 affected the VG outward currents very weakly or negligibly (Fig. 1 A, third panel). Consistently, 20 μM carbenoxolone, a more or less specific inhibitor of Px1 hemichannels at the concentration of 5–10 μM (Bruzzone et al., 2005; Pelegrin and Surprenant, 2007), influenced the VG currents insignificantly (Fig. 1 A, fourth panel).
The VG outward currents in type II cells were liable to rundown that could particularly be initiated by high suction pressure needed to obtain gigaseal. Consistently with the reports of others, the effects of the mimetic peptides developed and reversed slowly in our experiments. Therefore, the current rundown could have masked the real evolution of the peptide inhibition. We therefore used another protocol to examine efficacies of the mimetic peptides. Cells were preincubated with the particular peptide for 30 min and then assayed electrophysiologically. In cells pretreated with 300 μM 10Px1, VG outward currents were statistically indistinguishable from those in control cells, whereas a more than twofold decrease in current magnitude was obtained on average in the presence of 300 μM 43GAP26 (Fig. 1 B).
Interestingly, when the VG currents in type II cells decayed spontaneously or under the effect of certain factors, ATP release dropped in parallel. The experiments with the mimetic peptides illustrated in Fig. 1 C exemplify such a correlation. Particularly, 300 μM 43GAP26 suppressed ATP efflux with a time course and a degree of inhibition (Fig. 1 C, open circles) close to those of the VG current (Fig. 1 C, filled circles). With 300 μM 10Px1 in the bath, the ATP secretion (Fig. 1 C, open triangles) and VG outward current (Fig. 1 C, filled triangles) also evolved with well-correlated time courses. However, the slow decline of both processes was most likely spontaneous rather than initiated by 10Px1.
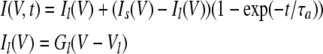
The strong correlation between magnitudes of the VG outward current and ATP efflux implied that both were mediated by the same ion channels, which were permeable to ATP, inhibitable with 43GAP26 and octanol, and negligibly sensitive to 10Px1 and carbexolone (Fig. 1) (Romanov et al., 2007). In several experiments, we therefore examined the ATP permeability of these hemichannels. Note that hemichannels are weakly selective and can transport small molecules up to 1 kD (Goodenough and Paul, 2003), so that their relative cation/anion permeability could not be easily estimated in ion-substitution experiments. Moreover, in physiologically relevant solutions, ATP can aggregate with different species, including monovalent and divalent ions. For example, in the simplest intracellular solution containing 1 mM MgATP and 145 mM KCl, the main ATP species were estimated by us to be [ATP−4] = 170 μM, [KATP−3] = 270 μM, [HATP−3] = 90 μM, and [MgATP−2] = 460 μM at pH 6.8 and 25°C. To simplify the analysis, we dialyzed and perfused taste cells with solutions containing exclusively MgATP, which were adjusted to pH 7.4 by adding the equimolar quantity of Mg(OH)2. Such a solution should contain mostly Mg2+ and MgATP2− ions and a negligible quantity of other species. Particularly, with 50 mM MgATP plus 50 mM Mg(OH)2 in a solution, calculations gave that at pH 7.4 and 25°C, it should contain 21.0 mM MgATP−2, 21.1 mM Mg+2, and 28.9 mM Mg2ATP. For 12.5 mM MgATP plus 12.5 mM Mg(OH)2, 7.04 mM MgATP−2, 7.1 mM Mg+2, and 5.42 mM Mg2ATP should be present in a solution.
With 50 mM MgATP plus 50 mM Mg(OH)2 both in the recording pipette and in the bath, the slowly activating/deactivating VG currents were still observed in type II cells, indicating that the channels involved were permeable to MgATP2− and/or to Mg2+ (Fig. 2 A, middle). The reduction of extracellular MgATP+Mg(OH)2 from 50 to 12.5 mM led to a small increase in the inward component of the whole cell (WC) current, slightly decreased its outward component, and shifted the reversal potential Vr of the VG current positively by 3.8 ± 0.8 mV (n = 4) (Fig. 2, A and B). These observations can be accounted for, as the plasma membrane is a little bit more permeable to MgATP−2 compared with Mg2+. To estimate the relative ATP/Mg permeability, we used the Goldman-Hodgkin-Katz equation (Goldman, 1943):
 |
(1) |
Figure 2.

VG currents in taste cells dialyzed and perfused with MgATP+Mg(OH)2. (A) Representative WC currents (n = 4) recorded from the same cell perfused with 50 mM MgATP+Mg(OH)2 (middle) and with 12.5 mM MgATP+Mg(OH)2 (bottom). The currents were recorded with 50 mM MgATP+Mg(OH)2 in the recording pipette. Taste cells were patched in the bath solution containing 140 mM NaCl that was substituted for 50 mM MgATP+Mg(OH)2 after obtaining the WC mode. (B) Voltage current curves generated with 50 mM (•) and 12.5 mM (○) MgATP+Mg(OH)2 in the bath. With 50 mM MgATP+Mg(OH)2 both in the recording pipette and in the bath, WC currents did not reverse at 0 mV, as membrane voltage was not corrected for the liquid junction potential of ∼10 mV between solutions containing 140 mM NaCl and 50 mM MgATP+Mg(OH)2, respectively. Nearly the same junctional potential arose across the boundary between the solutions containing 140 mM NaCl and 12.5 mM MgATP+Mg(OH)2. Because the lifetime of stable WC preparations was very short with high MgATP+Mg(OH)2 in the pipette, neither serial resistance nor cell capacitance was compensated for in the presented recordings.
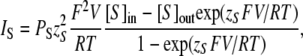
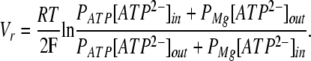
where R, T, and F are of common meaning, IS is the current carried by ion S, PS is the membrane permeability for ion S, zS is the charge of ion S, V is the membrane voltage, and [S]in and [S]out are the intracellular and extracellular concentrations of ion S, respectively. With [Mg2+]in = [ATP2−]in and [Mg2+]out = [ATP2−]out, Eq. 1 gives for the zero current voltage:
 |
(2) |
In line with the above calculations, [ATP2−]in/[ATP2−]out = 3 with 50 mM MgATP+Mg(OH)2 in the pipette and 12.5 mM MgATP+Mg(OH)2 in the bath. Consequently, the substitution of 50 mM MgATP+Mg(OH)2 for 12.5 mM MgATP+Mg(OH)2 in the extracellular media should shift the reversal potential of the current carried by MgATP2− and Mg2+ ions by the value:
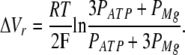 |
(3) |
From Eq. 3, the 3.8-mV shift of Vr (Fig. 2 B) should take place at PATP/PMg = 1.8.
Collectively, the experimental findings (Fig. 2) and calculations (Eq. 3) indicate that hemichannels carrying VG currents in type II cells are indeed permeable to ATP well enough to mediate ATP secretion.
Depolarization Stimulates ATP Secretion without Ca2+ Mobilization
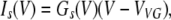
Reportedly, recombinant Px1 hemichannels are gated both by membrane voltage and by intracellular Ca2+ (Bao et al., 2004; Barbe et al., 2006; Locovei et al., 2006a, 2006b). Based on these findings, Huang et al. (2007) have speculated that depolarization and elevation of intracellular Ca2+ are the obligatory concurrent cellular events necessary to initiate secretion of the afferent neurotransmitter ATP through Px1 hemichannels in a tastant-stimulated type II taste cell. Although Clapp et al. (2006) and Huang et al. (2007) have found insignificant Ca2+ deviations in the cytoplasm of type II cells depolarized with 50 mM of bath KCl, we wondered whether depolarizing voltage pulses releasing ATP from type II cells could elevate Ca2+ in their cytoplasm, given that 50 mM KCl elicited only moderate depolarization. In several experiments, we monitored cytosolic Ca2+ in taste cells loaded with 4 μM Fluo-4 and simultaneously assayed their physiological activity with the patch-clamp technique and used the ATP biosensor.
We first evaluated the sensitivity of our approach by recording VG Ca2+ currents and Fluo-4 fluorescence in type III taste cells. With 140 mM Na+ and 1 mM Ca2+ in the bath, depolarization of type III cells typically elicited large (up to 2 nA) VG Na+ currents (Fig. 3 A, dashed line) and much smaller (10–50 pA) VG Ca2+ currents (Fig. 3 A, dotted line) carried mostly through L-type Ca2+ channels (Romanov and Kolesnikov, 2006). By stimulating Ca2+ entry into a taste cell, 100-ms depolarizing voltage pulses (Fig. 3 A, top) triggered a well-resolved voltage-dependent change in Fluo-4 fluorescence (Fig. 3 B). In the representative experiment illustrated in Fig. 3 (A and B), the 100-ms depolarization of a type III cell to −10 mV elicited the Ca2+ current of 40 pA, which was equivalent to the Ca2+ influx of 2 × 10⁻¹⁶ mol/sec and therefore elevated the total intracellular calcium by 0.1 s × 2 × 10−16 mol/sec = 2 × 10⁻¹⁷ mol upon the stimulation. The binding capacity of intracellular Ca2+ buffer is characterized by the binding ratio = Δ(bound Ca2+)/Δ(free Ca2+) that exceeds 100 in most studied cells (Neher, 1995). Therefore, at least 99 of every 100 Ca2+ ions entering into the cytoplasm of taste cells are likely to be captured by Ca2+ buffer. Taking the taste cell volume of 10−12 l, we estimated that 40 pA Ca2+ current lasting 100 ms (Fig. 3 A) elevated intracellular free Ca2+ by a value not exceeding (1–0.99) × 2 × 10−17 mol/10−12 l = 200 nM (Ca2+ peak in Fig. 3 B). From this estimate, we evaluated the upper limit for the peak-to-peak noise of Fluo-4 fluorescence (Fig. 3 B) to be equivalent to 20 nM Ca2+. Thus, the Fluo-4 loading protocol and optical system used by us allowed for the detection of any deviations of intracellular Ca2+ above 20 nM.
Figure 3.

ATP release on electrical stimulation is not accompanied by a change in intracellular Ca2+. (A and B) Representative simultaneous recordings of ionic currents and fluorescence in a type III cell loaded with 4 μM Fluo-4 (n = 6). The depolarization of the taste cell to −10 mV for 100 ms (A and B, top panels) elicited the VG Ca2+ current (A, bottom panel, dotted line) that produced the Ca2+ transient monitored as an increase in Fluo-4 fluorescence (B, bottom panel). A relative change in fluorescence intensity is expressed as ΔF/F0, where F0 is a value of Fluo-4 emission measured just before cell stimulation. (C and D) Representative concurrent recordings of ionic currents (middle panel) and Fluo-4 fluorescence (bottom panel) in a type II cell (n = 21). Unlike ionomycin, 2-s depolarization (top panel) did not affect intracellular Ca2+ in 17 of 21 type II cells (C). In 4 out of 21 cells, depolarization induced a small increase in Fluo-4 fluorescence (D). (E) Representative concurrent recordings of a membrane current and intracellular Ca2+ in a type II cell and an ATP sensor response (n = 9). The 5-s depolarization (top panel) of the taste cell produced no change in cytosolic Ca2+ (the second trace from the bottom) but triggered ATP release, thereby stimulating the ATP sensor (bottom panel). The recording conditions were as in Fig. 1.
Next, we examined whether the electrical stimulation of type II cells was accompanied by a change in cytosolic Ca2+. Of 21 cells tested, most showed an insignificant deviation of Fluo-4 fluorescence from the basal level (Fig. 3 C, bottom) in response to 2-s depolarizing voltage pulses (Fig. 2 C, top) that normally triggered ATP release. In four cells, strong depolarization induced a small increase in Fluo-4 fluorescence (Fig. 3 D). At the moment, we are uncertain about the nature of these voltage-dependent fluorescent signals. In any event, they were small and equivalent to a change in intracellular Ca2+ by a value not exceeding 100 nM. Thus, activity of VG Ca2+-permeable channels was generally negligible in type II taste cells.
In nine experiments, intracellular Ca2+ in taste cells and their secretion of ATP were monitored concurrently. Although the apt depolarization inevitably stimulated ATP release, it affected cytosolic Ca2+ insignificantly (Fig. 3 E). Collectively, these observations showed that ATP efflux (Fig. 3 E) was initiated primarily by the electrical stimulation of ATP-permeable channels with no visible contribution of Ca2+-driven mechanisms. Consistently, electrically stimulated ATP secretion was affected only slightly when bath Ca2+ was reduced from 1 mM to 100 nM (Romanov et al., 2007).
The Dependence of ATP Secretion on the Value and Duration of Depolarizing Voltage Pulses
The findings described above (Fig. 1 A) suggested that hemichannels carrying VG outward currents in type II cells and permeable to ATP (Fig. 2) are principally formed by Cx subunits. Nevertheless, the possibility still remained that despite an apparently negligible contribution to the VG currents, Px1 hemichannels could transport a substantial fraction of ATP efflux due to much higher permeability to ATP at the physiological conditions compared with the Cx hemichannels. We therefore performed several experiments to probe kinetic features of the channels involved in ATP secretion in type II taste cells. As demonstrated in the consequent sections, the rate of deactivation of ATP-permeable channels can markedly influence a voltage dependence of ATP release.
Theoretical Rationale
To illustrate the main idea of the following experiments, we first consider hypothetical “Px1 hemichannels” and “Cx hemichannels,” postulating by analogy with recombinant hemichannels that the former activate/deactivate rapidly and inactivate slowly, whereas the latter activate/deactivate slowly and do not inactivate. At depolarizing voltages, a driving force for permeant ATP anions is relatively low, but it largely increases on membrane repolarization to negative holding potential, thereby greatly augmenting ATP efflux. If a duration of a depolarizing voltage pulse is comparable with the characteristic time of Px1 hemichannel inactivation (Fig. 4 A, middle), the bulk of ATP should be released during the activation/inactivation phase (Fig. 4 A, bottom), as a deactivating pannexon closes too rapidly (Fig. 4 A, middle). In contrast, a significant fraction of ATP released in total can be mediated by a slowly deactivating connexon during membrane repolarization (Fig. 4 B, bottom). It therefore appears that a fractional contribution of the tail ATP efflux to released ATP can serve as a criterion to distinguish between quickly and slowly deactivating ATP-permeable hemichannels.
Figure 4.

Simulations of hemichannel gating and voltage-dependent ATP efflux. (A and B) Transient integral conductance (middle panels) mediated by Px1 hemichannels (A) and Cx hemichannels (B) stimulated by the depolarizing voltage pulse from Vh to V (top panel) for T seconds. The Px1 conductance was calculated in an arbitrary unit (AU) with Eqs. 7 and 9 at V = 10 mV, Vh = −70 mV, Vg = 50 mV, Vg0 =13 mV, and τa = τd = τi/50 = T/250. The Cx conductance was calculated with Eqs. 8 and 9 at V = 10 mV, Vh = −70 mV, Vg = 50 mV, Vg0 = 13 mV, and τd = τa/10 =T/50. The related transient ATP efflux (bottom panels) was calculated by using Eqs. 7–9 and Eq. 6 with L = 1, z = 2, i.e., at V0 = 13 mV, r = 0. (C and D) Normalized quantity of ATP released via Px1 hemichannels versus membrane voltage calculated using Eqs. 11–13 at τa = τd = τi/50 and with T = 50τi (C) and T = 5τi (D). (E and F) Normalized quantity of ATP released via Cx hemichannels versus membrane voltage calculated using Eqs. 11, 12, and 14 at τd = τa/10 and with T = 50τa (E) and T = 5τa (F). The details are in the text.
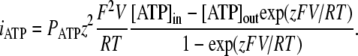
To estimate a fractional current iATP carried by ATP ions through a single ATP-permeable channel, we used Eq. 1 in the following form:
 |
(4) |
The value of transient ATP efflux JATP(V,t) triggered by a given depolarizing voltage pulse can be written as:
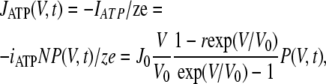 |
(5) |
where J0 = PATPFN [ATP]in/e; V0 = RT/zF; r = [ATP]out/[ATP]in, with P(V,t) the transient open probability; IATP is the absolute value of the fractional current curried by ATP ions; and N is the total number of ATP-permeable channels, with e the elementary charge. Given that G = γNP and suggesting that ATP anions carry a small fraction of current under the physiologically relevant conditions, Eq. 5 can be rewritten as:
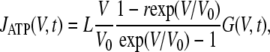 |
(6) |
where L = PATPF [ATP]in/γe, with γ the unitary conductance of an ATP-permeable channel, and G(V,t) is the integral ATP-permeable conductance.
Because the open probability of both Cx and Px1 hemichannels at high negative voltages is low enough in heterologous systems (Bruzzone et al., 2005; Gonzalez et al., 2007), we neglected Cx/Px1 conductance at resting potentials to simplify the computations discussed below. Moreover, activation, inactivation, and deactivation of the model Px channel as well as activation and deactivation of the model Cx channel were taken as mono-exponential. In line with these simplifications, the following analytical approximation was used here to simulate a transitory change in Px1-mediated conductance in response to membrane depolarization at 0 ≤ t ≤ T, followed by repolarization to the holding potential Vh:
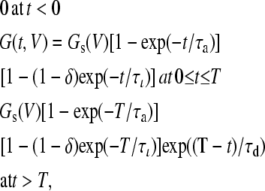 |
(7) |
where δ ≈ Gm(V)/Gs(V) at τι » τa, Gm(V) and Gs(V) are the maximal and steady-state conductances at given membrane voltage V, respectively; and τa, τι, and τd are the time constants of activation, inactivation, and deactivation, respectively, which may vary with voltage.
For the Cx-mediated conductance:
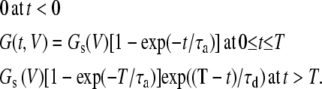 |
(8) |
As a function of membrane voltage, the gap-junctional conductance mediated by connexons obeys the Boltzmann equation (Gonzalez et al., 2007). We therefore used the following expression to describe the steady-state conductance:
 |
(9) |
where G0 is the maximal conductance, Vg is the voltage value of half-activation, Vg0 = RT/nF, and n is the equivalent number of elementary charges moving through the entire electric field. The apparent gating charge and half-activation voltage obtained for a variety of connexons ranges within 1.3 ≤ n ≤ 11.3 and 10 < Vg < 100 mV (Gonzalez et al., 2007). In the simulations below, we used n = 2, i.e., Vg0 =13 mV and Vg = 50 mV.
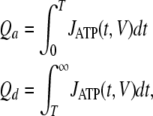
For convenience, QATP, the total quantity of ATP released on a depolarizing voltage pulse, was presented as QATP = Qa + Qd with:
 |
(10) |
where Qa and Qd are the quantities of ATP released by a channel during its activation/inactivation and deactivation, respectively. By combining Eqs. 6–10, the following relations can be derived:
 |
(11) |
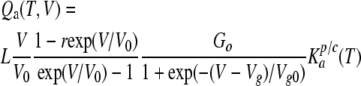 |
(12) |
where the temporary factors  and
and  are determined by the following expressions for Px1- and Cx-mediated ATP secretion, respectively:
 |
(13) |
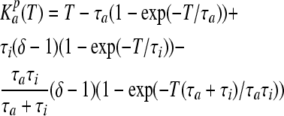 |
 |
(14) |
Given the analytical structure of Eqs. 11 and 12, a bell-like dependence on membrane voltage should be characteristic of Qa (Fig. 4, C–F, dotted lines), whereas Qd should follow a Langmuir isotherm–like curve (Fig. 4, C–F, dashed lines). Thus, the relative contribution of the tail ATP efflux, i.e., Qd, to the total quantity of released ATP can be judged by a dependence of QATP on membrane voltage.
Note again that ATP can aggregate with different species in the cell cytoplasm. Although it was unclear a priory which of the ATP anions is the main carrier of the fractional ATP current under the physiological conditions, we calculated Qa, Qd, and QATP = Qa + Qd at z = 2, assuming MgATP−2 to solely mediate ATP efflux. Besides, it was taken in Eqs. 11–14 that LG0 = 1, r = 0, Vg = 50 mV, Vg0 =13 mV, and τa = τd = τi/50 at all voltages for Px1 hemichannels, and τd = τa/10 for Cx hemichannels. With such parameters, a bell-like voltage dependence for QATP was simulated for quickly deactivating Px1 hemichannels at both relatively prolonged (T = 50τi) and short (T = 5τi) stimulations (Fig. 4, C and D). In this case, Qa (Fig. 4, C and D, dotted lines) expectedly exceeded Qd (Fig. 4, C and D, dashed lines) at physiologically relevant voltages and T > τi, thereby predetermining the bell-like shape of their sum (Fig. 4, C and D, solid lines). For slowly deactivating Cx hemichannels, a relative contribution of Qd should be much higher, especially at short stimulations, so that as a function of membrane voltage, QATP can be differently shaped, depending on pulse duration. Indeed, at the prolonged stimulation (T = 50τa), the relative contribution of Qd was low (Fig. 4 E, dashed line), and QATP exhibited a bell-like dependence on membrane voltage (Fig. 4 E, solid line). With T = 5τa, QATP saturated at high voltages (Fig. 4 F, solid line) due to the predominant contribution of the tail ATP efflux to ATP secretion (Fig. 4 F, dashed line).
It should be noted that curves qualitatively similar to those presented in Fig. 4 (C–F) could be generated with rapidly deactivating Cx hemichannels versus slowly deactivating Px1 hemichannels, although quantitative details were certainly dependent on all model parameters (not depicted). Thus, a voltage dependence of ATP release stimulated by short voltage pulses is largely determined by the deactivation kinetics of ATP-permeable channels.
Experimental Findings
Transient Gating of Hemichannels in Type II Taste Cells.
Because our observations pointed to hemichannels responsible for VG currents in type II cells as a likely contributor to electrically stimulated ATP secretion (Figs. 1 C and 2) (Romanov et al., 2007), we simulated transient ATP efflux at varying voltages, based on kinetics of VG outward currents in type II cells. In response to an appropriate depolarizing voltage pulse, these taste cells showed a fast inward Na+ current followed by a slowly activating outward current (Fig. 5 A). The last was satisfactorily fitted with the expression (Fig. 5 A, circles):
 |
 |
(15) |
where Il and Is are the leakage current and steady-state VG current, respectively; Gl and Vl are the conductance and reversal potential of the leakage current; and Gs and VVG are the steady-state conductance and reversal potential of the VG current, respectively. Our estimates gave VVG = −4 ± 1.3 mV on average (n = 7). The steady-state conductance (Fig. 5 B, triangles) versus membrane voltage followed the Boltzmann equation (Fig. 5 B, solid line):
 |
(16) |
The maximal conductance Gmax was evaluated to be 56 ± 8 nS on average (n = 7).
Figure 5.

Voltage-dependent kinetics of VG currents mediated by hemichannels in a type II taste cell. (A) VG currents recorded at different voltages were fitted (•) with Eq. 15. (B) Normalized steady-state conductance Gs/Gmax versus membrane voltage. For given voltage, Gs (▵) was obtained by fitting a corresponding current trace with Eq. 15. To compare different experiments, Gs was normalized to the maximal conductance Gmax obtained for a given cell. The solid line corresponds to Eq. 16 with Vg = 31 mV and  = 11 mV. (C) Tail currents (continuous lines) were approximated with Eq. 17 (•). (D) Potential dependence of the characteristic time of activation (▾) and deactivation (▪) of VG currents. The thick and thin lines correspond to Eqs. 18 and 19, respectively. In all cases, the recording conditions were as in Fig. 1. In B and D, the data are presented as a mean ± SD (n = 7).
The time course of channel deactivation was obtained by fitting tail currents with the equation (Fig. 5 C, circles):
 |
(17) |
where the peak tail current was described as 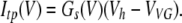 Note that the activation/deactivation kinetics of the VG outward current depended on membrane voltage. By analyzing the activation phase at different voltages with Eq. 15, we averaged τa values over experiments (n = 7) and approximated the obtained dependence (Fig. 5 D, triangles) with the equation (Fig. 5 D, thick line):
 |
(18) |
where  = 10 ms,
  = 15 ms,
  = 12.7 mV, and Va = 15 mV. The similar analysis yielded the following dependence (Fig. 5 D, thin line) for τd (Fig. 5 D, squares):
 |
(19) |
with  = 5.4 ms,
  = 4.0 ms,
  = 12.7 mV, and Vd = 32 mV.
By using Eqs. 11–14 and 17–19, we calculated the relative quantity of ATP that could be released by a taste cell at different voltages, provided that the hemichannels transporting VG outward currents were the only pathway. With 2-s voltage pulses and z = 2, calculations predicted that Qa (Fig. 6 A, dotted line) significantly exceed Qd (Fig. 6 A, dashed line) for V < 60 mV, thus yielding a bell-like dependence of the total ATP QATP = Qa + Qd on membrane voltage (Fig. 6 A, thick line). With ATP4− as a permeable anion, i.e., at z = 4, the voltage dependence of QATP became biphasic (Fig. 6 A, thin line), owing to an increased contribution of Qd. For 100-ms depolarization, QATP saturated at positive voltages with both z = 2 and z = 4 (Fig. 6 B, thick and thin lines), as ATP was predominantly released during slow deactivation.
Figure 6.

Dependence of ATP secretion on membrane voltage. (A and B) Calculated quantity of ATP released on 2-s (A) and 100-ms (B) electrical stimulations. The thick lines depict the total ATP quantity versus membrane voltage calculated as QATP = Qa + Qd using Eqs. 11, 12, and 14 with the following parameters: G0 = 1, r = 0, V0 = RT/zF = 13 mV at z = 2, Vg and Vg0 as in Eq. 16, and with τa and τd determined by Eqs. 18 and 19, respectively. The dotted and dashed curves correspond to Eqs. 11 and 12, respectively, at the parameters mentioned above. The thin curve describes QATP = Qa + Qd calculated with z = 4 and the other parameters as above. Each dependence in A and B was normalized to the maximal value of QATP. (C) Normalized response of the ATP sensor (•) versus voltage clamped on the plasma membrane of an assayed taste cell. The ATP responses were recorded at 2 s of depolarization of taste cells. The thick and thin curves were obtained by converting QATP calculated at z = 2 and z = 4 (thick and thin curves in A, respectively) into ATP sensor responses using Eq. 20 with  = 0.49. Both experimental and simulated responses were normalized to the corresponding maximal value. (D) ATP responses (▾) recorded at the serial stimulation of taste cells by 100-ms pulses for 2 s. The thick and thin curves were obtained by converting QATP calculated at z = 2 and z = 4 (thick and thin curves in B) into ATP sensor responses using Eq. 20 with
  = 0.49. The responses were normalized to a value of the maximal response. The experimental data are presented as a mean ± SD (n = 5–8). The recording conditions were as in Fig. 1.
The Dependence of ATP Secretion on Membrane Voltage.
In consequent experiments, we examined the voltage dependence of ATP secretion in taste cells. As detailed earlier (Romanov and Kolesnikov, 2006; Romanov et al., 2007), ATP-secreting cells (type II) were identified and stimulated using the patch-clamp technique, whereas ATP release was assayed by monitoring Ca2+ transients in nearby ATP-responsive COS-1 cells loaded with the Fluo-4 dye. Although released ATP could not be accurately quantified with this approach, the relative quantity of ATP released by a taste cell on comparatively short (<8 s) depolarization could roughly be estimated from a sensor response R using the equation (see Appendix):
 |
(20) |
where Rmax is the maximal response, and Q1/2is the quantity of released ATP needed to elicit the half-response.
When taste cells were depolarized for 2 s, normalized ATP-sensor response versus membrane voltage exhibited a bell-like dependence (Fig. 6 C, circles). Note that for depolarizing voltage pulses shorter than 400 ms, taste cells did not release enough ATP to be reliably perceived by the ATP sensor (not depicted). To assay ATP secretion at 100-ms stimulations, a taste cell was subjected to 100-ms depolarization every 200 ms for 2 s so that its ATP secretion was well detectable with our approach (Fig. 6 D, triangles). Given that Ca2+ transients were negligibly small in stimulated type II cells even at prolonged depolarization (Fig. 3, C–E) and that hemichannels deactivated completely within 100 ms (Fig. 5, A and C), 100-ms secretory events stimulated in series were apparently independent of each other. We therefore believe that the curve obtained with the serial stimulation (Fig. 6 D, triangles) characterizes adequately the potential dependence of ATP secretion at T = 100 ms.
Thus, as a function of membrane voltage, ATP secretion exhibited the prominent maximum at 2-s stimulations and showed saturation at high depolarizing voltages for 100-ms pulses. In line with the simulations described above (Fig. 4, E and F), such a switch from a bell-like dependence to a saturating curve (Fig. 6, C vs. D) implicates slowly deactivating channels in mediating ATP secretion. In support of this idea, the experimental responses of the ATP sensor (Fig. 6, C and D, symbols) were reproduced theoretically with surprising accuracy, assuming the hemichannels responsible for VG outward currents in type II cells as a primary pathway for ATP release. In this case, QATP was calculated with Eqs. 11–14 and 17–19 (Fig. 6, A and B) and then converted into sensor responses using Eq. 20 at appropriate Q1/2. As illustrated in Fig. 6 (C and D) by the thick lines computed with = 0.49 and z = 2, simulated ATP sensor responses nicely fitted the experimental dependencies at both prolonged (Fig. 6 C; T=2 s) and short (Fig. 6 D; T=100 ms) stimulations. This is consistent with our electophysiological data (Figs. 1 C and 2), which also suggest that the slowly deactivating hemichannels provide a reciprocal pathway for both the VG outward currents and ATP efflux. Given that the appropriate reproduction of the experimental data were not achievable at z = 4 (Fig. 6, C and D, thin lines) as well as at z = 1 and z = 3 (not depicted), MgATP−2 might be the main permeant species.
DISCUSSION
A variety of cells releases ATP to fulfill certain cellular functions, including neurotransmission, autocrine/paracrine regulations, and maintenance of Ca2+ waves along tissues (Stout et al., 2002; Lazarowski et al., 2003; Fields and Burnstock, 2006; Locovei et al., 2006b). The complete loss of neuronal responses to tastants of all taste modalities and dramatically reduced behavioral responses to sweet, bitter, and umami substances in P2X2/P2X3 double knockout mice have implicated ATP in the afferent neurotransmission of sensory information in the mammalian taste bud (Finger et al., 2005). Consistently with such a role of this purine nucleotide, type II taste cells, which are bitter-, sweet-, and umami-sensitive, have been demonstrated recently to release ATP on their depolarization (Romanov et al., 2007) and on taste stimulation (Huang et al., 2007). The evidence provided by both studies indicated that these chemosensory cells released ATP via hemichannels rather than by using the Ca2+-dependent exocytotic mechanism. Based on their own observations and positing a general argumentation, Huang et al. (2007) reasoned in favor of Px1 as the pivotal channel subunit responsible for the formation of functional ATP-permeable hemichannels. Specifically, they showed that Px1 is the most abundant junctional protein expressed in taste cells, and that ATP secretion in taste cells was inhibited by 5 μM carbenoxolone found to exert the specific blockage of recombinant Px1 hemichannels at this concentration (Bruzzone et al., 2005; Barbe et al., 2006; Pelegrin and Surprenant, 2006, 2007). Moreover, Huang et al. (2007) leaned on several reports suggesting that Px's do not simply duplicate Cx's as gap junction proteins but may serve a unique cellular function. Particularly, Dahl and Locovei (2006) have hypothesized that in vertebrates, Px's are retained mainly to serve as pannexons and that the specific cellular function of Px1 is to serve as an ATP release channel.
Although Cx hemichannels have been proposed to mediate non-exocytotic ATP release in several cells (e.g., Stout et al., 2002; Braet et al., 2003), Dahl and Locovei (2006) argued against such a possibility, suggesting instead that just Px1 hemichannels create a cellular conduit of ATP secretion. Their argument is as follows: (1) In the family of nearly 20 members, very few Cx's have been documented to form functional hemichannels in heterologous systems. Their expression in vivo is very restricted and absent in certain cells known to release ATP, for instance, in erythrocytes; (2) The prolonged high depolarization (>50 mV) and/or low extracellular Ca2+ are required to activate Cx hemichannels, conditions that are not physiologically relevant; and (3) The evidence for the possible involvement of connexons in ATP release comes mainly from pharmacological interventions, although most substances known to interfere with Cx's can also affect other ion channels, including Px1 hemichannels. Although these arguments appear credible, the recent studies provide convincing evidence in favor of Cx hemichannels as a pathway for ATP secretion. Particularly, Kang et al. (2008) observed openings of individual Cx43 hemichannels even at moderately negative voltages in both cell-attached and inside-out patch recordings from C6 cells expressing Cx43. They also demonstrated that Cx43 hemichannels are greatly permeable to ATP. The knockdown of Cx36 in cultured rat cortical neurons dramatically suppressed their ATP secretion (Schock et al., 2008), thus leaving little doubts about the involvement of this particular Cx.
The identification of ATP-releasing hemichannels in natural cells is a complicated issue for several reasons. Particularly, natural hemichannels are poorly studied, and their molecular identity and functional properties are not known with confidence. Highly effective subtype-selective inhibitors are not available even for recombinant Cx's and Px's. Meanwhile, in natural cells that typically express multiple channel proteins, a functional hemichannel may be a heterooligomer of several different subunits (Bruzzone et al., 2003, 2005; Mese et al., 2007) with cell-specific properties, including sensitivity to blockers. Specifically, type II taste cells express Px1 and several Cx's, including Cx26, Cx30.3, Cx31.1, Cx33, and Cx43 (Huang et al., 2007; Romanov et al., 2007). A few of these channel proteins can form functional hemichannels. Here, we used the inhibitory analysis and other physiological methods in combination with mathematical modeling to elucidate the involvement of Cx and Px1 hemichannels in electrically stimulated ATP release in taste cells.
The following summarizes our findings. The Cx mimetic peptide 43Gap26 and octanol, both known to inhibit certain recombinant Cx hemichannels, effectively block VG currents and electrically stimulated ATP secretion in type II cells (Fig. 1) (Romanov et al., 2007). The ion channels carrying the VG currents are ATP permeable (Fig. 2). In contrast, neither the VG currents nor ATP secretion is markedly sensitive to the 300-μM 10Px1 peptide and to 5–20 μM carbenoxolone, more or less specific Px1 inhibitors at these concentrations (Fig. 1 C) (Romanov et al., 2007). The experimental voltage dependencies of ATP secretion obtained at 2-s and 100-ms depolarization (Fig. 6, C and D) and simulations performed with the model of ATP secretion (Figs. 4 and 6, A and B) indicate that type II cells release ATP via slowly deactivating channels. Consistently, the experimental data on ATP secretion were reproduced theoretically with reasonable accuracy (Fig. 6, C and D), assuming that the slowly deactivating hemichannels transporting VG currents in type II cells were completely responsible for ATP release.
If Px1 can form the VG channels responsible for VG outward currents and most likely for electrically stimulated ATP secretion in type II, these natural Px1 hemichannels should dramatically differ from recombinant Px1 hemichannels in their properties. They should be slowly deactivating, blockable with 43Gap26 and octanol, and insensitive to 10Px1 and carbenoxolone at relevant concentrations. In contrast, heterologously expressed Px1 hemichannels deactivate rapidly (Bruzzone et al., 2003; Bruzzone et al., 2005), whereas slow deactivation has solely been documented for Cx hemichannels formed by Cx30, Cx32, Cx45, Cx46, and Cx50 (Castro et al., 1999; Valiunas and Weingart, 2000; Valiunas, 2002; Bader and Weingart, 2004; Essenfelder et al., 2004; Bruzzone et al., 2005). The blockage of recombinant Px1 hemichannels by 43Gap26 has never been reported, whereas 10Px1 has been demonstrated as a quite effective Px1 inhibitor (Pelegrin and Surprenant, 2006, 2007). Collectively, the facts mentioned above argued against Px1 hemichannels but favor Cx hemichannels as key contributors to the VG outward currents and therefore as conduits of ATP efflux stimulated by depolarization in type II cells.
It should be noted that although the VG currents and ATP secretion in type II cells are inhibited by 43Gap26, the mimetic peptide derived from the Cx43 sequence, the molecular identity of the responsible channels, presumably Cx hemichannels, remains to be elucidated. The inhibitory effect of the 43GAP26 peptide on Cx43 hemichannels is apparently mediated by the SHVR amino acid domain present in the first extracellular loop of Cx43 (Warner et al., 1995). Of several Cx's expressed in type II cells, Cx30.3, Cx31.1, Cx33, and Cx43 contain this structural motif and therefore may potentially form homo- and/or heterooligomeric hemichannels sensitive to 43GAP26.
Human Px1 hemichannels expressed heterologously are gated by intracellular Ca2+ with the micromolar half-effect concentration (Locovei et al., 2006b). With the proviso that natural mouse Px1 hemichannels are similarly sensitive to Ca2+, their activity should be negligibly low in resting murine taste cells, which normally maintain cytosolic Ca2+ below 100 nM (Baryshnikov et al., 2003), and even in electrically stimulated type II cells, where intracellular Ca2+ apparently remains at the same low level (Fig. 3 D). Although Ca2+ signals recorded by us in the taste cell cytoplasm were not space resolved, we consider them quite conclusive because in type III cells, small Ca2+ influx via VG Ca2+ channels entailed a well-detectable change in integral Fluo-4 fluorescence (Fig. 3 B). We therefore believe that Ca2+ microdomains, where Px1 might be activated, were absent in voltage-stimulated type II cells. In contrast, taste stimulation can produce both depolarization of a type II cell and a marked Ca2+ transient in its cytoplasm (Huang et al., 2007). Hence, the principle difference between depolarization-triggered ATP efflux and taste-elicited ATP secretion is that the former is apparently controlled by a single factor, i.e., by membrane voltage, whereas taste stimulation initiates both depolarization and intracellular signaling, at least Ca2+ signaling. Despite numerous attempts, we were unable to perform the reliable comparison of taste-evoked and voltage-stimulated ATP release, as a too small fraction (<5%) of type II taste cells generated taste-specific responses in our experiments (Romanov et al., 2007). Thus, a relative contribution of the voltage-governed pathway, presumably Cx based, and a Ca2+-dependent mechanism, perhaps Px1 mediated, to ATP secretion triggered by taste stimulation remains uncertain.
Acknowledgments
This work was supported by the Program “Molecular and Cell Biology” of the Russian Academy of Sciences (award to S.S. Kolesnikov), the Russian Foundation for Basic Research (grants 04-08-00033 to S.S. Kolesnikov), the Russian President Program for Young Scientists (grants MK-1332.2008.4 to R.A. Romanov and MK-783.2007.4 to O.A. Rogachevskaja), and the “Russian Science Support Foundation” (award to R.A. Romanov).
Edward N. Pugh Jr. served as editor.
APPENDIX
Cellular ATP Sensor.
Cells of the COS-1 line, which respond to bath ATP with Ca2+ mobilization (Romanov et al., 2007), were used to monitor ATP secretion from individual taste cells. When stimulated by bath application of ATP at varied concentrations, individual COS-1 cells were differently responsive to the nucleotide (Fig. A1 A). Certain cells exhibited a much higher sensitivity to nanomolar ATP, and those could be easily distinguished by their faster and higher responses to the nucleotide (Fig. A1 A, thick lines). Such sensitized cells were typically used as an ATP sensor. The dose-response curve, which was obtained by averaging ATP responses over the whole population of examined COS-1 cells (n = 37) (Fig. A1 B, circles), was fitted with the Hill equation:
 |
(A1) |
where Rmax is the maximal response, the half-response ATP concentration is [ATP]1/2 = 270 nM, and the Hill coefficient is nH = 1.5 (Fig. A1 B, thin line). For sensitized COS-1 cells, [ATP]1/2 = 160 nM and nH = 2 were obtained on average (n = 12) (Fig. A1 B, triangles and thick line). When stimulated by relatively short (<8-s) pulses of ATP at concentrations of 100–1,000 nM, the sensitized COS-1 cells generated Ca2+ transients of more or less universal shape. As exemplified in Fig. A1 C (left), the averaged and normalized responses elicited by the 2-s application of 150, 300, and 1,000 nM ATP (dotted, thick, and thin lines, respectively) overlap almost completely. The responses were well fitted with the equation:
 |
(A2) |
Figure A1.

ATP-induced Ca2+ transients in Fluo-4–loaded COS-1 cells. (A) Superimposition of Ca2+ transients elicited by a 2-s application of 75–1,000 nM ATP in eight COS-1 cells assayed simultaneously. (B) Dose-response curves characterizing the whole population of tested COS-1 cells (•) and COS-1 cells selected as most sensitive to ATP (▾). The thick and thin lines represent the approximations of experimental dependencies with Eq. A1 at [ATP]1/2 = 160 nM and nH = 2 and [ATP]1/2 = 270 nM and nH = 1.5, respectively. (C; left) The superimposition of averaged (n = 4) responses to ATP applied at the concentration of 150 (dotted line), 300 (thick line), and 1,000 nM (thin line) for 2 s. Each response was normalized to its magnitude. (Right) The fit (○) of the averaged response to 300 nM ATP (solid line) with Eq. A2 at α = 0.32 s−1, β = 0.15 s−1, and t0 = 8.1 s. AU, arbitrary unit. (D) Averaged (n = 4) responses to 300 nM ATP applied for 2 (left panel) and 8 s (right panel). In C and D, all responses were recorded from COS-1 cells selected by their high sensitivity to ATP (thick lines in A). In all cases, cells were incubated in the basic extracellular solution and stimulated by bath application of ATP dissolved in the same solution.
Such an approximation of the averaged response to 300 nM ATP (Fig. A1 C, right, solid line) yielded α = 0.32 s−1, β = 0.15 s−1, and t0 = 8.1 s (Fig. A1 C, right, circles). For 150 and 1,000 nM ATP, nearly the same values of the parameters were obtained. Even when ATP was applied for 8 s, the characteristic time of delay of sensor responses relative to the beginning of ATP application, COS-1 cells generated Ca2+ transients of the quite similar shape, although with increased magnitudes compared with the 2-s stimulation (Fig. A1 D). Given that these observations (Fig. A1, C and D) suggested signaling mechanisms shaping ATP responses to be very slightly sensitive to time cause of ATP stimulation lasting less than t0 ∼8 s, short ATP stimuli could virtually be considered instant. As predicted by the Einstein equation l2 = 6Dt, the characteristic distance of ATP diffusion should exceed 200 μm for t = 8 s and D = 10−6 sm2sec−1. This estimate indicates that ATP instantly released from a 20-μm cell should undergo nearly 1,000-fold dilution in 8 s. It therefore appears that for short electrical stimulations of taste cells, the model, wherein momentarily released ATP freely diffuses to a nearby ATP sensor and then disappeared in 8 s, adequately depicts the ATP secretion assay described above.
Note that the concentration profile of a substance, which completely localizes in a negligibly small volume at t = 0, is spherically symmetric, and the concentration of the substance in a given point of the space at an arbitrary moment is directly proportional to its quantity (Crank, 1985). By analogy with this diffusion problem, a single ATP-releasing channel, which opens only shortly, should produce an expanding axially symmetric ATP profile around the channel pore. The ATP concentration in a given point is directly proportional to the total quantity of released ATP and described by a universal function of time and space coordinates. As given by the additive sum of individual profiles, the diffusion profile of ATP released by an ensemble of N-identical ATP-permeable channels should be described by a universal analytical function multiplied by the total quantity of ATP released by an individual channel. The last is equal to the quantity of ATP released in total, QATP, divided by N. Thus, for a short enough stimulation of a taste cell, a transient ATP concentration in any point around the ATP sensor is directly proportional to QATP, and the substitution of [ATP] in Eq. A1 for QATP can provide a plausible link between ATP sensor response and released ATP:
 |
(A3) |
where is the quantity of released ATP required to elicit the half-response.
Abbreviations used in this paper: Cx, connexin; Px, pannexin; VG, voltage-gated; WC, whole cell.
References
- Bader, P., and R. Weingart. 2004. Conductive and kinetic properties of connexin45 hemichannels expressed in transfected HeLa cells. J. Membr. Biol. 199:143–154. [DOI] [PubMed] [Google Scholar]
- Bao, L., S. Locovei, and G. Dahl. 2004. Pannexin membrane channels are mechanosensitive conduits for ATP. FEBS Lett. 572:65–68. [DOI] [PubMed] [Google Scholar]
- Barbe, M.T., H. Monyer, and R. Bruzzone. 2006. Cell-cell communication beyond connexins: the pannexin channels. Physiology (Bethesda). 21:103–114. [DOI] [PubMed] [Google Scholar]
- Baryshnikov, S.G., O.A. Rogachevskaja, and S.S. Kolesnikov. 2003. Calcium signaling mediated by P2Y receptors in mouse taste cells. J. Neurophysiol. 90:3283–3294. [DOI] [PubMed] [Google Scholar]
- Braet, K., S. Aspeslagh, W. Vandamme, K. Willecke, P.E. Martin, W.H. Evans, and L. Leybaert. 2003. Pharmacological sensitivity of ATP release triggered by photoliberation of inositol-1,4,5-trisphosphate and zero extracellular calcium in brain endothelial cells. J. Cell. Physiol. 197:205–213. [DOI] [PubMed] [Google Scholar]
- Bruzzone, R., S.G. Hormuzdi, M.T. Barbe, A. Herb, and H. Monyer. 2003. Pannexins, a family of gap junction proteins expressed in brain. Proc. Natl. Acad. Sci. USA. 100:13644–13649. [DOI] [PMC free article] [PubMed] [Google Scholar]
- Bruzzone, R., M.T. Barbe, N.J. Jakob, and H. Monyer. 2005. Pharmacological properties of homomeric and heteromeric pannexin hemichannels expressed in Xenopus oocytes. J. Neurochem. 92:1033–1043. [DOI] [PubMed] [Google Scholar]
- Castro, C., J.M. Gomez-Hernandez, K. Silander, and L.C. Barrio. 1999. Altered formation of hemichannels and gap junction channels caused by C-terminal connexin-32 mutations. J. Neurosci. 19:3752–3760. [DOI] [PMC free article] [PubMed] [Google Scholar]
- Chandrashekar, J., M.A. Hoon, N.J. Ryba, and C.S. Zuker. 2006. The receptors and cells for mammalian taste. Nature. 444:288–294. [DOI] [PubMed] [Google Scholar]
- Chaytor, A.T., W.H. Evans, and T.M. Griffith. 1997. Peptides homologous to extracellular loop motifs of connexin 43 reversibly abolish rhythmic contractile activity in rabbit arteries. J. Physiol. 503:99–110. [DOI] [PMC free article] [PubMed] [Google Scholar]
- Chaytor, A.T., P.E.M. Martin, D.H. Edwards, and T.M. Griffith. 2001. Gap junctional communication underpins EDHF-type relaxations evoked by ACh in the rat hepatic artery. Am. J. Physiol. Heart Circ. Physiol. 280:H2441–H2450. [DOI] [PubMed] [Google Scholar]
- Clapp, T.R., K.F. Medler, S. Damak, R.F. Margolskee, and S.C. Kinnamon. 2006. Mouse taste cells with G protein-coupled taste receptors lack voltage-gated calcium channels and SNAP-25. BMC Biol. 4:7. [DOI] [PMC free article] [PubMed] [Google Scholar]
- Crank, J. 1985. The Mathematics of Diffusion. 1st ed. Oxford University Press, Oxford, UK. 432 pp.
- Dahl, G., and S. Locovei. 2006. Pannexin: to gap or not to gap, is that a question? IUBMB Life. 58:409–419. [DOI] [PubMed] [Google Scholar]
- De Vuyst, E., E. Decrock, L. Cabooter, G.R. Dubyak, C.C. Naus, W.H. Evans, and L. Leybaert. 2006. Intracellular calcium changes trigger connexin 32 hemichannel opening. EMBO J. 25:34–44. [DOI] [PMC free article] [PubMed] [Google Scholar]
- Essenfelder, G.M., R. Bruzzone, J. Lamartine, A. Charollais, C. Blanchet-Bardon, M.T. Barbe, P. Meda, and G. Waksman. 2004. Connexin30 mutations responsible for hidrotic ectodermal dysplasia cause abnormal hemichannel activity. Hum. Mol. Genet. 13:1703–1714. [DOI] [PubMed] [Google Scholar]
- Fields, R.D., and G. Burnstock. 2006. Purinergic signalling in neuron–glia interactions. Nat. Rev. Neurosci. 7:423–436. [DOI] [PMC free article] [PubMed] [Google Scholar]
- Finger, T.E., V. Danilova, J. Barrows, D.L. Bartel, A.J. Vigers, L. Stone, G. Hellekant, and S.C. Kinnamon. 2005. ATP signaling is crucial for communication from taste buds to gustatory nerves. Science. 310:1495–1499. [DOI] [PubMed] [Google Scholar]
- Goldman, D.E. 1943. Potential, impedance, and rectification in membranes. J. Gen. Physiol. 27:37–60. [DOI] [PMC free article] [PubMed] [Google Scholar]
- Gonzalez, D., J.M. Gomez-Hernandez, and L.C. Barrio. 2007. Molecular basis of voltage dependence of connexin channels: an integrative appraisal. Prog. Biophys. Mol. Biol. 94:66–106. [DOI] [PubMed] [Google Scholar]
- Goodenough, D.A., and D.L. Paul. 2003. Beyond the gap: functions of unpaired connexon channels. Nat. Rev. Mol. Cell Biol. 4:1–10. [DOI] [PubMed] [Google Scholar]
- Huang, Y.J., Y. Maruyama, G. Dvoryanchikov, E. Pereira, N. Chaudhari, and S.D. Roper. 2007. The role of pannexin 1 hemichannels in ATP release and cell-cell communication in mouse taste buds. Proc. Natl. Acad. Sci. USA. 104:6436–6441. [DOI] [PMC free article] [PubMed] [Google Scholar]
- Kang, J., N. Kang, D. Lovatt, A. Torres, Z. Zhao, J. Lin, and M. Nedergaard. 2008. Connexin 43 hemichannels are permeable to ATP. J. Neurosci. 28:4702–4711. [DOI] [PMC free article] [PubMed] [Google Scholar]
- Kolesnikov, S.S., and R.F. Margolskee. 1998. Extracellular K+ activates a K+- and H+-permeable conductance in frog taste cells. J. Physiol. 507:415–432. [DOI] [PMC free article] [PubMed] [Google Scholar]
- Lazarowski, E.R., R.C. Boucher, and T.K. Harden. 2003. Mechanisms of release of nucleotides and integration of their action as P2X- and P2Y-receptor activating molecules. Mol. Pharmacol. 64:785–795. [DOI] [PubMed] [Google Scholar]
- Leybaert, L., K. Braet, W. Vandamme, L. Cabooter, P.E.M. Martin, and W.H. Evans. 2003. Connexin channels, connexin mimetic peptides and ATP release. Cell Commun. Adhes. 10:251–257. [DOI] [PubMed] [Google Scholar]
- Locovei, S., L. Bao, and G. Dahl. 2006a. Pannexin 1 in erythrocytes: function without a gap. Proc. Natl. Acad. Sci. USA. 103:7655–7659. [DOI] [PMC free article] [PubMed] [Google Scholar]
- Locovei, S., J. Wang, and G. Dahl. 2006b. Activation of pannexin 1 channels by ATP through P2Y receptors and by cytoplasmic calcium. FEBS Lett. 580:239–244. [DOI] [PubMed] [Google Scholar]
- Martin, P.E., C. Wall, and T.M. Griffith. 2005. Effects of connexin-mimetic peptides on gap junction functionality and connexin expression in cultured vascular cells. Br. J. Pharmacol. 144:617–627. [DOI] [PMC free article] [PubMed] [Google Scholar]
- Mese, G., G. Richard, and T.W. White. 2007. Gap junctions: basic structure and function. J. Invest. Dermatol. 127:2516–2524. [DOI] [PubMed] [Google Scholar]
- Neher, E. 1995. The use of fura-2 for estimating Ca buffers and Ca fluxes. Neuropharmacology. 11:1423–1442. [DOI] [PubMed] [Google Scholar]
- Pelegrin, P., and A. Surprenant. 2006. Pannexin-1 mediates large pore formation and interleukin-1b release by the ATP-gated P2X7 receptor. EMBO J. 25:5071–5082. [DOI] [PMC free article] [PubMed] [Google Scholar]
- Pelegrin, P., and A. Surprenant. 2007. Pannexin-1 couples to maitotoxin- and nigericin-induced interleukin-1beta release through a dye uptake-independent pathway. J. Biol. Chem. 282:2386–2394. [DOI] [PubMed] [Google Scholar]
- Romanov, R.A., and S.S. Kolesnikov. 2006. Electrophysiologically identified subpopulations of taste bud cells. Neurosci. Lett. 395:249–254. [DOI] [PubMed] [Google Scholar]
- Romanov, R.A., O.A. Rogachevskaja, M.F. Bystrova, P. Jiang, R.F. Margolskee, and S.S. Kolesnikov. 2007. Afferent neurotransmission mediated by hemichannels in mammalian taste cells. EMBO J. 26:657–667. [DOI] [PMC free article] [PubMed] [Google Scholar]
- Roper, S.D. 2007. Signal transduction and information processing in mammalian taste buds. Pflugers Arch. 454:759–776. [DOI] [PMC free article] [PubMed] [Google Scholar]
- Schaper, K.A., N. Palacios-Prado, J.A. Orellana, and J.C. Saez. 2008. Currently used methods for identification and characterization of hemichannels. Cell Commun. Adhes. 15:207–218. [DOI] [PubMed] [Google Scholar]
- Schock, S.C., D. LeBlanc, A.M. Hakim, and C.S. Thompson. 2008. ATP release by way of connexin 36 hemichannels mediates ischemic tolerance in vitro. Biochem. Biophys. Res. Commun. 368:138–144. [DOI] [PubMed] [Google Scholar]
- Stout, C.E., J.L. Costantin, C.C. Naus, and A.C. Charles. 2002. Intercellular calcium signaling in astrocytes via ATP release through connexin hemichannels. J. Biol. Chem. 277:10482–10488. [DOI] [PubMed] [Google Scholar]
- Valiunas, V. 2002. Biophysical properties of connexin-45 gap junction hemichannels studied in vertebrate cells. J. Gen. Physiol. 119:147–164. [DOI] [PMC free article] [PubMed] [Google Scholar]
- Valiunas, V., and R. Weingart. 2000. Electrical properties of gap junction hemichannels identified in transfected HeLa cells. Pflugers Arch. 440:366–379. [DOI] [PubMed] [Google Scholar]
- Wang, J., M. Ma, S. Locovei, R.W. Keane, and G. Dahl. 2007. Modulation of membrane channel currents by gap junction protein mimetic peptides: size matters. Am. J. Physiol. Cell Physiol. 293:C1112–C1119. [DOI] [PubMed] [Google Scholar]
- Warner, A., D.K. Clements, S. Parikh, W.H. Evans, and R.L. DeHaan. 1995. Specific motifs in the external loops of connexin proteins can determine gap junction formation between chick heart myocytes. J. Physiol. 488:721–728. [DOI] [PMC free article] [PubMed] [Google Scholar]