

Abstract
Behavioural and functional imaging studies have demonstrated that lexical knowledge influences the categorization of perceptually ambiguous speech sounds. However, methodological and inferential constraints have so far been unable to resolve the question of whether this interaction takes the form of direct top-down influences on perceptual processing, or feedforward convergence during a decision process. We examined top-down lexical influences on the categorization of segments in a /s/−/∫/ continuum presented in different lexical contexts to produce a robust Ganong effect. Using integrated MEG/EEG and MRI data we found that, within a network identified by 40Hz gamma phase locking, activation in the supramarginal gyrus associated with wordform representation influences phonetic processing in the posterior superior temporal gyrus during a period of time associated with lexical processing. This result provides direct evidence that lexical processes influence lower level phonetic perception, and demonstrates the potential value of combining Granger causality analyses and high spatiotemporal resolution multimodal imaging data to explore the functional architecture of cognition.
Results from a variety of paradigms show that the categorization of perceptually ambiguous speech sounds is affected by the words they appear in (Ganong, 1980; Warren, 1970; Samuel and Pitt, 2003). In the Ganong effect, listeners tend to identify ambiguous speech sounds such that the sound and its context are interpreted as a word (Ganong, 1980). For example, a speech sound that is acoustically intermediate between [g] and [k] tends to be identified as a [g] in the context _ift, and as a [k] in the context of _iss. Ganong (1980) recognized this effect as evidence of interaction between lexical and phonetic processes and was notably agnostic about whether the interaction occurred at the level of perception or after perception during a phonological decision process.. Lexical effects on speech categorization have been argued to reflect a true top-down perceptual effect (Samuel and Pitt, 2003). However, the effects may also be explained as a post-perceptual effect within a purely feedforward model (Norris et al., 2000).
Using fMRI, Myers and Blumstein (2008) demonstrated that lexical influence on phonetic judgments is accompanied by an increase in activation in the superior temporal gyrus (STG) that is bilateral, but somewhat stronger in the left hemisphere. Several types of evidence suggest that the STG plays a significant role in acoustic-phonetic processing. Pure word deafness is associated with damage to this area (Poeppel, 2001). Moreover, a number of functional imaging studies have demonstrated that the STG is reliably activated bilaterally by speech stimuli, albeit with stronger activation associated with the left hemisphere (see reviews by Norris & Wise, 2000; Hickok & Poeppel, 2000).This might suggest that the Ganong effect is perceptual and, by implication, the result of top-down lexical influence.
The continued debate about the interpretation of the Ganong effect reflects the fact that the extant data are consistent with two different processing models (see Fig. 1). One possibility is that lexical knowledge provides top-down feedback that directly influences perceptual processes. If this is the case, increased STG activation may be the result of additional input from a brain areas associated with the representation of wordforms. Wordform areas include the supramarginal gyrus (SMG) and middle temporal areas (MTG), whose damage or intracranial electrical suppression may produce anomia (Sanai et al., 2008; Goodglass & Kaplan, 1983). The SMG is specifically implicated in wordform representation by evidence showing that spoken words from dense phonological neighbourhoods (i.e. words that differ from a large number of words by only a single segment) produce stronger SMG activation than words from sparse neighbourhoods (Prabhakaran et al., 2006). There is also evidence from a large number of studies (summarized in Raettig & Kotz, 2008) showing that the mPTG and SMG, as well as the angular gyrus (AG), show differential sensitivity to words versus pseudowords that is modulated by how closely stimuli resemble other words.
Figure 1.
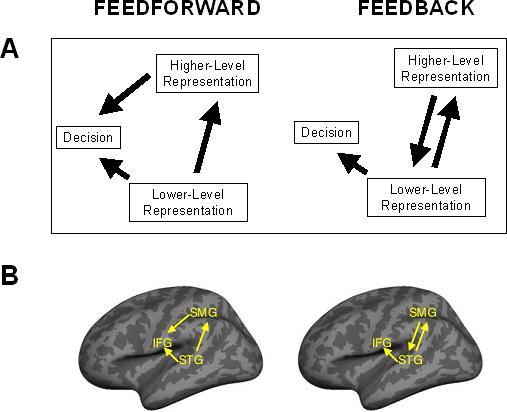
Alternate functional architectures describing feedforward post-perceptual versus top-down feedback integration of representations. (A) Two potential patterns of interaction between lower- and higher-level representations in cognitive processing. (B) Predicted patterns of interaction between phonetic (STG), lexical (SMG), and post-perceptual phonological working memory processes (IFG) in feedforward versus top-down feedback accounts of the Ganong effect shown schematically on an inflated cortical surface reconstruction.
Myer and Blumstein (2008) did not find increased activation in these areas associated with the Ganong effect. This is not surprising though because all stimuli were similar to one of two words, and so lexical activation most likely occurred in all conditions and thus would not show up in a subtraction between conditions. Even if it had been found, however, evidence of wordform activation per se would not discriminate between different models of lexical-acoustic interaction since all models depend on lexical activation.
Another possibility is that speech processing relies on feedforward functional architecture and lexical and phonetic outputs are combined at a post-perceptual stage that underlies the explicit perceptual judgments many experimental paradigms require (Dennett, 1992; Norris et al., 2000). Phonetic and lexical representations may be combined to make a decision about the categorization of a speech sound without having lexical knowledge directly alter speech perception. Evidence from a number of imaging studies suggests that the left inferior frontal gyrus (IFG), is a likely site for such a process (Zatorre et al., 1992; 1996; Burton et al., 2000). These studies show that the left IFG is recruited by phonological stimuli, but only in tasks that require overt phonological judgements about individual segments heard in context. One would expect to find that the IFG is activated during the Ganong task, but it might not produce differential levels of activation across phonetically similar conditions such as those compared by Myers and Blumstein (2008) because they involve quite similar judgments.Note also that both feedforward and feedback models make similar predictions about the strength of IFG activation.
Given the limitations of behavioural and BOLD imaging techniques, we adopted a novel approach to distinguish between feedforward and top-down feedback explanations of lexical influences on the categorization of ambiguous speech sounds. We collected MEG and EEG data simultaneously while participants categorized a series of speech sounds manipulated to create a continuum ranging between [s] and [∫] (“sh”) and spliced into the onsets of tokens of the words shampoo and sandal. Using Granger causality analysis (Granger, 1969) we were able to identify the pattern of causal interaction between different brain regions during the time period in which lexical information interacts with acoustic-phonetic processing to produce the Ganong effect. This allowed us to evaluate the competing predictions of the two processing models. The top-down feedback hypothesis predicted that activation in known wordform areas would influence activation in areas associated with phonetic processing. The feedforward account predicted a pattern in which wordform activation would not influence phonetic activation, but phonetic and wordform areas both would influence activation in areas associated with explicit phonological decision-making.
Methods
Subjects
Sixteen right-handed native speakers of American English with no discernable auditory processing deficits participated in the study. All subjects provided informed consent following an Institutional Review Board approved protocol. Of these 16, one subject was dropped due to an equipment problem and four failed to complete the protocol due to failure to meet screening criteria (1), unease in the MR scanner (1), or the inability to perform the task reliably (2). The remaining 11 subjects (four women) were between the ages of 18 and 41 (mean age: 26.7 years).
Stimuli
The auditory stimuli consisted of a five-step [s]-[∫] (sh) continuum embedded at the onset of the words sandal and shampoo. These were created from recordings of the two words being spoken in isolation by a native male speaker of American English. The spoken words were digitally recorded with 16-bit sound at a sampling rate of 44.1 kHz in a sound-attenuating chamber. Tokens of each word were selected based on intelligibility and similarity in duration. The initial fricatives were digitally excised and replaced with tokens from a single continuum created by weighted spectral averaging of tokens of [s] and [∫] spoken in isolation by the same speaker and matched in duration and overall amplitude envelope shape. The resulting words were 577.3 ms in length with fricatives lasting 120.0 ms. The two carrier words were segmentally divergent 219 ms after onset. All editing and digital manipulation of auditory stimuli including normalization of stimulus duration and amplitude characteristics was done using PRAAT (http://www.praat.org). Initially, nine tokens from the original continuum were created with equal step sizes defined by the proportional weighting of [s] and [∫]. To maximize statistical power in later analyses, we identified the token that produced the largest Ganong effect in behavioral piloting (which we termed the Ganongmax token) and simplified the continuum to include 5 steps: the original endpoints of the nine-step continuum ([s] and [∫]), the Ganongmax token, and the two that flank the Ganongmax token.
Behavioral task
Participants completed the behavioral task during the MEG/EEG collection. The task is summarized in Supplementary Figure 1. In each trial, the subject heard a single word and then indicated whether the initial segment was a [s] or [∫]. The auditory stimuli were delivered by tube earphones. A trial began with the 500 ms presentation of a small visual fixation cross projected on a screen, followed by the presentation of the auditory stimulus. Subjects were instructed to indicate their interpretation of the initial segment by pressing one of two buttons on a small button-box using their left hands. A “S” and a “SH” were presented visually on the left and right side of the fixation cross, respectively, 260 ms after the offset of the auditory stimulus to remind subjects which button corresponded to which response. This probe stimulus was displayed for 1153 ms and was immediately followed by a blank screen for a random period between 100 and 300 ms, before the fixation stimulus for the next trial appeared. Stimulus timing and presentation was controlled using Presentation software (Neurobehavioral Systems, Albany, CA, USA). An unbalanced design was used to maximize power in the three critical conditions, while providing the range of stimuli needed to produce a robust Ganong effect. Subjects were presented 288 tokens of each of the three main experimental conditions, unambiguous word (sandal or shampoo), unambiguous nonword (shandal or sampoo), and maximally ambiguous fricative (Ganongmax), and 192 tokens of each of the items from the continuum that flanked Ganongmax. The experiment was broken down into four blocks with three short rest breaks within each block.
MEG and EEG acquisition
Magnetoencephalography (MEG) and electroencephalography (EEG) data were acquired simultaneously during behavioral testing in a single testing session in a magnetically shielded room (Imedco, Hägendorf, Switzerland). MEG data were collected using a 306-channel whole head Vectorview system (Elekta Neuromag, Helsinki, Finland) with 204 planar gradiometers and 102 magnetometers. EEG was recorded using a 70-electrode cap with a nose reference as well as vertical and horizontal electro-oculograms (EOG). Both MEG and EEG data were recorded at a sampling rate of 601 Hz after filtering between 0.1 and 200 Hz, and subsequently resampled to 1000 Hz. Trials were rejected based on eye movement or blink artifacts detected by EOG (EOG > 150 μV), or high magnetometer (> 10,000 fT) or gradiometer (> 1,000 fT/cm) values. The positions of all scalp electrodes, anatomical landmarks including the nasion and two auricular landmarks, and four head-position indicator coils were measured using a FastTrack 3D digitizer (Polhemus, Colchester, VT). During testing, the head position within the MEG sensor array was measured at the beginning of each of the four blocks and at the end of the testing session. Two to five minute empty room MEG recordings were also made immediately prior to or following the test sessions for the purpose of estimating the noise covariance matrix.
Anatomical MRI
3D T1-weighted structural magnetic resonance images (head-only) were acquired in a second testing session with a 1.5 T Avanto 32 channel “TIM” system using an MPRAGE sequence (TR = 2730 ms, T1 = 1000 ms, TE = 3.31 ms, flip angle = 7°, FOV = 256 mm, slice thickness =1.3 mm, voxel size 1.3 × 1.0 × 1.3 mm3).
From the MRI data, a representation of the cerebral cortex was constructed using the Freesurfer program (Dale et al., 1999; Segonne et al., 2004; Fischl et al., 1999a; Fischl et al., 2001). White matter segmentation was used to create a tessellated topographical representation of the cortical surface with approximately 300,000 vertices. For across-subject analyses, the cortical surface representations of individual subjects were aligned using a spherical morphing technique (Fischl et al., 1999b). To visualize activation data within sulci, the cortical surface representations were inflated (Fischl et al., 1999a). For the Boundary Element Model (BEM) used in the MEG/EEG forward calculations, the outer surface of the scalp as well as the outer and inner surfaces of the skull were identified in the anatomical MRI.
MEG source analysis
The overall processing stream we used to integrate and analyze imaging data is summarized in Figure 2. MEG and EEG data were rejected for 13% of all trials due to EOG, gradiometer or magnetometer values that exceeded our inclusion criteria. This minimized the potential influence of eye movement/blink or MEG recording transient artifacts on recorded EEG and MEG data. Anatomically-constrained activation movies were created by combining MRI, MEG, and EEG data. This constrained multimodal imaging approach can provide better source localization than MEG or EEG does independently (Liu et al., 2002). We used anatomically constrained distributed minimum-norm estimates to determine the strength of source currents distributed over the cortical surfaces based on MEG and EEG signals recorded outside the head (Dale and Sereno, 1993). The surface representation was decimated by a factor of 25 to yield a representation of approximately 12,000 vertices that were used as the locations of the dipoles.
Figure 2.
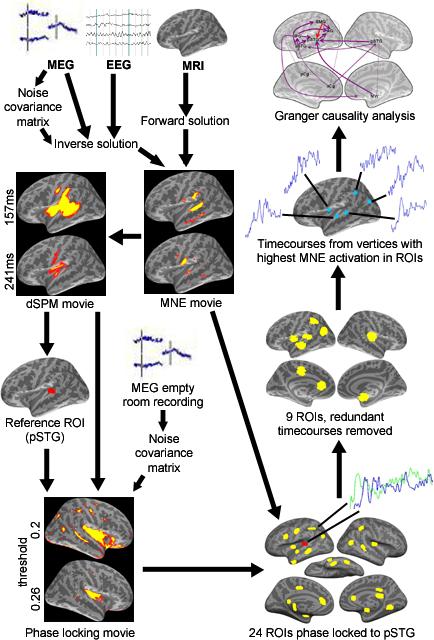
Overview of the processing stream used to to create multimodal activation movies, identify ROIs based on gamma phase locking, and perform Granger causation analyses.
The forward model, which describes the MEG and EEG signal pattern generated by a unit dipole at each allowed location (on the cortical surface), was calculated using a three-layer BEM model (Hämäläinen and Sarvas, 1989; Oostendorp and van Oosterom, 1989). The anatomical MRI was aligned with the MEG/EEG coordinate system using fiducial landmarks and head surface points that were digitized during the MEG/EEG acquisition session.
For our analyses, we used the minimum-norm estimate (MNE) and the noise-normalized MNE called dynamic statistical parametric map (dSPM) (Dale et al., 2000) to estimate the timecourses of activation across the cerebral cortex. MNE is an estimate of the actual activation timecourses whereas the dSPM provides a statistical measure that corresponds to the signal-to-noise ratio of the current estimate at each location, indicating regions where the estimated activity exceeds the estimated noise level. Therefore, dSPMs were used for identifying ROIs, but for statistical analysis of data within and across ROIs, the MNE values were used (Ciesielski et al., 2005; Wehner et al. 2007). We employed depth weighting to correct for MNE's bias towards attributing signals to superficial sources (Lin et al., 2006). Sensitivity to neural sources was improved by calculating a noise covariance matrix based on each subject's raw MEG data as described in Lin et al., (2004). The activations at each location of the cortical surface were estimated over 1 ms windows, resulting in spatiotemporal brain activation movies.
ROI Identification by Phase Analysis
Temporal coherence in the form of 40 Hz gamma phase synchrony has been proposed as a mechanism for binding neural populations into transient cell assemblies (Tallon-Baudry and Bertrand, 1999; Joliet et al., 1994; Tallon-Baudry et al., 1997; Lachaux et al., 1999). We therefore identified the set of ROIs that could potentially constitute the neural assembly that produces the Ganong effect based on evidence of phase synchrony in the 40 Hz gamma band signal. The reference region was an ROI defined by the first area of increased cortical activity after stimulus presentation. This region, consisting primarily of the left pSTG, showed a clear pattern of activation that began 100 ms after stimulus onset and persisted throughout the rest of the recording epoch. Note that the timing and broad localization of this activation is consistent with the mismatch negativity (MMN and mMMN), an evoked potential that is sensitive to manipulations of language-specific phonetic properties (see review by Näätänen, 2001). This localization is also consistent with the region that Myers and Blumstein (2008) found showed increased BOLD response in the Ganong effect. The exact boundaries of the region were defined based on early phonetic activation in the left posterior superior temporal gyrus (pSTG) shown 100 ms after the onset of the auditory stimulus in the across-subject averaged dSPM measures of cortical activity and then morphed to individual subjects’ cortical surfaces for the analyses.
The time period for this analysis was the interval between 280 and 480 ms after the onset of the speech stimulus. This period was chosen based on two considerations. First, analyses of left pSTG reference ROI (described below and in Fig. 5) show that words and nonwords produce divergent activation beginning at 280 ms and extendeing for the rest of the recording epoch. Left pSTG sensitivity to lexical factors identifies this interval as the most likely period for observing neural correlates of the Ganong effect that involve the pSTG. The second, closely related consideration is that it was important to select a time period when the system is engaged in early lexical processing. Electrophysiological data suggests that listeners show the earliest sensitivity to lexical properties during this period. The M350, which typically peaks between 300 and 450 ms is the earliest evoked component that is sensitive to lexical properties including word frequency, repetition, and close probability (Segikugi, Koyama & Kakigi, 2000; Pylkkänen et al., 2000; Embick et al., 2001; Helenius et al., 1998). The N400 peaks slightly later, although still within this interval, is elicited by words and wordlike stimuli, and is also modulated by a broad set of lexical properties that also influence reaction times in lexical decision tasks (c.f. Kutas & Hillyard, 1980; Bentin, McCarthy & Wood, 1986; Holcomb & Neville, 1990; O'Rourke & Holcomb, 2002).
Figure 5.
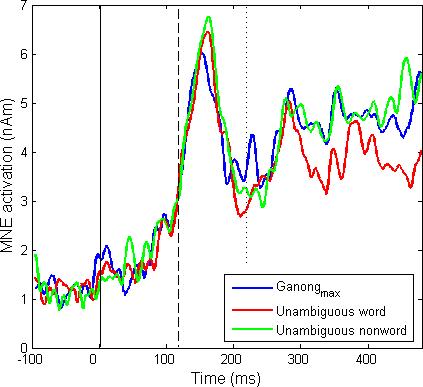
Estimated neural activation in the left pSTG. Across-subject averages of MNE activation values derived from MEG and EEG data are shown as a function of latency. The initial fricative ([s]-[∫]) began at 0 ms (continuous vertical line) and ended at 120 ms (dashed line). Lexical contexts were discriminable at 220 ms (dotted line). Brackets indicate the two intervals in which activation was greater in the Ganongmax than in the unambiguous word condition.
Phase analyses were conducted using a spectral dynamic statistical parametric mapping technique (sdSPM), which provides a millisecond resolution continuous mapping of cortical oscillations over the entire cortical surface (Lin et al., 2004). Estimates of cortical activity on individual trials were based on MNE measures constrained by our anatomical MRI data (Dale and Sereno, 1993, Dale et al., 2000). We used continuous Morlet wavelet convolution to optimize the temporal window for spectral decomposition and remove amplitude information to create a pure measure of phase from MEG sensor data (Tallon-Baudry et al., 1997). Before computing the MNE, the MEG signals from each sensor channel were convolved with the function (Lin et al., 2004):
with center frequency f equaling 40 Hz and variance σ2 set to 7/2πf. The phase locking values (Lachaux et al., 1999) over m trials were calculated as:
where n is a discrete time index, Ωi(t) is the frequency-specific source timecourse in brain space for the ith trial at time t, ΩR(t) is the reference timecourse, and H denotes the transpose complex conjugate. Ten reference timecourses were used, chosen from 10 random points within the reference ROI. All phase locking measures were calculated to each of these reference timecourses and then averaged. Phase locking measures from individual subjects were averaged and visualized on an averaged cortical surface (Fischl et al., 1999b).
Phase locking values from all Ganongmax, unambiguous word, and unambiguous nonword trials were averaged in order to encompass all neural regions that may be utilized in the processing associated with different conditions. In order to assure that all potential ROIs were found, we used an annealing method in which we viewed phase locking values across the cortical surface at a very low threshold (0.1) and raised the threshold by 0.01 increments. Note that phase locking values range from 0 (no phase locking) to 1 (completely phase locked) and have no unit (Lachaux et al., 1999). At the lowest threshold, all surfaces show phase locking to the reference area, but by systematically raising the criterion and looking for individual islands of at least 1cm in diameter of above-threshold phase locking at which the ROI had a PLV at least 0.02 greater than the surrounding area on all sides, we identified 24 distinct ROIs across the lateral and medial surfaces of both hemispheres that showed increased phase-locking to the reference region during the critical time window. Significance testing was not used in this procedure because we wanted to avoid the rejection of potentially causal areas in subsequent Granger analyses.
Granger causality analysis
We employed Granger causality analysis to identify patterns of causal interaction between ROIs. Granger causality analysis is a statistical jack knife technique in which lagged vector autoregression models are used to determine the unique ability of one time-varying signal to predict the future behavior of another, given full knowledge of all potentially causal variable signals in a system (Granger, 1969). Operationally, one signal is said to Granger-cause another if the error term is significantly larger when the first signal is not included in the model.
The Granger causality analysis was performed using MNE activation timecourses, as opposed the dSPM measures in the phase locking analysis for ROI identification, as MNE provides an estimate of the physical source strength instead of a statistical measure. To remedy a potential bias in the estimated location of activity, we created our 25 ROIs (the reference region and the 24 identified with the phase locking analysis) to be large enough to encompass both the sulcus and gyrus surrounding the relevant island with locally high phase locking values, but small enough to have similar MNE activation timecourses throughout the region. Then we chose dipole element with the greatest average MNE activation within each ROI. We used this individual dipole measure instead of a measure of overall ROI activation to avoid potential smoothing due to averaging that might undermine our causal analysis. Note however, that our algorithm for ROI selection (see below) ensured that activation patterns showed uniform temporal patterns of activation maxima and minima across the ROI, and so these measures were representative of overall ROI activation as reconstructed by MNE. The local uniformity of activation patterns is general property of MNE inverse solutions (Hämäläinen & Ilmoniemi, 1994; Liu et al., 2002).
Our ROI construction techniques were designed to create ROIs that met the two conceptual criteria that allow Granger analysis to discriminate between causation and correlation: all potentially causal variables were included, and there were no redundant signals (Seth, 2005). Our annealing ROI identification technique based on physiological evidence of possible interaction (i.e. phase locking) during processing ensures that all potentially causal variables were initially identified, a lack of a statistical threshold guarantees that they were all retained.
To avoid redundant signals that may mask Granger causality, we compared the timing of local maxima and minima of MNE activation timecourses between the chosen dipoles which were anatomically adjacent, and when duplication was found, the dipole with the timecourse with the lower average activation was discarded. With this method, we identified the nine distinct ROIs that were used in our Granger analyses (see Fig. 3 and Table 1).
Figure 3.
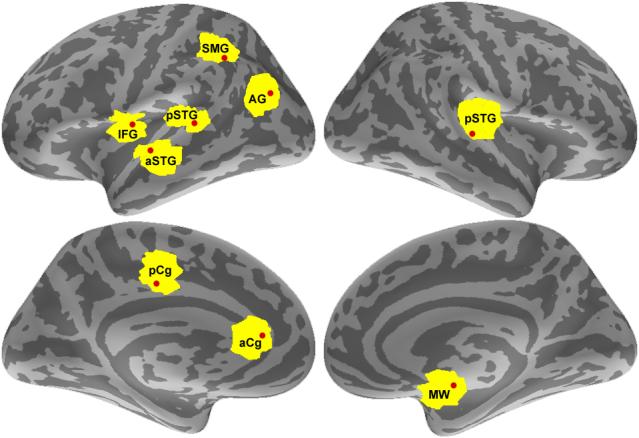
The nine regions of interest used in the Granger analysis. The large ROIs identified from the phase locking analysis are depicted in yellow. The approximate location of the vertex within each ROI with the highest average MNE activation during the period of interest used in the Granger analysis is shown as a red dot.
Table 1.
The anatomical locations and Talaraich coordinates of vertices within the nine ROIs whose timecourses were used in the Granger analysis. Also included for each vertex are the phase locking values to the reference area during the 280−480 ms after the onset of the speech stimuli as well as baseline PLVs (−200 to 0 ms prestimulus) for both the original reference area (left pSTG) and for an unrelated ROI on the right, precentral gyrus, approximately centered at Talaraich coordinate (8.57, 21.28, 38.68).
| # | Location | Talaraich coordinates | Phase locking values | Baseline PLV, left pSTG reference | Baseline PLV, right precentral reference | |
|---|---|---|---|---|---|---|
| 1 | pSTG | Left posterior superior temporal gyrus | (−66, −30, 10) | 0.69 | 0.37 | < 0.01 |
| 2 | pSTG | Right superior temporal gyrus | (67, −16, 3) | 0.15 | 0.07 | 0.04 |
| 3 | MW | Right medial wall of temporal lobe | (8, −15, −17) | 0.24 | 0.24 | 0.05 |
| 4 | SMG | Left supermarginal gyrus | (−49, −51, 47) | 0.24 | 0.24 | 0.07 |
| 5 | AG | Left angular gyrus | (−40, −73, 32) | 0.22 | 0.11 | < 0.01 |
| 6 | aSTG | Left anterior superior temporal gyrus | (−59, −15, 3) | 0.38 | 0.21 | 0.07 |
| 7 | IFG | Left inferior frontal gyrus | (−56, −3, 8) | 0.33 | 0.13 | 0.04 |
| 8 | aCg | Left anterior cingulate gyrus | (−6, 38, 6) | 0.23 | 0.11 | 0.06 |
| 9 | pCg | Left posterior cingulate gyrus | (−6, −22, 40) | 0.29 | 0.13 | 0.07 |
The statistical implementation of Granger causation makes the additional assumption that timecourses are covariance stationary, i.e., the probability distribution of each series must remain constant over time. To establish this, we used the Dickey-Fuller test (P < 0.01) to test for unit roots. In cases where these existed, we generated covariance stationarity using a backwards-differencing function applied to all timeseries (Seth, 2005). If a unit root still existed, the series was differenced again until stationarity was obtained.
The traditional method of selecting the number of lags in the regression in order to avoid overfitting while still captured the casual connections is to chose the model order with the best (i.e. smallest) Akaike (Akaike, 1974) or Bayesian (Schwartz, 1978) information criteria or a similar goodness of fit measure (Brovelli et al., 2004; Supp et al., 2007; Hesse et al., 2003). However, in our analysis, these measures consistently decreased as the model order increased. Directly using the Causal Connectivity Analysis toolbox (Seth, 2005) in Matlab, we compared the results of Granger analyses performed with model order of 2 to 20. All produced similar causal connections, so we chose a model order of 10 (corresponding to a 10 ms time lag in our case), which captured the main features of the network without overfitting.
In order to determine if one timecourse (X2) Granger-causes another (X1), we performed lagged multivariate vector autoregressions on the MNE activation timecourses from both regions and all other possibly causal areas (X3, X4, ...., Xn), and then on all timecourses except X2 using the following model where t is the time index, m is the model order, and B contains the coefficients for the model:
If the error coefficient for the regression performed with X2, Erestricted(t), is significantly smaller than Eunrestricted(t), timecourse X2 is said to Granger-cause X1 since it significantly adds to the predictability of that timecourse. As we have included all possible involved timecourses, if the relationship between X1 and X2 was simply one of correlation in which a third timecourse, X3, caused both, X2 could not contribute any useful information not already present from X3. F-tests measured significance to P < 0.05, P < 0.01, and P < 0.001 and were Bonferroni-corrected for multiple comparisons.
Results
Behavioral Results
Behavioral results showed a strong effect of lexical context, with listeners more likely (P < 0.001, F-test) to categorize sounds as “sh” in the context of shampoo than in sandal (Figure 4). The middle step in the continuum was used in the analysis of the brain activity (the Ganongmax condition). The endpoints of the continuum correspond to phonetically unambiguous words (shampoo and sandal) and nonwords (sampoo and shandal).
Figure 4.
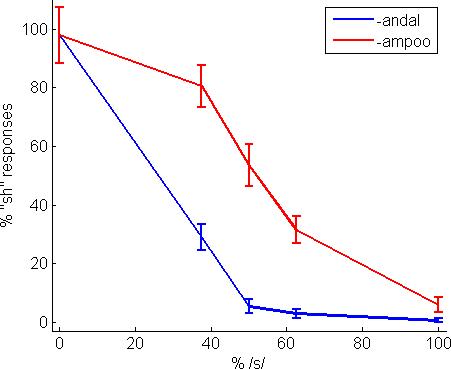
Phonetic categorization results from the behavioral task. Percentage of “sh” responses (mean and standard error) across an [s] to [∫] continuum in a two alternative forced choice task. The subjects were more likely to categorize an ambiguous segment in such a way that it created a word rather than a nonword (Ganong effect).
Left pSTG Activation
We focused our initial neural analyses on the left pSTG because it was the only area that showed increased activation during the period when evoked components sensitive to phonetic stimulus properties are found. This region is further implicated in phonetic processing by evidence from pathology (c.f.Poeppel, 2001). It is also of interest given Myers and Blumstein's finding (2008) that it shows increased activation in speech categorization conditions that produce the Ganong effect. We predicted that top-down lexical influences would lead to increased pSTG activation after the carrier words became identifiable. Indeed, we found higher left pSTG activation (P < 0.001) in the Ganongmax condition than in the phonetically unambiguous word condition at two time periods: from 160−220 ms and after 280 ms (Fig. 5). The location and latency of the first activation starting at 160 ms in pSTG is consistent with an origin in phonetic, not lexical factors (Näätänen, 2001).
The second period of increased left pSTG activation began 280 ms after the onset of the word and persisted beyond 500 ms. During this period Ganongmax tokens produced more pSTG activation than word tokens (P < 0.001, Wilcoxon ranked test based on the 280−480 ms interval). Unambiguous nonwords followed the same pattern beginning at 280 ms, showing more increased pSTG activation relative to words (P < 0.001, Wilcoxon ranked test based on the 280−480 ms interval). The divergent activation produced by words versus nonwords clearly identifies this interval as a period in which lexicality influences pSTG activation, marking it as a likely period for identifying potential lexical influences on speech perception mediated by the pSTG.. This time frame is also consistent with electrophysiological components that are modulated by lexical properties (cf. Pylkkänen et al., 2002). Moreover, this activation begins 160 ms after the offset of the ambiguous segment and 60 ms after the carrier items shampoo and sandal become acoustically discriminable. This timing argues that the later period of increased pSTG activation for the Ganongmax condition occurs only when lexicality influences pSTG activation, and thus raises the possibility that lexical activation causes the increased pSTG activation.
Granger Causality Analysis
We performed Granger causation analyses to examine whether activation of word-level representations influenced pSTG activation during this period. Analyses were conducted over three time periods. The first period, 80−280 ms, captures early interactions prior to the first evidence of lexical influence on pSTG activation. The second period, 280−480 ms, covers the first 200 msec of this period of differential pSTG activation by words versus nonwords. We hypothesize that this is the most likely period to observe neural correlates of a Ganong effect for a spoken item with a word initial phonetic ambiguity.The third interval, 480−750 ms, is intended to address the period in which listeners formulate an explicit phonetic decision for the behavioural task. Given the rich and complex pattern of causal interactions observed across experimental conditions and timeframes (see Supplementary Fig. 2), we will limit our discussion of the results of the Granger analyses to several critical observations that bear directly on the question of lexical feedback as described in the two models shown in Fig. 1. Note that while we will focus on specific associations between pairs of ROIs activation, in many cases a target area is influenced by several ROIs.
The key analyses for discriminating between feedforward and top-down explanations of the Ganong effect are those that examine the 280−480 ms interval when left pSTG activation was greater in the Ganongmax condition than in the word condition. Our analysis of this period focuses on the ROIs that influence left pSTG activation because the left pSTG appears to be the focus of early phonetic processing in these data. In the Ganongmax condition there was clear evidence of top-down lexical influence on phonetic processing in the form of left SMG Granger causation influence on left pSTG activation (Fig. 6). The left IFG also influenced pSTG activation during this period, as did the right pSTG and medial wall region. While the functional significance of medial wall involvement is unclear, left IFG influence on pSTG activation suggests that task demands associated with the phoneme categorization judgment influence perceptual processing. Thus there appear to be two independent forms of top-down interaction in driving perceptual superior temporal processing in the Ganongmax ondition.
Figure 6.
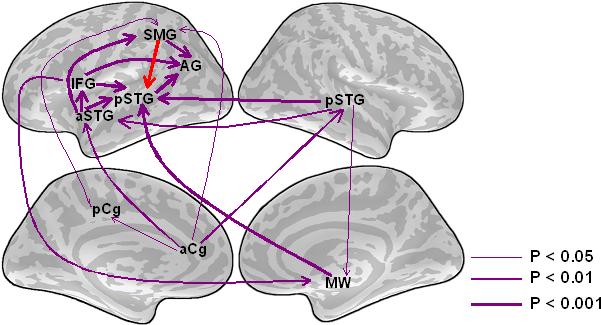
Granger causation patterns for the Ganongmax condition during the 280−480 ms latency range. Arrows indicate the direction of all statistically significant instances of Granger causality. The thickness of the arrows indicates the statistical significance of Granger causality (Bonferroni-corrected, F-test) within each condition and time range. Red arrows indicate causal relations that suggest the direct influence of wordform representations on phonetic processing.
Analysis of the earliest interval, between 80 and 280 ms post stimulus onset, shows a general pattern across conditions in which pSTG activation Granger causes emerging activation in parietal regions associated with phonological representation including wordform representation (Suppl. Fig. 2). In the Ganongmax condition the left pSTG influences the angular gyrus (AG) which in turn influences the SMG. This pattern may reflect hierarchical phonological representation in the AG and SMG. BOLD imaging studies have shown that that the AG is sensitive to abstract phoneme category boundaries (Blumstein et al., 2005), but not to manipulations of lexical neighborhood frequency (Prabhakaran et al., 2006), which suggests that it plays a role in sublexical phonological representation, in contrast to the SMG which appears to play a role in abstract wordform representation. Left pSTG activation also influences activation in the left IFG and right pSTG. In the unambiguous word condition left pSTG activation influences activation in the right pSTG. The right pSTG in turn influences activation in the left AG and SMG. In the unambiguous nonword condition the right pSTG influences activation in the left anterior and posterior STG, and shows reciprocal interaction with the left SMG (possibly related to partial matches with wordform representation). The overall trend of bilateral superior temporal activation influencing activation in frontal and parietal language areas in consistent with early bottom-up processing.
The third analysis window, between 480 and 750 ms post stimulus onset, was chosen to examine the relationship between lexical and phonetic processing, and the ultimate decision that listeners make about whether they heard a /s/ or /∫/. This interval follows the period associated with the M350 and immediately precedes the behavioural response. Our analysis during this period focuses on the forces that influence activation in the left IFG, because the IFG is selectively activated in tasks with phonetic stimuli when an explicit segment categorization is required (Burton et al., 2000; Zatorre et al., 1996). During this period, AG activation associated with some level of phonological representation (Blumstein et al., 2005) drives IFG activation when speech segments are perceptually unambiguous (in the word and nonword conditions), while the left pSTG, and aSTG and the right medial wall drive IFG activation in the segmentally ambiguous Ganongmax condition (Suppl. Fig. 2). This is consistent with the notion that the judgment is made on the basis of phonetic representation when there is stimulus ambiguity, but on the basis of phonological representation when there is not.
Discussion
The Granger analysis of the MEG/EEG source estimates indicated that left SMG influenced left pSTG in the Ganongmax condition during the 280−480 latency window. This finding supports a top-down (feedback) perceptual level model for the interaction of lexical and speech sound processing. Below we will first consider the benefits and limitations of the Granger causality analysis of MEG and EEG data, and then discuss the interpretation of the present findings in terms of the top-down vs. feedback models for the interaction of lexical and phonetic processing.
Granger causality analysis of MEG and EEG data
The goal of cognitive neuroscience is to develop a causal or mechanistic account of cognition, but in practice, its standard tools are primarily correlational methods. Given correlation between activation in two areas, A and B, it is possible that A drives B, B drives A, or both A and B are driven by a third factor. Subtraction analyses of hemodynamic data (e.g. fMRI or PET) allows correlating cognitive task demands with localized changes in brain activation (Petersen et al., 1988). However, it does not support strong inferences about cause and effect, which can only be recognized based on how activations unfold over time. Causes precede and uniquely predict effects, but hemodynamic measures offer a temporal resolution (Hernandez et al., 2002) that is at least an order of magnitude too low to capture activation relationships that unfold over milliseconds. Causal analysis of fMRI data relying on rapid event-related scanning techniques (Roebroek et al., 2005) provides high spatial resolution measures of activity over the entire brain; however, the relatively poor temporal resolution may limit the sensitivity of causal analyses relative to those based on electrophysiological data.
Previous work has demonstrated the applicability of Granger causality analyses to high temporal resolution measures of neural activity (Bernasconi and König, 1999; Liang et al., 2001; Kamínski et al., 2001; Hesse et al., 2003; Brovelli et al., 2004; Seth, 2005; Roebroek et al., 2005; Supp et al., 2007). However, practical constraints associated with the data collection and interpretation have limited the application of Granger analysis to neurophysiological data. Intracranial recordings offer precise localization of activity but limited cortical coverage and are normally not applicable for non-pathological human subject populations (Pessoa, et al., 1998; Bernasconi and König, 1999; Liang et al., 2001; Kamínski et al., 2001; Brovelli et al., 2004). Limited cortical coverage is a concern, as Granger analysis ideally assumes that all potentially causal signals are considered. When some causal signals are not included, spurious correlations reflecting indirect or coupled causation may be misinterpreted as direct causation in Granger analyses. Past research with Granger causality analysis of human electrophysiology data has mainly relied on sensor space representations of activity (Kamínski et al., 2001; Hesse et al., 2003; Seth, 2005) that offer wide coverage of the brain but limited insight into the relationships between specific brain structures.
In MEG and EEG source estimation, the extracranially recorded data are transformed into the “source space”, making it possible to perform Granger analyses on the waveforms of activity within different regions in the brain (Supp et al., 2007). In the current work, we introduced the use of anatomically constrained simultaneous integrated MEG and EEG imaging in Granger analysis. This strategy provides noninvasively a good spatiotemporal resolution for imaging activity over the cortical surfaces (Dale and Sereno, 1993; Dale et al., 2000), improving the quality of Granger analysis and facilitating the functional interpretation of Granger results. Given its noninvasive nature, this approach also made it possible test more subjects than is typically feasible with intracranial recording techniques, which generally focus on one or two animal subjects (c.f. Bernasconi et al., 1999; Brovelli et al., 2004). Hesse et al. (2003), who used ten subjects in their Granger analysis, note that the use of a group design improves model-fitting and thus improves Granger analysis.
Functional Brain Architecture in Speech Processing
The findings that an increase occurred in left pSTG phonetic activity during a period associated with lexical processes and that that increase was Granger-caused by activity in a wordform area are consistent with the top-down feedback model. It is unclear how these results could be reconciled with a purely feedfoward model. One possibility is that both primary acoustic-phonetic processing and post-perceptual phonetic decision processes are localized in the same portion of the pSTG. We believe that the IFG is a more likely candidate for phonetic decision processes. In experiments that manipulate phonetic variables, IFG activation tends to be limited to tasks that require explicit segmentation and phonetic decisions (Burton et al., 2000; Zatorre et al., 1996). This is consistent with the view that explicit phonetic decisions are task-dependent, and do not play an obligatory role in normal speech perception. Furthermore, the IFG shows greater sensitivity to phonetic ambiguity than the STG in explicit phonetic categorization tasks (Blumstein et al., 2005). Our results showed that late (480−750 ms) IFG activation was driven by the AG in the two unambiguous speech conditions, and by the left pSTG in the Ganongmax condition. These results suggest that the phonetic categorization decision was primarily influenced by higher order phonological representations in the unambiguous cases, and by phonetic representations in the phonetically unambiguous case.
Such direct evidence for top-down lexical influences has wide-ranging implications for speech perception. Evidence from control theory and a variety of simulation results (cf. McClelland and Elman, 1986; Grossberg, 2003) suggest that feedback mechanisms may provide parsimonious, computationally-explicit explanations for important characteristics of the perception of speech sounds and words. Recent evidence also suggests that top-down influences on speech perception may play a role in processes ranging from rate normalization to perceptual learning in the perception of distorted speech (Grossberg, 2003; Davis et al., 2005). Many of these proposals are primarily computationally motivated. The current work strengthens their empirical support and suggests new experimental and analytical approaches that may be used to directly test these proposals. More broadly, the results reported here demonstrate that Granger causality analysis of high-spatiotemporal resolution multi-modal imaging applications can provide a practical tool for interpreting non-invasive human functional imaging results and developing empirically grounded accounts of the processing interactions that underlie human cognition.
Conclusions
This result provides direct evidence that lexical processes influence lower level phonetic perception, and demonstrates the potential value of combining Granger causality analyses and high spatiotemporal resolution multimodal imaging data to explore the functional architecture of cognition.
Supplementary Material
Acknowledgements
This work was supported by NIDCD grant R013108 and also benefited from funding from the MIND Institute and NCRR grants P41RR14075 and R21EB007298 which support the development of technology and analysis tools at the Athinoula A. Martinos Center for Biomedical Imaging. We thank Eric Halgren, Matti Hämäläinen, Deirdre von Pechman, and Christina Congleton for their assistance in implementing the experiment and Gina Kuperberg, Steven Stufflebeam, Catherine Stoodley, David Cohen and David Caplan for their comments on earlier versions of the manuscript.
Footnotes
Publisher's Disclaimer: This is a PDF file of an unedited manuscript that has been accepted for publication. As a service to our customers we are providing this early version of the manuscript. The manuscript will undergo copyediting, typesetting, and review of the resulting proof before it is published in its final citable form. Please note that during the production process errors may be discovered which could affect the content, and all legal disclaimers that apply to the journal pertain.
References
- Akaike H. A new look at the statistical model identification. IEEE Trans Autom Cont. 1974;19:716–723. [Google Scholar]
- Bernasconi C, König P. On the directionality of cortical interactions studied by structural analysis of electrophysiological recordings. Biol. Cybern. 1999;81:1999–210. doi: 10.1007/s004220050556. [DOI] [PubMed] [Google Scholar]
- Binder JR, Frost JA, Hammeke TA, Bellgowan PSF, Sprinter JA, Kaufman JN, Possing ET. Human temporal lobe activation by speech and nonspeech sounds. Cereb Cortex. 2000;10:512–528. doi: 10.1093/cercor/10.5.512. [DOI] [PubMed] [Google Scholar]
- Blumstein SE, Myers EB, Rissman J. The perception of voice onset time: An fMRI investigation of phonetic category structure. J Cogn Neurosci. 2005;17:1353–1366. doi: 10.1162/0898929054985473. [DOI] [PubMed] [Google Scholar]
- Brovelli A, Ding M, Ledberg A, Chen Y, Nakamura R, Bressler SL. Beta oscillations in a large-scale sensorimotor cortical network: Directionality influences revealed by Granger causality. Proc Natl Acad Sci USA. 2004;101:9849–9854. doi: 10.1073/pnas.0308538101. [DOI] [PMC free article] [PubMed] [Google Scholar]
- Burton MW, Small SL, Blumstein SE. The role of segmentation in phonological processing: An fMRI investigation. J Cogn Neurosci. 2000;12:679–709. doi: 10.1162/089892900562309. [DOI] [PubMed] [Google Scholar]
- Ciesielski KT, Hämäläinen M, Lesnik PG, Geller DA,, Ahlfors SP. Increased MEG activation in OCD reflects a compensatory mechanism specific to the phase of a visual working memory task. NeuroImage. 2005;24:1180–1191. doi: 10.1016/j.neuroimage.2004.10.018. [DOI] [PubMed] [Google Scholar]
- Dale AM, Liu AK, Fischl B, Buckner RL, Belliveau J, Lewine J, Halgren E. Dynamic statistical parametric mapping: Combining fMRI and MEG for high-resolution imaging of cortical activity. Neuron. 2000;26:55–67. doi: 10.1016/s0896-6273(00)81138-1. [DOI] [PubMed] [Google Scholar]
- Dale AM, Fischl B, Sereno MI. Cortical surface-based analysis I: Segmentation and surface reconstruction. NeuroImage. 1999;9:179–194. doi: 10.1006/nimg.1998.0395. [DOI] [PubMed] [Google Scholar]
- Dale AM, Sereno MI. Improved localization of cortical activity by combining EEG and MEG with MRI cortical surface reconstruction: A linear approach. J Cogn Neurosci. 1993;5:162–176. doi: 10.1162/jocn.1993.5.2.162. [DOI] [PubMed] [Google Scholar]
- Damasio H. The nature of aphasia: signs and syndromes. In: Sarno M, editor. Acquired aphasia. Academic Press; San Diego: 1991. p. 4571. [Google Scholar]
- Davis MH, Johnsrude IS,, Hervais-Adelman A, Taylor K, McGettigan C. Lexical information drives perceptual learning of distorted speech: Evidence from the comprehension of noise-vocoded sentences. J Exp Psychol Gen. 2005;134:222–241. doi: 10.1037/0096-3445.134.2.222. [DOI] [PubMed] [Google Scholar]
- Dennett DC. “Filling in” versus finding out. In: Pick HL, Van den Broek P, Knill DC, editors. Cognition, Conception, and Methodological Issues. American Psychological Association; Washington, DC: 1992. pp. 33–49. [Google Scholar]
- Fischl B, Liu A, Dale AM. Automated manifold surgery: Constructing geometrically accurate and topologically correct models of the human cerebral cortex. IEEE Trans Med Imag. 2001;20:70–80. doi: 10.1109/42.906426. [DOI] [PubMed] [Google Scholar]
- Fischl B, Sereno MI, Dale AM. Cortical surface-based analysis II: Inflation, flattening, and a surface-based coordinate system. NeuroImage. 1999;9:195–207. doi: 10.1006/nimg.1998.0396. [DOI] [PubMed] [Google Scholar]
- Fischl B, Sereno MI, Tootell RB, Dale AM. High-resolution intersubject averaging and a coordinate system for the cortical surface. Hum Brain Mapp. 1999;8:272–284. doi: 10.1002/(SICI)1097-0193(1999)8:4<272::AID-HBM10>3.0.CO;2-4. [DOI] [PMC free article] [PubMed] [Google Scholar]
- Ganong WF. Phonetic categorization in auditory word recognition. J Exp Psychol. 1980;6:110–125. doi: 10.1037//0096-1523.6.1.110. [DOI] [PubMed] [Google Scholar]
- Goodglass H, Kaplan E. The assessment of aphasia and related disorders. 2nd ed. Lea & Febige; Philadelphia: 1983. [Google Scholar]
- Granger CWJ. Investigating causal relations by econometric models and cross-spectral methods. Econometrica. 1969;37:424–438. [Google Scholar]
- Grossberg S. Resonant neural dynamics of speech perception. J Phonetics. 2003;31:423–445. [Google Scholar]
- Hämäläinen MA, Ilmoniemi RJ. Interpreting magnetic fields of the brain: Minimum norm estimates. Med Biol Eng and Comp. 1994;32:35–42. doi: 10.1007/BF02512476. [DOI] [PubMed] [Google Scholar]
- Hämäläinen M,J, Sarvas J. Realistic conductivity geometry model of the human head for interpretation of neuromagnetic data. IEEE Trans Med Imag. 1989;BME-36:165–171. doi: 10.1109/10.16463. [DOI] [PubMed] [Google Scholar]
- Hernandez L, Badre D, Noll D, Jonides J. Temporal sensitivity of event-related fMRI. Neuroimage. 2002;17:1018–1026. [PubMed] [Google Scholar]
- Hesse W, Möller E, Arnold M, Schack B. The use of time-variant EEG Granger causality for inspecting directed interdependencies of neural assemblies. J Neurosci Methods. 2003;124:27–44. doi: 10.1016/s0165-0270(02)00366-7. [DOI] [PubMed] [Google Scholar]
- Hickok G,, Poeppel D. The cortical organization of speech processing. Nature Rev Neurosci. 2007;8:393–402. doi: 10.1038/nrn2113. [DOI] [PubMed] [Google Scholar]
- Joliot M, Ribary U, Linas R. Human oscillatory brain activity near 40 Hz coexists with cognitive temporal binding. Proc Natl Acad Sci USA. 1994;91:11748–11751. doi: 10.1073/pnas.91.24.11748. [DOI] [PMC free article] [PubMed] [Google Scholar]
- Kamínski M, Ding M, Truccolo WA, Bressler SL. Evaluating causal relations in neural systems: Granger causality, directed transfer function and statistical assessment of significance. Biol. Cybern. 2001;85:145–157. doi: 10.1007/s004220000235. [DOI] [PubMed] [Google Scholar]
- Kotz SA, Cappa S, von Cramon DY, Friederici AD. Modulation of the lexical-semantic network by auditory semantic priming: An event-related functional MRI study. NeuroImage. 2002;17:1761–1772. doi: 10.1006/nimg.2002.1316. [DOI] [PubMed] [Google Scholar]
- Lachaux J-P, Rodriguez E, Martinerie J, Varela F. Measuring phase-synchrony in brain signals. Hum Brain Mapp. 1999;8:194–208. doi: 10.1002/(SICI)1097-0193(1999)8:4<194::AID-HBM4>3.0.CO;2-C. [DOI] [PMC free article] [PubMed] [Google Scholar]
- Liang H, Ding M, Nakamura R, Bressler SL. Causal influences in primate cerebral cortex during visual pattern discrimination. NeuroReport. 2000;11:2875–2880. doi: 10.1097/00001756-200009110-00009. [DOI] [PubMed] [Google Scholar]
- Lin F-H, Belliveau JW, Dale AM, Hämäläinen M. Distributed current estimates with cortical orientation constraints. Hum Brain Mapp. 2006;27:1–13. doi: 10.1002/hbm.20155. [DOI] [PMC free article] [PubMed] [Google Scholar]
- Lin F-H, Witzel T, Ahlfors SP, Stufflebeam SM, Belliveau JW, Hämäläinen MA. Assessing and improving the spatial accuracy in MEG source localization by depth-weighted minimum-norm estimates. NeuroImage. 2006;31:160–171. doi: 10.1016/j.neuroimage.2005.11.054. [DOI] [PubMed] [Google Scholar]
- Lin F-H, Witzel T, Hämäläinen MA, Dale AM, Belliveau JW, Stufflebeam S. Spectral spatiotemporal imaging of cortical oscillations and interactions in the human brain. NeuroImage. 2004;23:582–595. doi: 10.1016/j.neuroimage.2004.04.027. [DOI] [PMC free article] [PubMed] [Google Scholar]
- Liu AK, Dale AM, Belliveau JW. Monte Carlo simulation studies of EEG and MEG localization accuracy. Hum Brain Mapp. 2002;16:47–62. doi: 10.1002/hbm.10024. [DOI] [PMC free article] [PubMed] [Google Scholar]
- McClelland JL, Elman JL. The TRACE model of speech perception. Cogn Psychol. 1986;18:1–86. doi: 10.1016/0010-0285(86)90015-0. [DOI] [PubMed] [Google Scholar]
- Myers EB, Blumstein SE. The neural basis of the lexical effect: An fMRI investigation. Cereb Cortex. 2008;18:278–288. doi: 10.1093/cercor/bhm053. [DOI] [PubMed] [Google Scholar]
- Näätänen R. The perception of speech sounds by the human brain as reflected by the mismatch negativity (MMN) and its magnetic equivalent (MMNm). Psychophysiology. 2001;38:1–21. doi: 10.1017/s0048577201000208. [DOI] [PubMed] [Google Scholar]
- Norris D, McQueen JM, Cutler A. Merging information in speech perception: Feedback is never necessary. Behav Brain Sci. 2000;23:299–370. doi: 10.1017/s0140525x00003241. [DOI] [PubMed] [Google Scholar]
- Oostendorp TF, van Oosterom A. Source parameter estimation in. inhomogeneous volume conductors of arbitrary shape. IEEE Tran Biomed Eng. 1989;36:382–391. doi: 10.1109/10.19859. [DOI] [PubMed] [Google Scholar]
- Orfanidou E, Marslen-Wilson WD, Davis MH. Neural response suppression predicts repetition priming of spoken words and pseudowords. J Cogn Neurosci. 2006;18:1237–1252. doi: 10.1162/jocn.2006.18.8.1237. [DOI] [PubMed] [Google Scholar]
- Pessoa L, Thompson E, Noë E. Finding out about filling: A guide to perceptual completion for visual science and the philosophy of perception. Behav Brain Sci. 1998;21:723–802. doi: 10.1017/s0140525x98001757. [DOI] [PubMed] [Google Scholar]
- Petersen SE, Fox T, Posner MI, Mintun ME, Raichle PE. Positron emission tomographic studies of the cortical anatomy of single-word processing. Nature. 1988;331:585–589. doi: 10.1038/331585a0. [DOI] [PubMed] [Google Scholar]
- Poeppel D. Pure word deafness and bilateral processing of the speech code. Cognit Sci. 2001;2:679–693. [Google Scholar]
- Prabhakaran R, Blumstein SE, Myers EB, Huchison E, Britton B. An event-related fMRI investigation of phonological-lexical competition. Neuropsychologia. 2006;44:2209–2221. doi: 10.1016/j.neuropsychologia.2006.05.025. [DOI] [PubMed] [Google Scholar]
- Price CJ. The functional anatomy of word comprehension and production. Trends Cogn Sci. 1998;8:281–286. doi: 10.1016/s1364-6613(98)01201-7. [DOI] [PubMed] [Google Scholar]
- Pylkkänen L, Stringfellow A, Marantz A. Neuromagnetic evidence for the timing of lexical activation: An MEG component sensitive to phonotactic probability but not to neighborhood density. Brain Lang. 2002;81:666–678. doi: 10.1006/brln.2001.2555. [DOI] [PubMed] [Google Scholar]
- Raettig T, Kotz S. Audiory processing of different types of pseudo-words: An event-related fMRI study. NeuroImage. 2007;39:1420–1428. doi: 10.1016/j.neuroimage.2007.09.030. [DOI] [PubMed] [Google Scholar]
- Roebroek A, Formisano E, Goebel R. Mapping directed inluence over the brain using Granger causality and fMRI. NeuroImage. 2005;25:230–242. doi: 10.1016/j.neuroimage.2004.11.017. [DOI] [PubMed] [Google Scholar]
- Samuel AG, Pitt MA. Lexical activation (and other factors) can mediate compensation for coarticulation. J Mem Lang. 2003;48:416–434. [Google Scholar]
- Sanai N, Mirzadeh Z, Berger MS. Functional outcome after language mapping for glioma resection. NE J Med. 2008;358:18–27. doi: 10.1056/NEJMoa067819. [DOI] [PubMed] [Google Scholar]
- Schwartz G. Estimating the dimension of a model. Ann Stat. 1978;5:461–464. [Google Scholar]
- Sekiguchi T, Koyama S, Kakigi R. The effect of word repetition on evoked magnetic responses in the human brain. Japanese Psychological Research. 2000;42:3–14. [Google Scholar]
- Segonne F, Dale AM, Busa E, Glessner M, Salat D, Hahn HK, Fischl B. A hybrid approach to the skull-stripping problem in MRI. NeuroImage. 2004;22:1160–1075. doi: 10.1016/j.neuroimage.2004.03.032. [DOI] [PubMed] [Google Scholar]
- Seth AK. Causal connectivity of evolved neural networks during behavior. Network: Comput Neural Syst. 2005;16:35–54. doi: 10.1080/09548980500238756. [DOI] [PubMed] [Google Scholar]
- Supp GG, Schlögl A, Trujillo-Barreto N, Müller MM, Gruber T. Directed cortical information flow during human object recognition: Analyzing EEG gamma band responses in the brain's source space. PLoS ONE. 2007;2:e684. doi: 10.1371/journal.pone.0000684. [DOI] [PMC free article] [PubMed] [Google Scholar]
- Tallon-Baudry C, Bertrand O. Oscillatory gamma activity in humans and its role in object representation. Trends Cogn Sci. 1999;3:151–162. doi: 10.1016/s1364-6613(99)01299-1. [DOI] [PubMed] [Google Scholar]
- Tallon-Baudry C, Bertrand O, Delpuech C, Pernier J. Oscillatory g-band activity (30−70 Hz) induced by a visual search task in human. J Neurosci. 1997;17:722–734. doi: 10.1523/JNEUROSCI.17-02-00722.1997. [DOI] [PMC free article] [PubMed] [Google Scholar]
- Warren RM. Restoration of missing speech sounds. Science. 1970;167:392–393. doi: 10.1126/science.167.3917.392. [DOI] [PubMed] [Google Scholar]
- Wehner D, Ahlfors SP, Mody M. The influence of semantic processing on phonological decisions in children and adults: A magnetoencephalography (MEG) study. J Speech Lang Hearing Res. 2007;50:716–731. doi: 10.1044/1092-4388(2007/050). [DOI] [PubMed] [Google Scholar]
- Zatorre R, Evans A, Meyer E, Gjedde A. Lateralization of phonetic and pitch discrimination in speech processing. Science. 1992;256:846–849. doi: 10.1126/science.1589767. [DOI] [PubMed] [Google Scholar]
- Zatorre RJ, Meyer E, Gjedde A, Evans A. PET studies of phonetic processing of speech: Review, replication, and reanalysis. Cereb Cortex. 1996;6:21–30. doi: 10.1093/cercor/6.1.21. [DOI] [PubMed] [Google Scholar]
Associated Data
This section collects any data citations, data availability statements, or supplementary materials included in this article.