

Abstract
Purpose
To test the hypothesis that manganese-enhanced magnetic resonance imaging (MEMRI) is a sensitive approach for measuring of age-related ocular changes in experimental pigmentary glaucoma.
Methods
Four groups of light-adapted mice were studied using MEMRI: young (2–3 months), C57BL/6 (negative controls), and DBA/2J mice and aged (10–11 months) C57BL/6 and DBA/2J mice. In all mice, eye perimeter, optic nerve head width, iridocorneal angle, ciliary body area, and total and inner retinal thickness, and a surrogate of retinal ion regulation (intraretinal uptake of manganese) were assessed from MEMRI data and compared. Axon counts were obtained from optic nerves harvested from MEMRI-assessed eyes.
Results
As the C57BL/6 and DBA/2J mice aged, differential and significant changes in ocular perimeter, retinal thickness, iridocorneal angle, ciliary body area, and optic nerve head width were readily measured from MEMRI data (P < 0.05). In C57BL/6 mice, only inner retinal thickness and perimeter were correlated. In DBA/2J mice, ocular perimeter was correlated with total and inner retinal thickness, ciliary body area, optic nerve head width, and iridocorneal angle. Comparison of young and aged mice revealed a subnormal intraretinal manganese uptake (P < 0.05) in aged DBA/2J mice, but not in aged C57BL/6 mice. Manganese uptake did not correlate with the ocular perimeter. Axon density in the optic nerve correlated with MEMRI-measured optic nerve head width (P < 0.05).
Conclusions
These studies provide a baseline of noninvasive MEMRI-detectable changes associated with age in a common animal model of hereditary glaucoma that may be useful in the longitudinal evaluation of therapeutic success.
Preventing vision loss in glaucoma has been limited by the inability of currently available methods, such as electroretinography (ERG) and ocular coherence tomography (OCT), to assess regional prehistologic retinal changes leading to irreversible degeneration of retinal ganglion cells (RGCs) and their axons in the optic nerve.1-3 In other words, interventions based on irreversible structural changes are likely to be applied late in the degenerative process and so may, at best, be expected only to minimize additional losses. Methods that are more sensitive to glaucoma-related changes in retinal physiology may allow for earlier intervention and thus could be more effective in improving therapeutic outcome.
The pathophysiology of glaucoma is not well understood, although current evidence strongly supports the concept that abnormal regulation of ionic activity leading to calcium overload is an apoptotic triggering event linked with retinal ganglion cell demise4-7 and optic nerve degeneration.8,9 Studies of pressure-related ischemic injury at the nerve head indicate that influx of extracellular Ca2+ into the RGC axoplasm is critical to disease from ischemic insult.10 In indirect support of this idea, drugs used to lower IOP or reduce vasoconstriction in glaucoma also have a secondary action on RGCs by modulating accumulation of intracellular Ca2+.11 For example, nonselective β-adrenoceptor antagonists blunt the influx of both Na+ and Ca2+ into RGCs.5 Also, betaxolol, a β1-antagonist, is highly effective at reducing Ca2+ influx to RGCs induced by glutamate receptor agonism.12 These data suggest that monitoring ion flux may be a promising diagnostic and/or prognostic parameter in glaucoma.
Manganese-enhanced MRI (MEMRI) allows for noninvasive and simultaneous measurement of ocular anatomy, including structures expected to be targets of glaucomatous damage (e.g., ciliary body area, iridocorneal angle, ocular perimeter, and retinal thickness). It also allows for assessment of structure-specific uptake of the manganese (Mn2+) ion after systemic MnCl2 injection.13-16 The Mn2+ ion is an MRI contrast agent and analogue of, for example, Ca2+; readily accumulates intracellularly as a function of membrane integrity and cellular activity; and is relatively slowly removed.17-21 We have shown that intraretinal manganese uptake reflects dysfunctional retinal ion activity before and during retinopathy in experimental rat models, including two models of retinal degeneration.13-16 These data also suggest a possible role of intraretinal ion dysregulation in the formation of retinal histopathology. The potential value of applying MEMRI to glaucoma has only begun to be explored.9
In this study, we tested the hypothesis that MEMRI can be useful for addressing the knowledge gaps by evaluating in young and aged C57BL/6 and DBA/2J mice the differences in ocular anatomy and intraretinal ion activity. The DBA/2J mouse is a model of hereditary glaucoma in which RGC axonal degeneration in the optic nerve is associated with age-dependent elevations in IOP that are normally absent in other mouse strains.22-26 These elevations arise from closure of the drainage canals in the anterior segment induced by iris atrophy and pigment dispersion that are caused by mutations in the Tyrp1 and Gpnmb genes, respectively.26-28 This ocular phenotype presents prominently in many DBA/2J mice by 4 to 6 months and increases in probability of occurrence with increasing age.25,26,29 However, at each age, even in older animals, there is considerable variability in the degree of ocular and nerve disease.25
Methods
The animals were treated in accordance with the Principles of Laboratory Animal Care (publication no. 85–23, revised 1985; http://grants1.nih.gov/grants/olaw/references/phspol.htm), as well as the ARVO Statement for the use of Animals in Ophthalmic and Vision Research.
Groups
The C57BL/6 mice were purchased from Jackson Laboratories (Bar Harbor, ME) and maintained at the Wayne State School of Medicine. The DBA/2J mice were obtained from Jackson Laboratories, maintained in a specific pathogen-free facility at Harborview Research and Training, University of Washington, and regularly backcrossed with fresh founders from Jackson Laboratories to minimize uncontrolled genetic drift. At select times, these mice were shipped to the Wayne State School of Medicine. In all cases, the mice were maintained in a 12-hour light–dark cycle with standard rodent chow available ad libitum. Four groups of light-adapted mice were studied by using manganese-enhanced magnetic resonance imaging (MEMRI): young (2–3 months) C57BL/6 (negative controls, n = 4) and DBA/2J (n = 9) mice and aged (10–11 months) C57BL/6 (n = 7) and DBA/2J (n = 6) mice. The aged group was chosen as 10 to 11 months to maximize the probability of observing differences from the young group in this first MEMRI study. The aged DBA/2J mice were chosen for similarity in IOP, as measured monthly by a handheld tonometer (TonoPen; Medtronic, Jacksonville, FL).25 The range of mean IOPs for the left eye of these animals (which we imaged) was 16.1 to 17.9 mm Hg (mean ± SD: 16.75 ± 0.63), and a Kruskal-Wallis one-way analysis of variance using ranks indicated no significant difference between monthly IOP measurements in these eyes (F = 0.56, P = 0.82). By comparison, mean IOP in 3-month DBA/2J mice in our colony at the time of harvesting was 15.5 mm Hg.
High-Resolution MRI
All mice were housed in normal 12-hour cycled laboratory lighting until the end of the experiment. Then they were maintained in darkness for 16 to 20 hours and then lab lighting for 20 minutes before manganese injection. MnCl2 was administered as an intraperitoneal injection (66 mg/kg) on the right side of awake mice. After this injection, the mice were maintained in light conditions for another 3.5 to 4 hours and were anesthetized for MEMRI examination. Immediately before the MRI experiment, the mice were anesthetized using urethane (36% solution. 0.083 mL/20 g animal weight IP, prepared fresh daily; Aldrich, Milwaukee, WI) and xylazine (1–8 mg/kg IP). We found that urethane alone tended to increase the respiratory frequency of the mice and thus motion artifacts on MEMRI. The addition of a small amount of the muscle relaxant xylazine minimized these artifacts. Because of the use of urethane, separate groups of mice were used at each time point. Core temperatures were maintained with a recirculating heated water blanket. MRI data were acquired on a 4.7-T system (Avance; Bruker BioSpin Corp., Billerica, MA) using a two-turn transmit–receive surface coil (1.0 cm diameter) placed over the eyes. A single transverse slice through the center of the eye (based on sagittal localizer images collected using the same adiabatic pulse sequence as above) was obtained for each mouse. Transverse images were then acquired using an adiabatic spin-echo imaging sequence (repetition time, TR 350 seconds; echo time, TE 16.7 ms; number of acquisitions, NA 16; sweep width, 61,728 Hz; matrix size, 512 × 512; slice thickness, 620 μm; field of view, 12 mm2).
Data Analysis
Ocular Anatomy
From each image, the following structures were identified and measured: ocular perimeter, ciliary body area, iridocorneal angle, optic nerve head width, and retinal thickness.
Ocular Perimeter
Previously, we, and others, found that changes in intraocular pressure could be estimated on very high resolution MRI by, for example, changes in ocular perimeter.30,31 We reported that reasonable agreement between the MRI-derived perimeter of rat eyes and applanation tonometry readings (Tono-Pen XL; Medtronic) were found.31
Ciliary Body Area
As shown in Figure 1, in each image, both superior and inferior ciliary bodies were readily identified. The area of each body was determined in NIH image (available by ftp at zippy.nimh.nih.gov/ or at http://rsb.info.nih.gov/nih-image; developed by Wayne Rasband, National Institutes of Health, Bethesda, MD). No differences between superior and inferior values were noted (data not shown), and so these were averaged together for further analysis.
Figure 1.
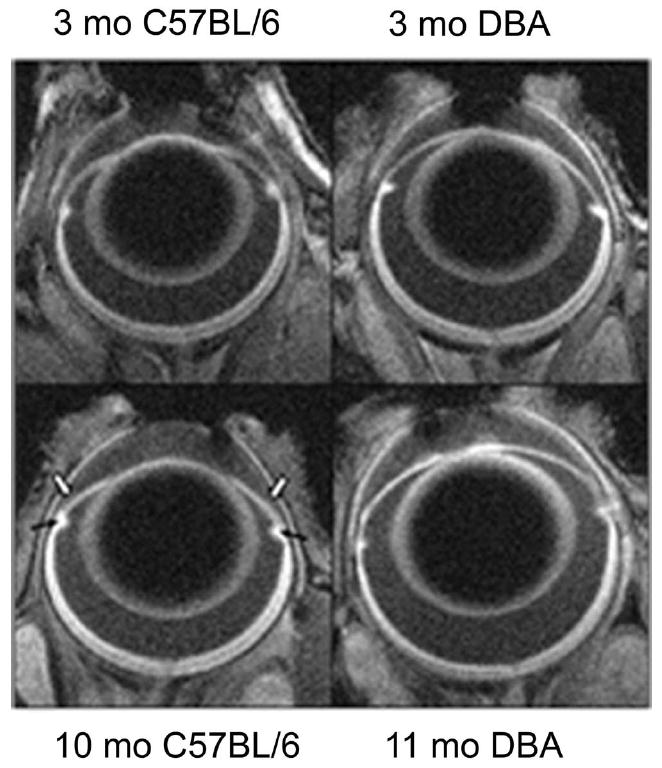
Representative high-resolution MEMRI data of (top left) 3- and (top right) 10-month-old C57BL/6 mouse eyes and (bottom left) 3- and (bottom right) 11-month-old DBA/2J mouse eyes. Black arrows: ciliary bodies; open arrows: iridocorneal angle.
Iridocorneal Angle
Both superior and inferior angles were readily identified on each image. Angles were measured using the angle function in NIH image Superior and inferior values were not different (data not shown) and were averaged together for comparison.
Optic Nerve Head Width
In each image, the cross-section of retina at the optic nerve head was identified by the relative lack of manganese uptake. The distance from superior to inferior retina at the inflection point defines the optic nerve head width used in this study.
Retinal Thickness
Total and inner (nerve fiber layer+ganglion cell layer+inner plexiform layer+inner nuclear layer) retinal thicknesses were manually measured from superior and inferior retina at six different locations per side as the radial distance between the anterior and posterior edges of the retina or anterior and border of postreceptor and receptor retina, respectively, at 0.4 to 1 mm from the optic nerve. No differences between superior and inferior hemiretinal thickness values were noted (data not shown). Thus, averaged data were used for comparisons.
Layer-Specific Signal Intensity
For visualization and comparison purposes, in-house written software was used to convert the in situ image into a linear representation for each retina. Within each group, linearized retinas were averaged into a composite image. For quantitative analysis, signal intensities were analyzed by using the program NIH Image and derived macros. Changes in receiver gain between the animals were controlled for by setting the signal intensity of a fixed region of noise in each mouse to a fixed value. Inner retina and outer retina signal intensity data (from the edge of the optic nerve to 1 mm from the center of the optic nerve) were extracted as follows. The border between the inner and outer retina was set at 4 pixels posterior to the clearly defined vitreoretinal division. We then drew another border between retina and choroid at 3 pixels posterior from inner– outer division. Pixels immediately anterior to these borders were considered representative of postreceptor and receptor retina (respectively) and analyzed as previously described.
Another parameter that was derived from MEMRI data is the percentage difference between inner and outer retinal uptake. As previously shown, this percentage difference reflects light-adapted (i.e., significant inner and outer retinal uptake differences) and dark-adapted (i.e., nonsignificant inner and outer differences) retinas.20
Histopathology and Axon Counts
After the MEMRI experiment, DBA/2J and C57BL/6 mice were perfused with 4% paraformaldehyde (PFA) in 0.1 M phosphate buffer (PB; pH 7.4). Eyes of nine young DBA/2J, five aged DBA/2J, and six aged C57BL/6 with optic nerves attached were carefully dissected from the skull. A 2-to 3-mm section of optic nerve proximal to the globe was isolated, postfixed for 1 hour in 4% PFA, and prepared for embedding and semithin sectioning, as previously described.25 An additional sample of five young (2–3 months) C57BL/6 nerves were also included for comparison. Using 100× oil-immersion, differential interference contrast optics, photomicrographs of each section were collected en montage with a microscope equipped (Provis AX70; Olympus, Tokyo, Japan) with a motorized X-Y-Z stage and a digital CCD camera. Because the effective magnification through the CCD camera was over 1000×, we ensured through the high number of photomicrographs and our sampling algorithm that the entire surface area of the nerve was represented in the sample. Each micrograph was contrast and edge-enhanced using macro routines written in commercial software (ImagePro; Media Cybernetics, Bethesda, MD). An additional routine was used to identify and count each axon on which a myelin sheath was identified and to calculate the sampling area of the micrograph. We used this information to calculate the mean local axon density for each sample.
Statistical Analysis
The ocular anatomic data were consistent with a normal distribution, and comparisons between groups were mostly performed with an unpaired two-tailed t-test. Comparisons of MEMRI retinal signal intensities were performed with a generalized estimating equation (GEE) approach.20,32 GEE performs a general linear regression analysis on all the pixels in each subject and accounts for the with-in subject correlation between adjacent pixels. In all cases, P < 0.05 was considered statistically significant. The data are presented as the mean ± SEM unless otherwise noted.
Results
Ocular Anatomy
Representative high-resolution images from young and aged C57BL/6 and DBA/2J mice are presented in Figure 1. The overall 15% increase in ocular perimeter in the aged DBA/2J mice is readily visualized compared to a 3% increase for the C57BL/6 eye. Quantitative analysis, summarized in Table 1, revealed other significant changes between young and aged C57BL/6 mice. Specifically, total retinal thickness decreased by 8% (P < 0.05), while iridocorneal angle increased by 15% (P < 0.05). From the combined young and aged C57BL/6 data set, only ocular perimeter and inner retinal thickness correlated (r = −0.65, P < 0.05). In contrast, for DBA/2J mice, a relatively greater constellation of significant decreases was noted with aging (P < 0.05): total (7%) and inner retinal thickness (8%), ciliary body area (37%), and iridocorneal angle (66%); optic nerve head width increased (38%). In young and aged animals combined, strong correlations with ocular perimeter were found for all anatomic parameters measured in the DBA/2J (r > 0.7, P < 0.05). Ocular perimeter and inner retinal thickness also correlated (Fig. 2) in both the DBA/2J and the C57BL/6 groups.
Table 1.
Summary of Ocular Anatomy
| Retinal Thickness (μm)
|
||||||
|---|---|---|---|---|---|---|
| Group | Total | Inner | Perimeter (μm) | CB Area (μm2) | ONH Width (μm) | Iridocorneal Angle (°) |
| 3-mo C57BL/6 (n = 10) | 224 ± 2 | 106 ± 2 | 11379.8 ± 51.9 | 0.035 ± 0.001 | 174.3 ± 18.4 | 28.5 ± 3.1 |
| 10-mo C57BL/6 (n = 9) | 207 ± 2* | 102 ± 2 | 11731.0 ± 60.9* | 0.038 ± 0.002 | 185.3 ± 18.3 | 33.5 ± 2.3* |
| 3-mo DBA/2J (n = 9) | 229 ± 1 | 98 ± 1* | 11616.0 ± 62.6* | 0.038 ± 0.002 | 180.4 ± 12.5 | 30.8 ± 1.9 |
| 11-mo DBA/2J (n = 6) | 214 ± 3*† | 90 ± 2*† | 13384.4 ± 226.2*† | 0.024 ± 0.002*† | 288.3 ± 32.4*† | 10.4 ± 1.2*† |
Data are the mean ± SEM.
P < 0.05, relative to 3-mo C57BL/6.
P < 0.05, relative to 3-mo DBA/2J.
Figure 2.
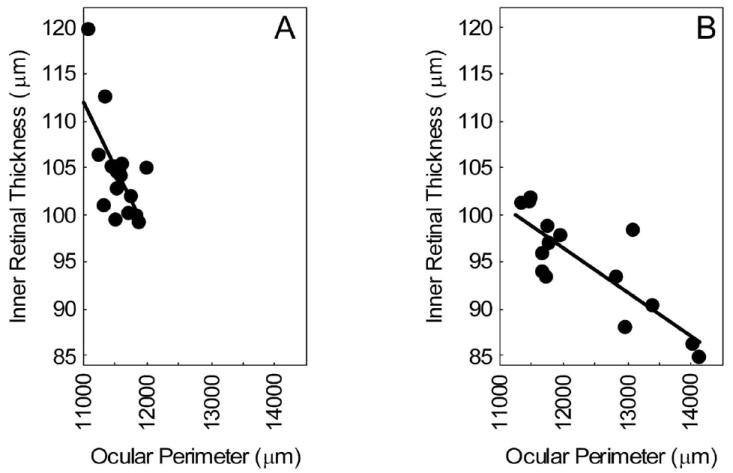
Plot of MEMRI-derived inner retinal thickness versus ocular perimeter. Data points are from (A) the combined 3- and 10-month-old C57BL/6 group (r = −0.65) and (B) the combined 3- and 11-month-old DBA/2J group (B, r = −0.83). For both data sets, the correlation is significant (P < 0.05).
Ion Regulation
As expected, in light-adapted mice (Roberts R, et al. IOVS 2008;49:ARVO E-Abstract 4926), significant differences (P < 0.05) between inner and outer retinal uptake were measured for both 3 and 10 months. C57BL/6 mice (Fig. 3), with uptake for the inner retina approximately 15% greater in each case. Comparison of 3 and 10 months C57BL/6 mice also revealed a significant (P < 0.05) 18% and 24% increase with age in inner and outer retinal uptake of manganese, respectively (Fig. 3). In contrast, in DBA/2J mice, despite being light adapted, a difference in inner and outer retinal uptake signal was noted only in the 3-month mice and not in the 11-month animals (Fig. 3). This difference appears to be due to the inner retina, since it had the largest change (6%; Fig. 3).
Figure 3.
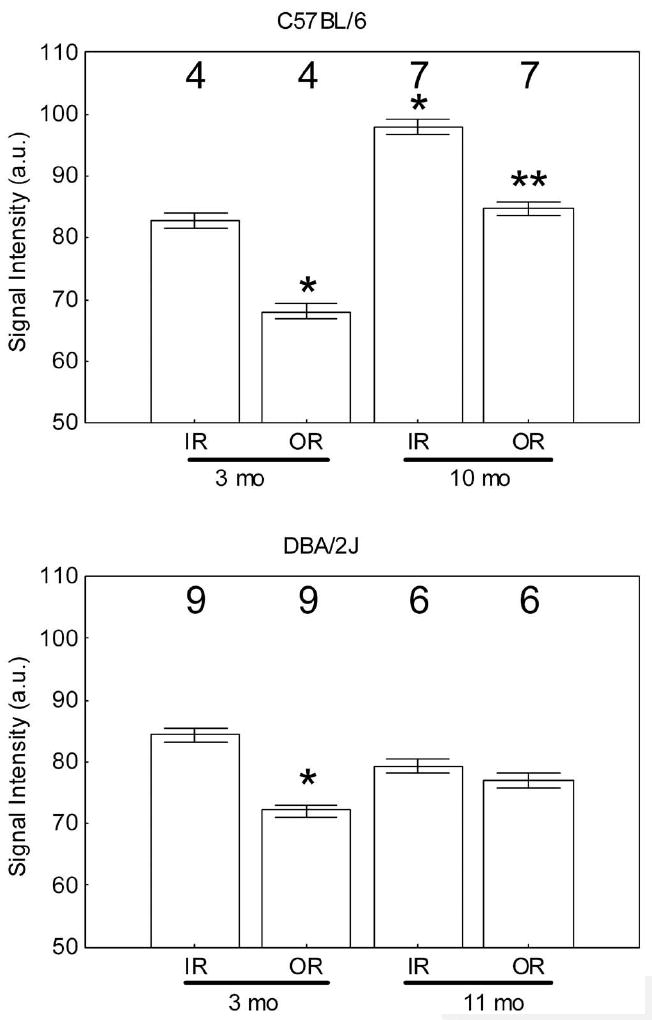
MEMRI signal intensity (arbitrary units) changes in central inner retina (IR) and outer retina (OR) in light-adapted C57BL/6 mice (top) and DBA/2J mice (bottom) measured 4 hours after intraperitoneal systemic administration of MnCl2. *Significantly different (P < 0.05) from the 3-month inner retinal value; **significantly different from the 10-month inner retinal value. Note that the minimum value (50) of the y-axis is set to the signal intensity measured in the absence of manganese exposure. Error bars, SEM; numbers above the bars, number of animals studied.
Axon Counts
The density of axons in the proximal optic nerve was not significantly different between any of the groups (P > 0.05, Table 2), although the aged DBA/2J group had an average axon density 18% less than that of the young group, as expected.33 The lack of significance in this difference reflects the large variability within each group, as also noted in the literature,25 the relatively small sample size for this first study, and the relatively modest elevations in IOP for the aged animals we choose (see the Methods section). These data are consistent with our previous work showing that some aged DBA/2J can demonstrate a complete complement of axons.25 Nevertheless, a plot of axon density against MEMRI-measured optic nerve head width in the same animals revealed a significant negative correlation (r = −0.62, P = 0.02, Fig. 4). If 10-month C57BL/6 data are included on this plot, no change in the degree of correlation was noted (r = −0.60, P = 0.01, data not shown). Thus, as has been reported with IOP, changes in axon density accompany MEMRI-measured changes in optic nerve head width.25
Table 2.
Summary of Axon Density Counts
| Group | Density (Axons/mm2) |
|---|---|
| Young C57BL/6 (n = 5) | 186,223 ± 44,019 |
| Aged C57BL/6 (n = 6) | 219,069 ± 22,213 |
| Young DBA/2J (n = 9) | 232,567 ± 18,265 |
| Aged DBA/2J (n = 5) | 191,603 ± 48,006 |
Data are the mean ± SEM.
Figure 4.
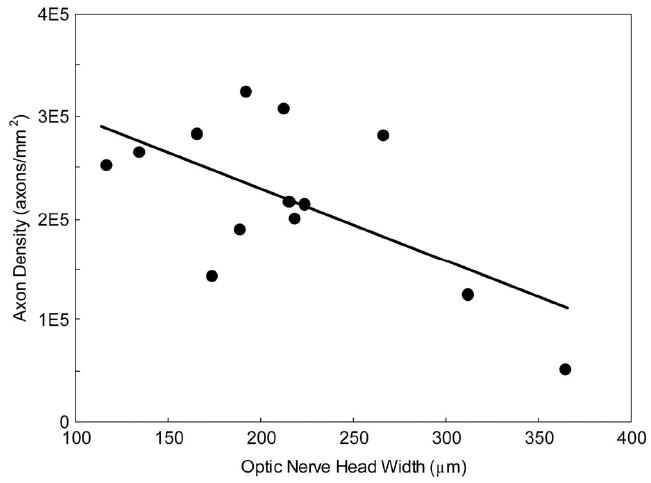
Plot of mean axon density in the proximal optic nerve measured histologically versus MEMRI-derived optic nerve head (r = −0.60, P = 0.02). Data points are combined from 3- and 11-month-old DBA/2J mice.
Discussion
In this study, MEMRI data of C57BL/6 and DBA/2J mice were used to identify, for the first time, unique phenotypes of differential age-related changes in ocular anatomy and retinal physiology. Like other neurodegenerative conditions, age is the greatest risk factor for glaucoma,34 with the likelihood of development of the disease increasing nearly sevenfold after 55 years of age.35 Thus, in deciphering the pathogenesis of retinal ganglion cell degeneration in glaucoma, it is critical to discriminate contributing factors associated with aging. The unique ability of MEMRI to simultaneously measure colocalized retinal structure and function as well as other ocular anatomic parameters raises the possibility that it may become a standard procedure for future ocular studies in mice. These doubtlessly will include critical time points in mid-disease progression (roughly, 5–8 months).25 The present studies provide a baseline of noninvasive MEMRI-detectable changes that anchor both an early (2–3 months) and later (10–11 months) phase of disease progression in the DBA/2J against which to evaluate future therapeutic success longitudinally.
The dose of MnCl2 used in the present study (66 mg/kg) is not expected to affect retinal function or anatomy adversely, especially in the 4 hours between injection and examination. A similar dose has been used in other mouse MEMRI studies, without any reported adverse affects or neurotoxicity.36,37 In initial studies, we administered a dose that has worked well in rats (44 mg/kg, IP) but did not find reliable contrast changes in the mouse retina, possibly due to the relatively higher overall metabolic rate in the mouse (data not shown). Based on these considerations and our previous work with a nontoxic dose of MnCl2 (44 mg/kg),19,20 it is reasonable to consider the 66 mg/kg dose as nontoxic and the intraretinal uptake of manganese as a quantitative biomarker of ion activity regulation in vivo.
In C57BL/6 mice, aging was linked with increased ocular perimeter which correlated with increased iridocorneal angle and decreased total retinal thickness. Comparisons of these structural changes with the literature are limited, as the in vivo ocular perimeter and iridocorneal angle in mice have been examined in few studies. We note that previously, MEMRI has been validated as an accurate measure of retinal thickness without choroidal contamination in the rat13,20 and has been applied to mouse eyes but at far lower spatial resolution than in the present study and after intravitreous delivery of manganese.38,39 In the present study, in young control mice, MEMRI-based total retinal thickness measure (224 ± 2 μm) was in reasonable agreement with published murine thickness values from in vivo optical coherence tomography (220–250 μm) and ex vivo literature.40-42 One caveat is that the thickness changes found were smaller than the pixel size, and so some caution is needed when interpreting subtle differences. Nonetheless, the decrease in retinal thickness that we found in aged C57BL/6 mice was as expected, based on the literature.43 Since inner retinal thicknesses did not change over time in this study, it is reasonable to speculate that changes in the outer retina that occurred were most likely related to photoreceptor dysfunction.
Changes in intraretinal ion regulation with aging in C57BL/6 mice were also found. Previously, we documented a supernormal manganese uptake in the inner and outer retina before histopathology after an insult to the photoreceptor–retinal pigment epithelium complex in rats.13 These data, together with the above considerations that outer retina appeared damaged in the aged C57BL/6 mouse, raise the possibility that the supernormal uptake of manganese reflects outer retinal damage. We have previously demonstrated that, in the rat, intraretinal manganese uptake patterns robustly correlated with normal retinal physiology responses associated with light and dark visual processing.20 Of interest, the phototransduction ability of the outer retina did not seem affected by age, since the expected differences in inner and outer retina uptake in light-adapted conditions were found (Fig. 2). We did not find any correlation between structural and physiologic parameters. This finding may not be surprising, given the different types of information provided by each measurement (i.e., snapshot of intraretinal ion regulation versus chronic changes in anatomy). These structural and functional changes help define a baseline aging phenotype that can be measured with MEMRI.
Aged DBA/2J mice exhibited structural and physiologic differences relative to those measured in the C57BL/6 mice. Large increases in ocular perimeter, decreased ciliary body area and chamber angle, expansion of the region of low manganese uptake in the optic nerve head region, and thinning of the inner retina are all consistent with the development of glaucoma in this model, including neurodegeneration. These anatomic phenotypes appeared linked since perimeter or nerve head changes were well correlated with the other changes—for example, axon density (Fig. 4).33 MEMRI is clearly sensitive to the effects of glaucoma, and more work is now needed to gain a better understanding of the temporal evolution of structural and functional changes in experimental glaucoma. In any event, noninvasive MEMRI-detectable changes accompanying the development of glaucoma are expected to be useful in future studies designed for longitudinal evaluation of novel neuroprotective drug therapies.
In summary, we have demonstrated the utility of MEMRI for in vivo studies of age-related differences and those due to glaucoma in the mouse. Despite its somewhat low relative resolution, relative to OCT, for example, the information content in each MEMRI data set is relatively much higher. These observations support the use MEMRI for phenotyping glaucomatous eyes in vivo.
Acknowledgments
Supported by the Melza M. and Frank Theodore Barr Foundation through the Glaucoma Research Foundation Catalyst for a Cure Initiative (DJC), a Challenge Grant and a Wasserman Award from Research to Prevent Blindness, Inc. (DJC), National Eye Institute Grant EY010221 (BAB), the Juvenile Diabetes Research Foundation (BAB), and an unrestricted grant from Research to Prevent Blindness (Kresge Eye Institute).
Footnotes
Disclosure: D.J. Calkins , None; P.J. Horner, None; R. Roberts, None; M. Gradianu, None; B.A. Berkowitz, None
References
- 1.Jay JL, Murdoch JR. The rate of visual field loss in untreated primary open angle glaucoma. Br J Ophthalmol. 1993;77(3):176–178. doi: 10.1136/bjo.77.3.176. [DOI] [PMC free article] [PubMed] [Google Scholar]
- 2.Quigley HA. Current and future approaches to glaucoma screening. J Glaucoma. 1998;7(3):210–220. [PubMed] [Google Scholar]
- 3.Jonas JB, Budde WM. Diagnosis and pathogenesis of glaucomatous optic neuropathy: morphological aspects1. Prog Retin Eye Res. 2000;19(1):1–40. doi: 10.1016/s1350-9462(99)00002-6. [DOI] [PubMed] [Google Scholar]
- 4.Nickells RW. Apoptosis of retinal ganglion cells in glaucoma: an update of the molecular pathways involved in cell death. Surv Ophthalmol. 1999;43(suppl 1):S151–S161. doi: 10.1016/s0039-6257(99)00029-6. [DOI] [PubMed] [Google Scholar]
- 5.Osborne NN, Wood JPM, Chidlow G, Casson R, DeSantis L, Schmidt K-G. Effectiveness of levobetaxolol and timolol at blunting retinal ischaemia is related to their calcium and sodium blocking activities: relevance to glaucoma. Brain Res Bull. 2004;62(6):525–528. doi: 10.1016/S0361-9230(03)00070-4. [DOI] [PubMed] [Google Scholar]
- 6.Hirooka K, Kelly MEM, Baldridge WH, Barnes S. Suppressive actions of betaxolol on ionic currents in retinal ganglion cells may explain its neuroprotective effects. Exp Eye Res. 2000;70(5):611–621. doi: 10.1006/exer.2000.0822. [DOI] [PubMed] [Google Scholar]
- 7.Kelly MEM, Barnes S. Physiology and pathophysiology of nitric oxide in the retina. Neuroscientist. 1997;3(6):357–360. [Google Scholar]
- 8.Inman DM, Sappington RM, Horner PJ, Calkins DJ. Quantitative correlation of optic nerve pathology with ocular pressure and corneal thickness in the DBA/2 mouse model of glaucoma. Invest Ophthalmol Vis Sci. 2006;47(3):986–996. doi: 10.1167/iovs.05-0925. [DOI] [PubMed] [Google Scholar]
- 9.Chan KC, Fu QL, So KF, Wu EX. Evaluation of the visual system in a rat model of chronic glaucoma using manganese-enhanced magnetic resonance imaging. Conf Proc IEEE Eng Med Biol Soc. 2007;1:67–70. doi: 10.1109/IEMBS.2007.4352224. [DOI] [PubMed] [Google Scholar]
- 10.Stys PK, Waxman SG, Ransom BR. Ionic mechanisms of anoxic injury in mammalian CNS white matter: role of Na+ channels and Na(+)-Ca2+ exchanger. J Neurosci. 1992;12(2):430–439. doi: 10.1523/JNEUROSCI.12-02-00430.1992. [DOI] [PMC free article] [PubMed] [Google Scholar]
- 11.Ishii Y, Kwong JM, Caprioli J. Retinal ganglion cell protection with geranylgeranylacetone, a heat shock protein inducer, in a rat glaucoma model. Invest Ophthalmol Vis Sci. 2003;44(5):1982–1992. [PubMed] [Google Scholar]
- 12.Zhang J, Wu SM, Gross RL. Effects of [beta]-adrenergic blockers on glutamate-induced calcium signals in adult mouse retinal ganglion cells. Brain Res. 2003;959(1):111–119. doi: 10.1016/s0006-8993(02)03735-6. [DOI] [PubMed] [Google Scholar]
- 13.Berkowitz BA, Roberts R, Luan H, et al. Manganese-enhanced MRI studies of alterations of intraretinal ion demand in models of ocular injury. Invest Ophthalmol Vis Sci. 2007;48(8):3796–3804. doi: 10.1167/iovs.06-1278. [DOI] [PMC free article] [PubMed] [Google Scholar]
- 14.Berkowitz BA, Roberts R, Stemmler A, Luan H, Gradianu M. Impaired apparent ion demand in experimental diabetic retinopathy: correction by lipoic acid. Invest Ophthalmol Vis Sci. 2007;48(10):4753–4758. doi: 10.1167/iovs.07-0433. [DOI] [PubMed] [Google Scholar]
- 15.Berkowitz BA, Roberts R, Penn JS, Gradianu M. High-resolution manganese-enhanced MRI of experimental retinopathy of prematurity. Invest Ophthalmol Vis Sci. 2007;48(10):4733–4740. doi: 10.1167/iovs.06-1516. [DOI] [PubMed] [Google Scholar]
- 16.Braun RD, Gradianu M, Vistisen KS, Roberts RL, Berkowitz BA. Manganese-enhanced MRI of human choroidal melanoma xenografts. Invest Ophthalmol Vis Sci. 2007;48(3):963–967. doi: 10.1167/iovs.06-1156. [DOI] [PMC free article] [PubMed] [Google Scholar]
- 17.Wendland MF. Applications of manganese-enhanced magnetic resonance imaging (MEMRI) to imaging of the heart. NMR Biomed. 2004;17(8):581–594. doi: 10.1002/nbm.943. [DOI] [PubMed] [Google Scholar]
- 18.Lin YJ, Koretsky AP. Manganese ion enhances T1-weighted MRI during brain activation: an approach to direct imaging of brain function. Magn Reson Med. 1997;38(3):378–388. doi: 10.1002/mrm.1910380305. [DOI] [PubMed] [Google Scholar]
- 19.Berkowitz BA, Roberts R, Luan H, et al. Manganese-enhanced MRI studies of alterations of intraretinal ion demand in models of ocular injury. Invest Ophthalmol Vis Sci. 2007;48(8):3796–3804. doi: 10.1167/iovs.06-1278. [DOI] [PMC free article] [PubMed] [Google Scholar]
- 20.Berkowitz BA, Roberts R, Goebel DJ, Luan H. Noninvasive and simultaneous imaging of layer-specific retinal functional adaptation by manganese-enhanced MRI. Invest Ophthalmol Vis Sci. 2006;47(6):2668–2674. doi: 10.1167/iovs.05-1588. [DOI] [PubMed] [Google Scholar]
- 21.Lu H, Xi ZX, Gitajn L, Rea W, Yang Y, Stein EA. Cocaine-induced brain activation detected by dynamic manganese-enhanced magnetic resonance imaging (MEMRI) Proc Natl Acad Sci U S A. 2007;104(7):2489–2494. doi: 10.1073/pnas.0606983104. [DOI] [PMC free article] [PubMed] [Google Scholar]
- 22.Schuettauf F, Quinto K, Naskar R, Zurakowski D. Effects of anti-glaucoma medications on ganglion cell survival: the DBA/2J mouse model. Vision Res. 2002;42(20):2333–2337. doi: 10.1016/s0042-6989(02)00188-8. [DOI] [PubMed] [Google Scholar]
- 23.Zhou X, Li F, Kong L, Tomita H, Li C, Cao W. Involvement of inflammation, degradation, and apoptosis in a mouse model of glaucoma. J Biol Chem. 2005;280(35):31240–31248. doi: 10.1074/jbc.M502641200. [DOI] [PubMed] [Google Scholar]
- 24.Jakobs TC, Libby RT, Ben Y, John SW, Masland RH. Retinal ganglion cell degeneration is topological but not cell type specific in DBA/2J mice. J Cell Biol. 2005;171(2):313–325. doi: 10.1083/jcb.200506099. [DOI] [PMC free article] [PubMed] [Google Scholar]
- 25.Inman DM, Sappington RM, Horner PJ, Calkins DJ. Quantitative correlation of optic nerve pathology with ocular pressure and corneal thickness in the DBA/2 mouse model of glaucoma. Invest Ophthalmol Vis Sci. 2006;47(3):986–996. doi: 10.1167/iovs.05-0925. [DOI] [PubMed] [Google Scholar]
- 26.John SW, Smith RS, Savinova OV, et al. Essential iris atrophy, pigment dispersion, and glaucoma in DBA/2J mice. Invest Ophthalmol Vis Sci. 1998;39(6):951–962. [PubMed] [Google Scholar]
- 27.Anderson MG, Smith RS, Savinova OV, et al. Genetic modification of glaucoma associated phenotypes between AKXD-28/Ty and DBA/2J mice. BMC Genet. 2001;2:1. doi: 10.1186/1471-2156-2-1. [DOI] [PMC free article] [PubMed] [Google Scholar]
- 28.Howell GR, Libby RT, Jakobs TC, et al. Axons of retinal ganglion cells are insulted in the optic nerve early in DBA/2J glaucoma. J Cell Biol. 2007;179(7):1523–1537. doi: 10.1083/jcb.200706181. [DOI] [PMC free article] [PubMed] [Google Scholar]
- 29.Saleh M, Nagaraju M, Porciatti V. Longitudinal evaluation of retinal ganglion cell function and IOP in the DBA/2J mouse model of glaucoma. Invest Ophthalmol Vis Sci. 2007;48(10):4564–4572. doi: 10.1167/iovs.07-0483. [DOI] [PMC free article] [PubMed] [Google Scholar]
- 30.Sawada T, Nakamura J, Nishida Y, Kani K, Morikawa S, Inubushi T. Magnetic resonance imaging studies of the volume of the rabbit eye with intravenous mannitol. Curr Eye Res. 2002;25(3):173–177. doi: 10.1076/ceyr.25.3.173.13474. [DOI] [PubMed] [Google Scholar]
- 31.Luan H, Roberts R, Sniegowski M, Goebel DJ, Berkowitz BA. Retinal thickness and subnormal retinal oxygenation response in experimental diabetic retinopathy. Invest Ophthalmol Vis Sci. 2006;47(1):320–328. doi: 10.1167/iovs.05-0272. [DOI] [PubMed] [Google Scholar]
- 32.Liang Z. Longitudinal data analysis using generalized linear models. Biometrika. 1986;73:13–22. [Google Scholar]
- 33.Buckingham BP, Inman DM, Lambert W, et al. Progressive ganglion cell degeneration precedes neuronal loss in a mouse model of glaucoma. J Neurosci. 2008;28(11):2735–2744. doi: 10.1523/JNEUROSCI.4443-07.2008. [DOI] [PMC free article] [PubMed] [Google Scholar]
- 34.Gordon MO, Beiser JA, Brandt JD, et al. The Ocular Hypertension Treatment Study: baseline factors that predict the onset of primary open-angle glaucoma. Arch Ophthalmol. 2002;120(6):714–720. doi: 10.1001/archopht.120.6.714. [DOI] [PubMed] [Google Scholar]
- 35.Tuck MW, Crick RP. Glaucoma detection rate: a useful concept, to be distinguished from accuracy of referral (positive predictive value) Ophthalmic Physiol Opt. 1998;18(6):545–546. doi: 10.1016/s0275-5408(98)00032-5. [DOI] [PubMed] [Google Scholar]
- 36.Yu X, Wadghiri YZ, Sanes DH, Turnbull DH. In vivo auditory brain mapping in mice with Mn-enhanced MRI. Nat Neurosci. 2005;8(7):961–968. doi: 10.1038/nn1477. [DOI] [PMC free article] [PubMed] [Google Scholar]
- 37.Silva AC, Lee JH, Aoki I, Koretsky AP. Manganese-enhanced magnetic resonance imaging (MEMRI): methodological and practical considerations. NMR Biomed. 2004;17(8):532–543. doi: 10.1002/nbm.945. [DOI] [PubMed] [Google Scholar]
- 38.Lindsey JD, Scadeng M, Dubowitz DJ, Crowston JG, Weinreb RN. Magnetic resonance imaging of the visual system in vivo: transsynaptic illumination of V1 and V2 visual cortex. Neuroimage. 2007;34(4):1619–1626. doi: 10.1016/j.neuroimage.2006.07.048. [DOI] [PubMed] [Google Scholar]
- 39.Bearer EL, Falzone TL, Zhang X, Biris O, Rasin A, Jacobs RE. Role of neuronal activity and kinesin on tract tracing by manganese-enhanced MRI (MEMRI) Neuroimage. 2007;37(suppl 1):S37–S46. doi: 10.1016/j.neuroimage.2007.04.053. [DOI] [PMC free article] [PubMed] [Google Scholar]
- 40.Li Q, Timmers AM, Hunter K, Gonzalez-Pola C, et al. Noninvasive imaging by optical coherence tomography to monitor retinal degeneration in the mouse. Invest Ophthalmol Vis Sci. 2001;42(12):2981–2989. [PubMed] [Google Scholar]
- 41.Remtulla S, Hallett PE. A schematic eye for the mouse, and comparisons with the rat. Vision Res. 1985;25(1):21–31. doi: 10.1016/0042-6989(85)90076-8. [DOI] [PubMed] [Google Scholar]
- 42.Kim KH, Puoris’haag M, Maguluri GN, et al. Monitoring mouse retinal degeneration with high-resolution spectral-domain optical coherence tomography. J Vision. 2008;8(1):1–11. doi: 10.1167/8.1.17. [DOI] [PubMed] [Google Scholar]
- 43.Feng L, Sun Z, Han H, Zhou Y, Zhang M. No age-related cell loss in three retinal nuclear layers of the Long-Evans rat. Vis Neurosci. 2007;24(6):799–803. doi: 10.1017/S0952523807070721. [DOI] [PubMed] [Google Scholar]