

Abstract
We have adopted an analysis that produces a post hoc prediction of the time course of electromyogram (EMG) activity from the discharge of ensembles of neurons recorded sequentially from the primary motor cortex (M1) of a monkey. Over several recording sessions, we collected data from 50 M1 neurons and several distal forelimb muscles during a stereotyped precision grip task. Ensemble averages were constructed from 5 to 10 trials for each neuron and EMG signal. We used multiple linear regression on randomly chosen subsets of these neurons to find the best fit between the neuronal and EMG data. The fixed delay between neuronal and EMG signals that yielded the largest coefficient of determination (R2) between predicted and actual EMG was 50 ms. R2 averaged 0.83 for ensembles composed of 15 neurons. If, instead, each neuronal signal was delayed by the time of its peak cross-correlation with the EMG signal, R2 increased to 0.88. Using all 50 neurons, R2 under these conditions averaged nearly 0.97. A similar analysis was conducted with signals recorded during both a power grip and a precision grip task. Quality of the fit dropped dramatically when parameters from the precision grip for a given set of neurons were used to fit data recorded during the power grip. However, when a single set of regression parameters was used to fit a combination of the two tasks, the quality of the fits decreased by <10% from that of a single task.
INTRODUCTION
Single neuron recording methods applied to behaving animals have contributed dramatically to our understanding of the limb movement–related signals present in the CNS. Despite this success, however, recording neurons one at a time affords the smallest of windows through which to observe command signals that are encoded across tens or hundreds of thousands of neurons.
Nearly 20 years ago, Georgopoulos and his colleagues published a now classic study in which they demonstrated that the discharge of ensembles of neurons recorded sequentially in the primary motor cortex (M1) during a highly stereotypic task could be used to make a post hoc “prediction” of the direction of hand motion (Georgopoulos et al. 1983). Since that time, many other studies have been published using similar methods to explore the nature of population coding of motor command signals (Caminiti et al. 1990; Fu et al. 1993; Kalaska et al. 1989; Moran and Schwartz 1999; Scott and Kalaska 1997; Shen and Alexander 1997; Taira et al. 1996).
Although many of these experimental studies have concluded that M1 signals encode movement in a hand-centered coordinate system, several theoretical studies have shown that the directional modulation of M1 discharge may arise from a system that fundamentally controls muscle activation (Mussa-Ivaldi 1988; Todorov 2000). While many studies have used spike-triggered averaging of electromyogram (EMG) activity to study putative connections between individual M1 neurons and muscles, relatively few have examined the correlation between the modulation of neurons in M1 and muscle activity. Most of those analyses have considered only individual neurons and often very limited numbers of muscles. To our knowledge there has been only one related attempt to study the encoding of muscle activity by the discharge of ensembles of neurons (Fetz et al. 1989).
Because of the greater noise and complexity of the EMG time course, fitting neuronal ensemble discharge to EMG activity would seem to pose a greater challenge than that of fitting kinematic signals. However, the variety of anatomical and theoretical evidence consistent with a muscle-like organization of M1 offers compelling reasons to investigate this alternative possibility more systematically than has been done previously. This approach is also advantageous in that it provides the ability to study control issues at the single muscle level and to apply identical methods across a wide range of behaviors.
We have adopted methods similar to those of Georgopoulos, whereby linear combinations of as many as 50 sequentially recorded neurons were used to “predict” the time course of muscle activity during a stereotypic precision grip task. With an ensemble of just 15 neurons chosen randomly from the full set, the activity of four different muscles was fit with an average R2 of 0.88, indicating that neurons in M1 do provide a considerable amount of information related to muscle activity. These methods have allowed us to address the question of the relative timing between neuronal discharge and muscle activity throughout movement, as well as the effect of neuronal ensemble size on the quality of the fit to the EMG signals. To the extent that the methods allow, we have also studied the time and task dependence of the relations between neuronal and EMG signals.
METHODS
Task and data collection
These data were recorded from a single monkey (Macaca nemestrina) during execution of a stereotypic precision grip task. The monkey was seated in a standard primate chair with its right hand loosely restrained. The left hand was used to reach toward a small Plexiglas device with a 13-mm-thick vertical bar instrumented with two force-sensitive resistors. The bar could only be gripped by apposition of thumb and index finger, which were inserted into 16-mm-wide slots parallel to the bar. A single trial began with the left hand on a touch pad at waist level. Following a 1-s touch pad hold time, an LED in the center of the bar was illuminated, instructing the monkey to grip the device. After a random hold time ranging from 500 to 1,500 ms, a tone indicated success and the monkey was given a juice reward and could return its hand to the touch pad to initiate the next trial following a random intertrial interval. Figure 1 shows a series of three of these trials, including several EMG signals, grip force, and several logical signals indicating the state of the devices. The monkey typically operated the precision grip device in alternate blocks with several other similar devices, each requiring different use of the hand.
Fig. 1.

Signals measured during several repetitions of the precision grip task. The first seven traces are raw electromyogram (EMG) signals recorded from epimysial electrodes chronically implanted on several muscles of the arm and hand. Below these are uncalibrated force records representing the thumb and index finger. Finally, several logical signals, indicating presence of the monkey’s hand on the touch pad, illumination of the cue LED, and the onset of grip force.
Neuronal discharge signals were measured with platinum/iridium electrodes. In each session, movements evoked by trains of intracortical microstimulation and stimulus- triggered averaging of EMG were used to identify the function of the particular area. Across sessions, neurons were recorded from areas spanning the proximal arm and hand areas, with a bias toward the more distal areas. The signals were band-pass filtered (300–10,000 Hz) and amplified (10,000×). The shapes of individual action potentials were identified using a digital signal processor (DSP)-based discrimination system (Plexon, Dallas, TX) and the times of occurrence were saved with 100 μs precision. No more than two neurons were discriminated simultaneously from the electrode signal. The touch pad was instrumented with a microswitch, and the times of its transitions were saved with 10 ms precision. EMG signals were band-pass filtered (130–1,200 Hz), amplified, and sampled at 2,000 samples/s. The signal from the force sensors was sampled at the same rate.
Surgery
Following training, a stainless-steel chamber was implanted above the primary motor cortex, along with a halo-type head restraint. EMG leads were implanted subcutaneously on 23 arm and hand muscles, with leads routed to a connector implanted in the monkey’s back (Miller et al. 1993). All animal-related procedures were approved by the institutional animal care and use committee at Northwestern University.
Analysis
Figure 1 shows raw EMG signals from 7 of the 23 muscles that were implanted in this monkey, to give some sense of the repeatability of the muscle activation. Because most of the neurons were recorded in a portion of M1 representing the distal limb and hand, we selected a smaller group of 4 distal muscles (1st dorsal interosseous, flexor pollicis brevis, flexor carpi radialis, and pronator teres) for this analysis based on the variety in the temporal patterns of modulation they represented.
Fifty neurons were used for the analysis, the only conditions being that they were recorded from the distal limb area of M1 and discharged during the task. Perievent histograms were calculated from the spike train data by aligning the responses during each trial to the falling edge of the touch pad signal, which indicated the onset of reach. Because of the variable minimum hold time, as well as variations in the monkey’s reaction time, the hold period actually varied from about 750 to over 2,000 ms. Consequently, to obtain more nearly stereotypic behavior, only those trials in which the hold time was between 1.25 and 1.5 s were considered. For a given data file, this typically included 5–10 trials. The histograms were low-pass filtered (20 Hz; 4 poles) to extract the modulation envelope of the activity and normalized to an arbitrary peak of 100. These neurons had a broad range of patterns of activity, which are depicted in Fig. 2.
Fig. 2.
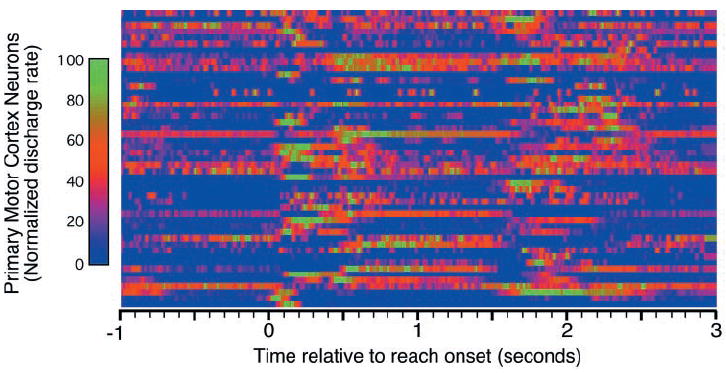
Ensemble averages of the discharge of 50 neurons during the task shown in Fig 1. Only trials having a hold time between 1.25 and 1.5 s were included in these averages, which typically included 5–10 trials. All trials were aligned to the time at which the touch pad signal went low. The average waveforms were normalized to an arbitrary peak value of 100.
EMG signals from a single, representative data file were full-wave rectified and filtered. Ensemble averages were calculated that were analogous to the neuronal perievent histograms. EMG signals in all later figures show these ensemble averages, rather than individual trials. The shapes of EMG averages for all the files were quite consistent, particularly for pronator teres, flexor pollicis brevis, and 1st dorsal interosseous. The ratio of the two peaks in flexor carpi radialis varied somewhat from day to day, as did the intensity of the activity following the grip (approximately 2 s after reach) for pronator and flexor carpi radialis.
Each regression analysis was run using a subset of n neurons (3 ≤ n ≤ 50) selected randomly and without replacement from the full set of 50 neurons. The analysis found weighting coefficients for each neuron in the ensemble, plus an offset term, that together best modeled the time course for each EMG. Two methods were used to deal with the unknown time lag between neuronal and EMG modulation. One approach was to assume a single, fixed lag for all neurons. All neuronal discharge signals were shifted by this amount, which was systematically varied through a range of ±500 ms. Equation 1 describes the regression equation that was fit under this condition, where M̂(t) is the predicted time course of the EMG signal, and Ni is the ith of n neuronal discharge signals, delayed by an amount Δt, and Bi is the corresponding weighting coefficient
A more complicated approach that allowed more flexibility in timing without actually increasing the number of unknowns in the model was also attempted. We first calculated the cross-correlation between each neuron/EMG pair. The time of the peak of this correlation indicates the time lag for which there was the greatest similarity between the signals. Consequently, the regression equation was modified accordingly, and the neuronal signal of each pair was delayed by an amount Δti corresponding to the time of the peak cross-correlation
For simplicity, we describe this as the “optimal” delay. Using the selected delays and regression coefficients, a “predicted EMG signal” was constructed from the neuronal ensemble for each muscle. The quality of this prediction was evaluated by calculating the linear coefficient of determination (R2) between the prediction and the actual EMG signal. As a final summary, a grand average R2 across all four muscles was determined. Finally, several methods were used to “cross-validate” the results for a given set of neurons, by applying the regression parameters determined from one set of signals to another set collected independently.
RESULTS
Effects of different delays between neuronal discharge and muscle activation
The typical delay between the bursts of neuronal and muscle activity at the onset of limb movement is 50–100 ms, although this number can vary quite substantially across neurons. As described above, we used two different methods to estimate this delay. Fifty different randomly chosen ensembles of 15 neurons were used in the first analysis, which included 41 different delays (made in 25-ms steps ranging from −500 to 500 ms) for each ensemble. The average R2 was determined across these 50 sets of neurons, for all four muscles, and is shown in Fig. 3A as a function of the imposed delay. The effect of the delays on the quality of fit was approximately symmetrical, centered around a delay of 50 ms, at which point the average R2 was 0.83. The quality of the fits fell off quite rapidly for delays within about 200 ms of this optimum and then leveled off until reaching delays of nearly ±500 ms. Figure 3B–D show representative fits for various fixed delays. In this and all subsequent examples, the actual EMG signals are plotted with a thick line, and the “predicted” EMGs are plotted with a thin line. Because the particular neurons in any given ensemble were selected randomly, R2 for a particular delay varied across ensembles. The particular ensembles used for the examples in this and subsequent figures were chosen with the condition that the R2 averaged across the four muscles was approximately equal to the grand average across all 50 different neuronal ensembles shown in Fig. 3A.
Fig. 3.
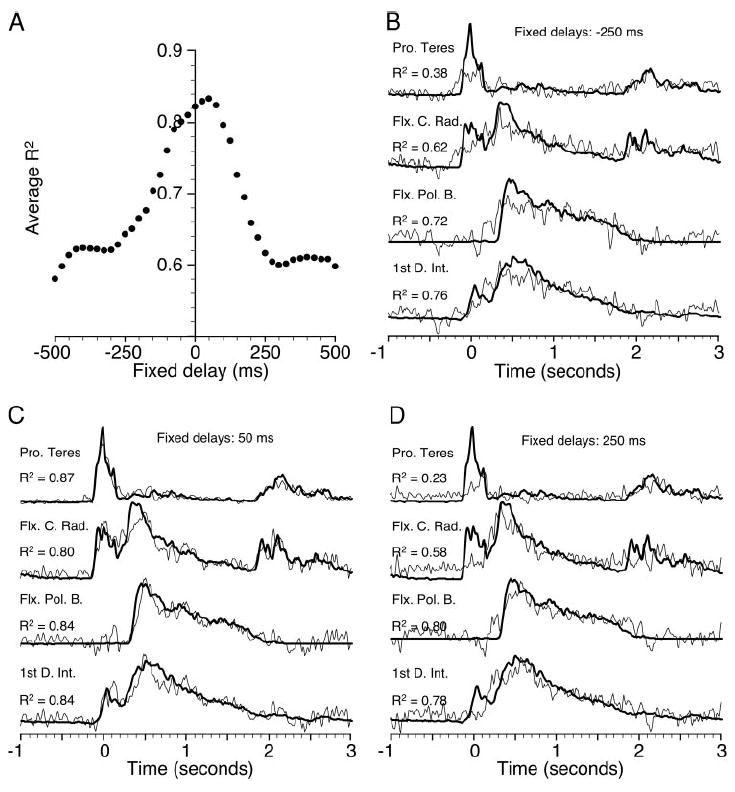
A: results for fixed delays of ±500 ms in steps of 25 ms. Fifty different ensembles were tested at each delay. Each point in A indicates a grand average of the coefficient of determination (R2) across all 50 tests and 4 muscles. The best overall fits were obtained with a delay of 50 ms. B–D: thick lines are rectified, filtered, and ensemble averaged EMG signals, analogous to the neuronal discharge averages shown in Fig. 2. Thin lines are representative examples of “predicted” EMG signals, computed from randomly chosen ensembles of 15 neurons using the fixed delays of Eq. 1. Pro. Teres, pronator teres; Flx C. Rad., flexor carpi radialis; Flx. Pol. B., flexor pollicis brevis; 1st D. Int, 1st dorsal interosseous.
The analysis depicted in Fig. 3A used a single delay for each neuron, although, as noted above, the timing at the onset of movement can be quite varied across neurons. Consequently, we also attempted to find an optimal delay for each neuron/muscle pair as described under methods. By varying the width of the cross-correlation function, the range of possible delays could be adjusted. Figure 4 illustrates the effects of changing the cross-correlation width. The filled circles in Fig. 4A show the average R2 obtained for 50 random ensembles of 15 neurons as the width of the cross-correlation window was increased (while centered at 50 ms). The broadest cross-correlations had a half-width of 500 ms and thus encompassed a range of possible delays from −450 to 550 ms. The open circles resulted from windows that were restricted to only positive delay values. In either case, the points at zero width correspond to the data point at fixed delay 50 ms in Fig. 3A. The R2 values for the filled and open circles a + 0 ms differed slightly in magnitude, since the random sets of neurons were different for the two analyses. The point at 25-ms half-width indicates that the average fit improved slightly, by about 0.02, when the cross-correlation function was used to find optimal delays within a range of 25 to 75 ms (50 ± 25 ms). The fits continued to improve for widths out to 50 ± 100 ms, at which point they abruptly leveled off and actually began to decrease slightly, only regaining the same quality for relatively broad window widths. It was only at the very broadest widths that the addition of negative delays offered a significant (though slight and variable) improvement over the positive-only delays. Selecting optimal, positive delays for each neuron/EMG pair improved the average quality of the fits by 6%, from 0.83 to 0.88, over the fits obtained with a fixed, 50-ms delay. Figure 4B illustrates representative fits using 15 neurons and optimal delays of 0–150 ms.
Fig. 4.
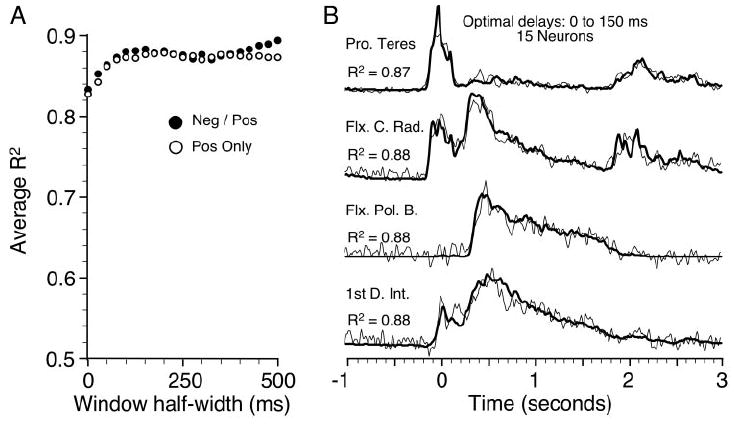
A: grand average R2 resulting from Eq. 2, using the cross-correlation to determine “optimal” delays for each neuron/muscle pair. Abscissa shows the half-width of the cross-correlation, which was centered on 50 ms, the best fixed delay. Open circles included only positive delays. B: representative example of fit provided by 15 neurons and optimal delays from 0 to 150 ms.
Effect of different numbers of neurons on the quality of EMG prediction
We also investigated the quality of fits for neuronal ensembles ranging in size from 3 to 50 neurons. The peak cross-correlation was used to determine optimal delays within a range of 0–150 ms. These results are summarized in Fig. 5A, which shows the average R2 plotted as a function of neuronal ensemble size for 50 different ensembles. Ensembles containing fewer than 7 or 8 neurons yielded quite variable results, since they were particularly dependent on the ensemble containing a small number of well-correlated neurons. On the other hand, the relation saturated rather quickly, with relatively little improvement beyond 20–25 neurons. In part this was true because there were few independent ensembles of this size that could be selected from the 50 neurons. However, the fact that the relation saturated at nearly 0.97 indicates that there was little room for improvement.
Fig. 5.
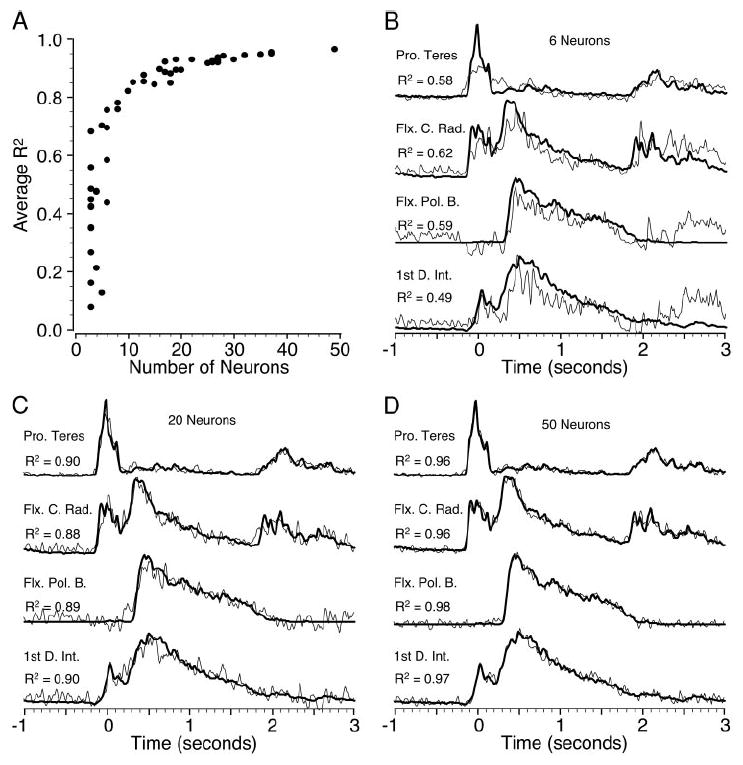
A: grand average R2 resulting from optimal delays of 0–150 ms and randomly chosen ensembles of 3 to 50 neurons. B–D: examples in the format described for earlier figures.
Figure 5B–D shows representative examples of measured and predicted EMG for several different ensemble sizes. It is interesting to note that even with only 6 (Fig. 5B) neurons, most of the major features were reasonably well represented, including both peaks in the flexor carpi radialis example. This contrasts with the examples in Fig. 3, B and D, in which only one of the two peaks could be fit by 15 neurons when the imposed delay was substantially nonoptimal. Increasing the size of the ensemble, particularly above 15 neurons, seemed mostly to reduce the higher frequency noise of the estimate, perhaps simply by virtue of averaging together an increasingly large number of neurons with similar underlying modulation. The fit with all 50 neurons is remarkable in its fidelity to each of the four different EMG waveforms.
Among the 50 neurons, there was a small number that, by themselves, contributed a large R2 for a particular muscle. Because the likelihood of having at least one of these neurons increased with increasing ensemble size, this factor alone could have accounted for much of the increase in total R2 with increasing ensemble size. Figure 6A shows the distribution of R2 for all 200 neuron/EMG pairs, using the optimal timing between 0 and 150 ms for each pair. Nearly 75% of the individual pairs had R2 < 0.20, and the average R2 was only 0.16. However, the total R2 of an ensemble of neurons must be at least as large as the R2 due to the single, best predictor neuron. The open circles in Fig. 6B show the average R2 that would have resulted from just the single neuron within an ensemble of n neurons that would have provided the best fit to all four muscles. The relation saturates above 10–15 neurons, reaching a maximum of approximately 0.6. The filled circles represent the total R2 value as a function of neuronal ensemble size, taken from Fig. 5A. Hence, information from multiple neurons typically increased the quality of the average fit by approximately 50% over that of the best single neuron.
Fig. 6.
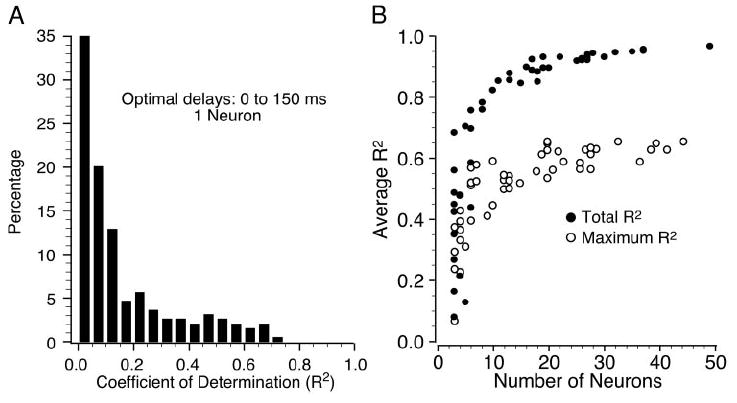
A: distribution of R2 resulting from all 200 single neuron/muscle pairs, using an optimal delay between 0 and 150 ms. B: comparison of the R2 from the single best neuron in each ensemble, averaged across all four muscles (open circles) and the total R2 from all neurons (filled circles; taken from Fig. 5A) for increasing ensemble size. The former relation increased with increasing ensemble size because of the greater probability of finding at least one well-correlated neuron, but it remained well below the total R2 values.
Behavior-related effects on the quality of EMG prediction
The examples illustrated thus far have entailed fitting neuronal discharge data to EMG signals recorded only during the precision grip task. We also constructed a set of EMG ensemble averages and neuronal discharge histograms during a power grip task. We were able to obtain power grip data for 38 of 50 neurons. The task resembled that of the precision grip, except the monkey was required to grasp a 1.9-cm-diam cylinder oriented horizontally and parallel to the monkey’s frontal plane. Because the monkey tended to grip for a longer period of time than during the precision grip task, we used trials having a hold time between 1.4 and 1.65 s. The power grip data yielded approximately the same quality of fits as did the precision grip when the calculations were done as described above.
Figure 7A summarizes a series of cross-validation tests in which regression parameters were calculated for the data collected during the precision grip task, but used to predict the EMG modulation during the power grip task. Filled circles are analogous to the results shown previously in Fig. 5A, although the neurons were drawn from the smaller subset of 38. The open circles indicate the fits that resulted from the prediction of power grip EMGs, using neurons recorded during the power grip but with the regression parameters derived from the precision grip analysis. One hundred additional repetitions of 15-neuron ensembles were analyzed similarly. Among these, the variance accounted for by the cross-validation power fits was 38% of the precision grip fits. The dashed line at the bottom of Fig. 7A indicates the mean R2 that resulted from 100 tests in which the regression parameters were chosen randomly, from within the range of the actual values. These fits did not improve with increasing ensemble size. The difference between the mean of the random group and the 15-neuron cross-validations was highly significant (P < 0.0001; Wilcoxon rank sum). Figure 7B shows a representative fit from the cross-validation analysis. Note that the fit was particularly bad at the end of the hold periods (approximately 2 s after reach) when the behavior was most variable.
Fig. 7.
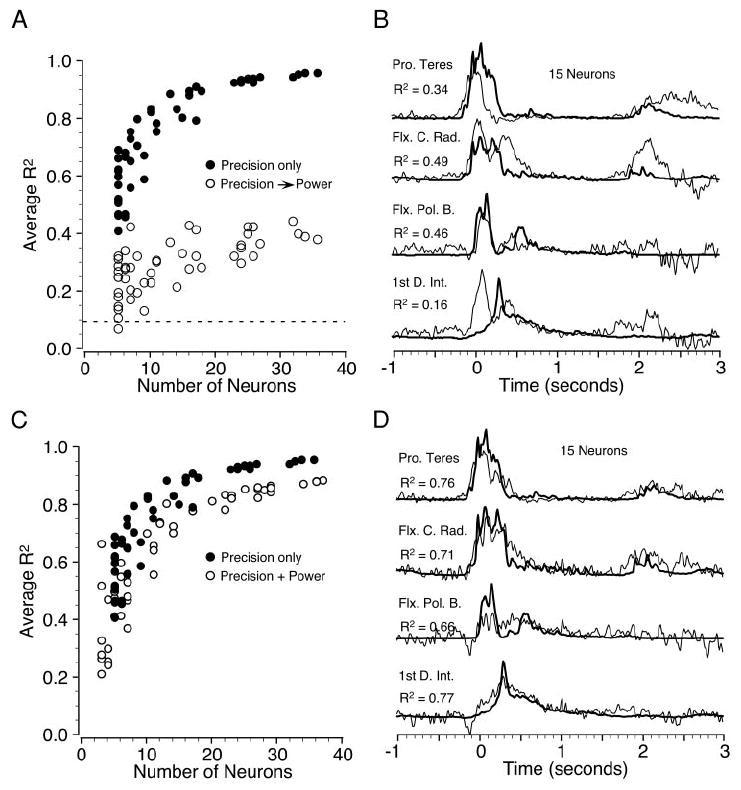
Comparison of the quality of fit for a subset of 38 neurons that were tested on both precision grip and power grip tasks. A: precision grip alone (filled circles) and cross-validation using precision grip parameters to predict power grip signals (open circles). B: precision/power grip cross-validation example for a 15-neuron ensemble. Note the difference in the time course of these signals from those shown earlier. C: precision grip alone (filled circles; same as Fig. 7A) and fits to the combined precision-plus-power behavior (open circles). D: a single example representative of the precision-plus-power fit showing only the power grip segment. The R2 values were averaged across both tasks.
In addition to calculating regression parameters for the precision and power grip individually, an analysis that included 4-s segments from both types of grip was conducted. These results are shown by the open circles in Fig. 7C. The filled circles are the same as those shown in Fig. 7A. The quality of the combined fits was somewhat lower than those for a single task, but still remained quite high, particularly for the larger ensembles. The relation between R2 and ensemble size rose more slowly for the combined behaviors, continuing to approach the precision-only curve even for the largest ensembles. Figure 7D shows one example of the power grip segment from this analysis using an ensemble of 15 neurons. Despite the different time course of muscle activation across the two tasks, the major features in both (precision grip not shown) were fit reasonably well.
The robustness of these fits was further tested by dividing each original precision grip data file into two equal-length segments. EMG ensemble averages and neuronal discharge histograms were constructed from each half, and a cross-validation analysis was performed. Because of the more limited number of trials under these conditions, there was no restriction imposed on the hold time. The filled circles in Fig. 8A show the average R2 values for this analysis that are analogous to those of Fig. 5A. The open circles indicate the R2 values from the cross-validation analysis. For relatively small ensembles, the resultant R2 values were widely scattered and broadly overlapping across conditions. However, for ensembles above about 15 neurons, there was a fairly consistent, roughly 10% difference between the two approaches. A single, representative example with 45 neurons is shown in Fig. 8B. The major features of the EMG continued to be well captured by this approach, but there were now small errors in the magnitude and timing of the fits in addition to what appears to be high-frequency noise.
Fig. 8.
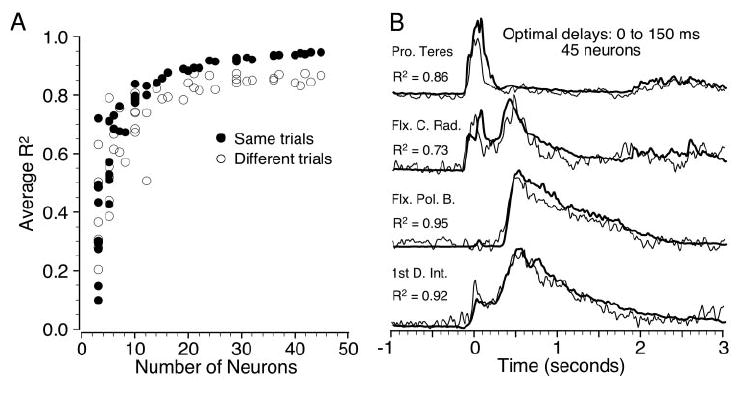
A: cross-validation analysis for the precision grip task using ensemble averages calculated from trials in the first and second halves of each data file. Filled circles are analogous to the results of Fig. 5A, computed using trials from the first half of each file, and regression parameters calculated from the same trials. Open circles were computed from trials of the second half of each file, using regression parameters determined from the first half of each file. B: cross-validation example using 45 neurons.
DISCUSSION
This paper describes a novel attempt to model the encoding of muscle activation signals by ensembles of M1 neurons. The approach takes advantage of the stereotypic nature of the task, and the strong time invariance of M1 neurons (Morrow et al. 2001). The time course of EMG signals is reconstructed using linear combinations of the discharge of sequentially recorded neurons. While this approach is fundamentally limited to addressing the ensemble averaged time course of these neuronal and muscle signals, it offers important new insights. Most importantly, the results demonstrate that a relatively modest number of neurons in M1 is potentially capable of providing enough information to reconstruct the modulation envelope of limb EMG signals with remarkable accuracy.
Strength of the relation between neuronal discharge and muscle activity
The high quality of the regression fits for data recorded sequentially from 30 or more neurons during a single behavioral condition was unanticipated. It is reasonable to assume that similar calculations made from 30 simultaneously recorded neurons would yield even better fits. More complex behaviors, such as that represented by the combination of precision and power grasps, were also fitted quite well. The asymptotic performance for precision and power grasp was only about 10% below that of the precision alone. However, it is also important to note that the quality of the precision-plus-power fit for 30 neurons was approximately equaled in the precision-only data using half as many neurons. If this relation were to hold true for increasingly complex behaviors, the number of required neurons might be considerably increased to achieve high-quality fits.
Given the results of Figs. 7 and 8, it is clear that cross-validating a data set using regression parameters from a related but different behavior will yield significantly weaker fits. Such fits are likely to become progressively worse with increasing difference between the behaviors represented by the two data sets. It is worth noting that, even if the underlying encoding system in M1 is one of muscle activity, one would not necessarily expect the parameters fitted exclusively during one behavior to predict an entirely different behavior satisfactorily. The motor system is highly redundant, having several orders of magnitude more neurons than even motor units. This is well illustrated by the fact that many different combinations of neurons in this study yielded essentially equivalent fits to a given EMG waveform.
Even if these neurons do all express a muscle activation code, there may well be subsets of neurons that are activated only under particular conditions and not others. A task preference of this sort has been noted for power and pinch grip (Muir and Lemon 1983). It has also been suggested that certain M1 neurons are preferentially activated during tasks requiring coactivation and others during reciprocal activation of antagonists (Humphrey and Reed 1983). If this were the case, it would be necessary to sample across the full set of such tasks to represent the behavior of the full ensemble of neurons adequately. Having done so, it might be possible to predict the full range of muscle activation from a single set of regression parameters. The performance of such a system might then resemble that illustrated by Fig. 7, C and D, in which a single set of parameters was fit to a combination of two distinct behaviors.
Timing of the relation between M1 discharge and muscle activity
The timing of the onset of activity in M1 relative to that in muscles has long been a puzzle, since it typically is much longer than the 5- to 10-ms delay that would be expected from estimates of conduction times or from the onset of postspike facilitation (McKiernan et al. 1998). Estimates across cells vary quite widely, but for cases in which the neuronal discharge is strongly related to a particular movement, the latency at movement onset is typically 50–75 ms (Cheney and Fetz 1980). One explanation for this discrepancy is the possible need to overcome a threshold nonlinearity in the spinal cord, which could add a significant delay between the onset of the descending command and the beginning of muscle activation. If this were the case, one would expect that, later in the movement, once this threshold had been surpassed, EMG modulation would be delayed from neuronal modulation by only the amount of the conduction time.
The results of this study suggest otherwise. Although very good fits were obtained with delays of 0–25 ms, somewhat better fits were obtained with delays of 50 ms. This magnitude of delay is nearly the same as the mean lag time reported earlier for highly significant cross-correlations between magnocellular red nucleus (RNm) discharge and forelimb EMG (Miller et al. 1993). It is difficult to explain this result if delays of this magnitude were present only at the onset of movement. An alternative mechanism has been proposed that might cause such delays throughout movement, rather than just at the outset. Persistent inward currents in motor neurons have been shown to cause long-lasting plateau potentials that vary in amplitude proportionately with injected current across a fairly broad range of current strength (Carlin et al. 2000; Lee and Heckman 1998). The time course of these dendritic currents is rather slow, on the order of 50–100 ms. It is thought that they may act like low-pass–filtered amplifiers, producing currents in response to, but delayed from and significantly larger than, synaptic currents (C. J. Heckman, personal communication).
The “optimal” method of selecting delays differs in an important respect from that of including an unknown delay for each neuron in the regression equation. Because the optimal delay is chosen independently for each pair, a burst from one neuron could not have been used to “fill in” a missing phasic portion of an EMG, except at the particular lag that provided the best overall fit to the EMG. This is important, since otherwise a set of simple pulses at various delays could be used to fit almost any arbitrary waveform. On the other hand, if individual M1 neurons do contribute only particular features of a given EMG waveform, this method may yield inappropriate delay times. This may be the explanation for the unexpected slight decrease in quality of fit that occurred for increasingly large delay windows between 150- and 300-ms half-width (Fig. 4A). A neuron that actually contributed only a simple pulse of activation to a more complex EMG waveform may have been shifted several hundred milliseconds from its appropriate alignment to achieve the optimal alignment with the entire EMG. A narrower window would limit this effect and thereby tend to improve the overall fit.
Some neurons had their peak correlations at a negative delay, that is, with neuronal discharge lagging EMG. Indeed, because of their width, most neuron/EMG cross-correlations that peaked in the 0- to 150-ms range remained significant for negative delays. Similar results were reported earlier for RNm (Miller and Sinkjaer 1998; Soechting et al. 1978). It is likely that many of these long-lag correlations result only indirectly as a result of behavior-related correlations among muscles. Perhaps as a consequence, consideration of these negative delays in the current study caused essentially no improvement in the quality of fits, except when rather long, nonphysiological delays were considered.
Comparison with other studies
Several studies have examined the relation between the magnitude of the peak or mean motor cortical discharge and a similar aspect of muscle activity (Lamarre et al. 1981; Maier et al. 1993; Thach 1978). Others have examined the correlation or coherence between EMG signals and either the discharge of single neurons (Holdefer and Miller 2002; McKiernan et al. 2000; Schwartz and Adams 1995), local field potentials (Baker et al. 1999), or electroencephalographic signals (Halliday et al. 1998; Mima et al. 2000). However, to the best of our knowledge, there has been only one other study that attempted to account for the time course of EMG modulation on the basis of the discharge of multiple neurons (Fetz et al. 1989). That approach was similar to ours, in the sense that perievent histograms were constructed to represent the “typical” behavior of M1 neurons recorded sequentially during a simple wrist flexion task. That analysis was restricted to cells causing postspike facilitation in at least one of several target muscles. Seven representative discharge profiles were identified among the histograms, which were summed in proportion to the relative frequency with which each was seen. An analogous histogram from the responses of several muscles that were coactive in the task was also calculated. The resultant neuronal and EMG histograms bore a reasonable resemblance to one another, but each lacked most of the distinctive features present in the ensemble averages of individual neurons or muscles used in this study.
Unlike the case for EMG, there have been several efforts to predict kinematic parameters from simultaneously recorded neurons. In the earliest, linear combinations of as many as 5 simultaneously recorded neurons were used to predict the force, displacement, or speed of wrist rotation (Humphrey et al. 1970). Quite recently, using improved methods to implant chronic arrays of electrodes, 30 or more simultaneously recorded neurons have been used to predict movement of the hand or joint rotation (Serruya et al. 2002; Taylor et al. 2002; Wessberg et al. 2000). Application of similar methods to EMG signals should certainly be pursued.
We have demonstrated that a small number of neurons recorded in the primary motor cortex contain sufficient information to reconstruct the time course of averaged muscle activity with considerable precision. We do not mean to suggest that a given ensemble of M1 neurons encodes the activity of individual muscles. Rather, there is evidence that individual M1 neurons relate best to functional groups of muscles (Holdefer and Miller 2002), and it is likely that larger ensembles of neurons also relate in a more complex fashion to groups of muscles.
These observations cannot be considered evidence that all M1 neurons carry a muscle-like code. As outlined above, there is ample evidence of significant correlations with kinematic signals as well. Behavioral and analytical differences among the different studies make a direct comparison difficult. However, the cross-correlation and multiple regression methods that we have been developing may be applied to both EMG and kinematic signals. The invariance of these relations across tasks as well as over relatively long periods of time are two important issues that should be pursued. It would also be possible to test whether individual neurons encode the dynamics of the full motor command, or just particular features. Such methods would also invite the application of more sophisticated signal analysis, including the calculation of multiple input, nonlinear filters, and information theoretic approaches.
Acknowledgments
This work was supported by National Institute of Neurological Disorders and Stroke Grant NS-36976.
References
- Baker SN, Kilner JM, Pinches EM, Lemon RN. The role of synchrony and oscillations in the motor output. Exp Brain Res. 1999;128:109–117. doi: 10.1007/s002210050825. [DOI] [PubMed] [Google Scholar]
- Caminiti R, Johnson PB, Urbano A. Making arm movements within different parts of space: dynamic aspects in the primate motor cortex. J Neurosci. 1990;10:2039–2058. doi: 10.1523/JNEUROSCI.10-07-02039.1990. [DOI] [PMC free article] [PubMed] [Google Scholar]
- Carlin KP, Jones KE, Jiang Z, Jordan LM, Brownstone RM. Dendritic L-type calcium currents in mouse spinal motoneurons: implications for bistability. Eur J Neurosci. 2000;12:1635–1646. doi: 10.1046/j.1460-9568.2000.00055.x. [DOI] [PubMed] [Google Scholar]
- Cheney PD, Fetz EE. Functional classes of primate corticomotorneuronal cells and their relation to active force. J Neurophysiol. 1980;44:773–791. doi: 10.1152/jn.1980.44.4.773. [DOI] [PubMed] [Google Scholar]
- Fetz EE, Cheney PD, Mewes K, Palmer S. Control of forelimb muscle activity by populations of corticomotoneuronal and rubromotoneuronal cells. In: Allum JHJ, Hulliger M, editors. Progress in Brain Research: Afferent Control of Posture and Locomotion. Amsterdam: Elvsevier Science; 1989. pp. 437–449. [DOI] [PubMed] [Google Scholar]
- Fu QG, Suarez JI, Ebner TJ. Neuronal specification of direction and distance during reaching movements in the superior precentral premotor area and primary motor cortex of monkeys. J Neurophysiol. 1993;70:2097–2116. doi: 10.1152/jn.1993.70.5.2097. [DOI] [PubMed] [Google Scholar]
- Georgopoulos AP, Caminiti R, Kalaska JF, Massey JT. Spatial coding of movement: a hypothesis concerning the coding of movement direction by motor cortical populations. Exp Brain Res. 1983;Suppl 7:327–336. [Google Scholar]
- Halliday DM, Conway BA, Farmer SF, Rosenberg JR. Using electroencephalography to study functional coupling between cortical activity and electromyograms during voluntary contractions in humans. Neurosci Lett. 1998;241:5–8. doi: 10.1016/s0304-3940(97)00964-6. [DOI] [PubMed] [Google Scholar]
- Holdefer RN, Miller LE. Primary motor cortical neurons encode functional muscle synergies. Exp Brain Res. 2002;146:233–243. doi: 10.1007/s00221-002-1166-x. [DOI] [PubMed] [Google Scholar]
- Humphrey DR, Reed DJ. Separate cortical systems for control of joint movement and joint stiffness: reciprocal activation and coactivation of antagonist muscles. In: Desmedt JE, editor. Motor Control Mechanisms in Health and Disease. New York: Raven; 1983. pp. 347–372. [PubMed] [Google Scholar]
- Humphrey DR, Schmidt EM, Thompson WD. Predicting measures of motor performance from multiple cortical spike trains. Science. 1970;170:758–761. doi: 10.1126/science.170.3959.758. [DOI] [PubMed] [Google Scholar]
- Kalaska JF, Cohon DAD, Hyde ML, Prud’homme M. A comparison of movement direction-related versus load direction-related activity in primate motor cortex, using a two-dimensional reaching task. J Neurosci. 1989;9:2080–2102. doi: 10.1523/JNEUROSCI.09-06-02080.1989. [DOI] [PMC free article] [PubMed] [Google Scholar]
- Lamarre Y, Spidalieri G, Lund JP. Patterns of muscular and motor cortical activity during a simple arm movement in the monkey. Can J Physiol Pharmacol. 1981;59:748–756. doi: 10.1139/y81-111. [DOI] [PubMed] [Google Scholar]
- Lee RH, Heckman CJ. Bistability in spinal motoneurons in vivo: systematic variations in persistent inward currents. J Neurophysiol. 1998;80:583–593. doi: 10.1152/jn.1998.80.2.583. [DOI] [PubMed] [Google Scholar]
- Maier MA, Bennett KMB, Hepp-Reymond MC, Lemon RN. Contribution of the monkey corticomotoneuronal system to the control of force in precision grip. J Neurophysiol. 1993;69:772–785. doi: 10.1152/jn.1993.69.3.772. [DOI] [PubMed] [Google Scholar]
- McKiernan BJ, Marcario JK, Karrer JH, Cheney PD. Corticomotoneuronal postspike effects in shoulder, elbow, wrist, digit, and intrinsic hand muscles during a reach and prehension task. J Neurophysiol. 1998;80:1961–1980. doi: 10.1152/jn.1998.80.4.1961. [DOI] [PubMed] [Google Scholar]
- McKiernan BJ, Marcario JK, Karrer JH, Cheney PD. Correlations between corticomotoneuronal (CM) cell postspike effects and cell-target muscle covariation. J Neurophysiol. 2000;83:99–115. doi: 10.1152/jn.2000.83.1.99. [DOI] [PubMed] [Google Scholar]
- Miller LE, Sinkjaer T. Primate red nucleus discharge encodes the dynamics of limb muscle activity. J Neurophysiol. 1998;80:59–70. doi: 10.1152/jn.1998.80.1.59. [DOI] [PubMed] [Google Scholar]
- Miller LE, van Kan PLE, Sinkjaer T, Andersen T, Harris GD, Houk JC. Correlation of primate red nucleus discharge with muscle activity during free-form arm movements. J Physiol. 1993;469:213–243. doi: 10.1113/jphysiol.1993.sp019812. [DOI] [PMC free article] [PubMed] [Google Scholar]
- Mima T, Steger J, Schulman AE, Gerloff C, Hallett M. Electroencephalographic measurement of motor cortex control of muscle activity in humans. Clin Neurophysiol. 2000;111:326–337. doi: 10.1016/s1388-2457(99)00229-1. [DOI] [PubMed] [Google Scholar]
- Moran DW, Schwartz AB. Motor cortical representation of speed and direction during reaching. J Neurophysiol. 1999;82:2676–2692. doi: 10.1152/jn.1999.82.5.2676. [DOI] [PubMed] [Google Scholar]
- Morrow MM, Holdefer RN, Miller LE. Cluster analysis of the functional muscle synergies encoded by M1 discharge. Soc Neurosci Abstr. 2001;27:289.13. [Google Scholar]
- Muir RB, Lemon RN. Corticospinal neurons with a special role in precision grip. Brain Res. 1983;261:312–316. doi: 10.1016/0006-8993(83)90635-2. [DOI] [PubMed] [Google Scholar]
- Mussa-Ivaldi FA. Do neurons in the motor cortex encode movement direction? An alternative hypothesis. Neurosci Lett. 1988;91:106–111. doi: 10.1016/0304-3940(88)90257-1. [DOI] [PubMed] [Google Scholar]
- Schwartz AB, Adams JL. A method for detecting the time course of correlation between single-unit activity and EMG during a behavioral task. J Neurosci Methods. 1995;58:127–141. doi: 10.1016/0165-0270(94)00167-f. [DOI] [PubMed] [Google Scholar]
- Scott SH, Kalaska JF. Reaching movements with similar hand paths but different arm orientations. I. Activity of individual cells in motor cortex. J Neurophysiol. 1997;77:826–852. doi: 10.1152/jn.1997.77.2.826. [DOI] [PubMed] [Google Scholar]
- Serruya MD, Hatsopoulos NG, Paninski L, Fellows MR, Donoghue JP. Instant neural control of a movement signal. Nature. 2002;416:141–142. doi: 10.1038/416141a. [DOI] [PubMed] [Google Scholar]
- Shen L, Alexander G. Neural correlates of a spatial sensory-to-motor transformation in primary motor cortex. J Neurophysiol. 1997;77:1171–1194. doi: 10.1152/jn.1997.77.3.1171. [DOI] [PubMed] [Google Scholar]
- Soechting JF, Burton JE, Onoda N. Relationships between sensory input, motor output and unit activity in interpositus and red nuclei during intentional movement. Brain Res. 1978;152:65–79. doi: 10.1016/0006-8993(78)90134-8. [DOI] [PubMed] [Google Scholar]
- Taira M, Boline J, Smyrnis N, Georgopoulos AP, Ashe J. On the relations between single cell activity in the motor cortex and the direction and magnitude of three-dimensional static isometric force. Exp Brain Res. 1996;109:367–376. doi: 10.1007/BF00229620. [DOI] [PubMed] [Google Scholar]
- Taylor DM, Tillery SI, Schwartz AB. Direct cortical control of 3D neuroprosthetic devices. Science. 2002;296:1829–1832. doi: 10.1126/science.1070291. [DOI] [PubMed] [Google Scholar]
- Thach WT. Correlation of neural discharge with pattern and force of muscular activity, joint position, and direction of next movement in motor cortex and cerebellum. J Neurophysiol. 1978;41:654–676. doi: 10.1152/jn.1978.41.3.654. [DOI] [PubMed] [Google Scholar]
- Todorov E. Direct cortical control of muscle activation in voluntary arm movements: a model. Nat Neurosci. 2000;3:391–398. doi: 10.1038/73964. [DOI] [PubMed] [Google Scholar]
- Wessberg J, Stambaugh CR, Kralik JD, Beck PD, Laubach M, Chapin JK, Kim J, Biggs SJ, Srinivasan MA, Nicolelis MA. Real-time prediction of hand trajectory by ensembles of cortical neurons in primates. Nature. 2000;408:361–365. doi: 10.1038/35042582. [DOI] [PubMed] [Google Scholar]