

Abstract
Movement representation by the motor cortex (M1) has been a theoretical interest for many years, but in the past several years it has become a more practical question, with the advent of the brain–machine interface. An increasing number of groups have demonstrated the ability to predict a variety of kinematic signals on the basis of M1 recordings and to use these predictions to control the movement of a cursor or robotic limb. We, on the other hand, have undertaken the prediction of myoelectric (EMG) signals recorded from various muscles of the arm and hand during button pressing and prehension movements. We have shown that these signals can be predicted with accuracy that is similar to that of kinematic signals, despite their stochastic nature and greater bandwidth. The predictions were made using a subset of 12 or 16 neural signals selected in the order of each signal’s unique, output-related information content. The accuracy of the resultant predictions remained stable through a typical experimental session. Accuracy remained above 80% of its initial level for most muscles even across periods as long as two weeks. We are exploring the use of these predictions as control signals for neuromuscular electrical stimulation in quadriplegic patients.
Introduction
Determining the nature of the information encoded by the brain areas controlling limb movement remains an important goal of motor systems research. Among the earliest experiments in which movement-related discharge from pyramidal tract neurons (PTNs) was recorded were those of Evarts. Those experiments revealed that the discharge rate of most PTNs was primarily related to the forces generating movement or the first time derivative of force (Evarts 1968). Somewhat later, experiments by Georgopoulos and colleagues revealed that movement-related discharge was related to the direction of hand movement by a simple, sinusoidal relation to a given cell’s ‘preferred direction’ (Georgopoulos et al 1982). They later proposed the population vector hypothesis, which suggested that by combining data from many neurons, it was possible to predict the direction of hand movement (Georgopoulos et al 1983). In the past few years, practical applications of this hypothesis have been tested directly by making interfaces between neural recordings and a computer, allowing monkey (Carmena et al 2003, Serruya et al 2002, Taylor et al 2002) and even human (Hochberg et al 2006, Kennedy and Bakay 1998) subjects to control both real and virtual robotic limbs directly from their cortical activity. With a single exception (Carmena et al 2003) all of the ensuing brain–machine interface applications have focused solely on the prediction of kinematic signals.
In this study, we examine the potential for this new technology to be applied in a manner consistent with the observations of Evarts. Rather than the prediction of limb kinematics, we have investigated the accuracy with which the myoelectric (EMG) activity of arm and hand muscles can be predicted. The bandwidth of these signals is substantially greater than that of position, and by their nature EMG signals are stochastic and noisy. Despite these considerations, our predictions can account for as much as 75–80% of the actual EMG variance. This prediction accuracy is very similar to that reported by other groups for predictions of hand movement.
We intend to pursue the possibility that these predictions might be used to control functional neuromuscular stimulation to restore basic movement to patients with spinal cord injury. The Freehand neuroprosthesis is used by several hundred patients with spinal injuries at the C5-6 level to produce a limited repertoire of grasps. It is capable of activating 12 muscles of the arm and hand, but it does so using exclusively preprogrammed stimulus patterns because of the limited voluntary control options currently available to these patients. Our results suggest that cortically generated EMG predictions, combined with a system like Freehand, may allow a broader range of more flexible grasping to be achieved.
Methods
Overview
Recordings of neural activity from electrodes chronically implanted in the primary motor cortex (M1) together with EMG recorded from surface electrodes were obtained from two male Rhesus monkeys, GI and AN. Data were recorded during a multiple button pressing task, as well as during unconstrained, free-form prehension movements. We used both linear and nonlinear models to predict the EMG activity from the M1 discharge. All animal care, surgical and research procedures were approved by the institutional animal care and use the committee of Northwestern University.
Behavioral tasks
The button-press task required the monkey to reach with its left arm from a hold position at its side to one of four buttons. Figure 1 illustrates the arrangement of the four buttons in this task, which were positioned at eye level to allow the monkey to see both sets of buttons. Buttons 1 and 3 were located on the bottom of the device and required that the forearm be supinated. In contrast, buttons 2 and 4 on the top required pronation. This arrangement forced the monkey to use significantly different limb postures and patterns of muscle activity when pressing the upper and lower buttons. A given button was illuminated and an audio cue was sounded to instruct the monkey to begin each trial. When the proper button was pressed within a brief (usually 1 s) time limit, the monkey received a juice reward. Data also were recorded while the monkey made relatively unrestricted reaching movements to grasp small food rewards (‘prehension task’). These reaches were made within a workspace in front of the monkey subtending 80-90° and limited by the length of the monkey’s reach. The top of the workspace was approximately at the level of the button-task targets, so that most of the reaches were at or below the level of the buttons. Roughly 20% of the reaches were made to locations spatially similar to the targets of the button task.
Figure 1.
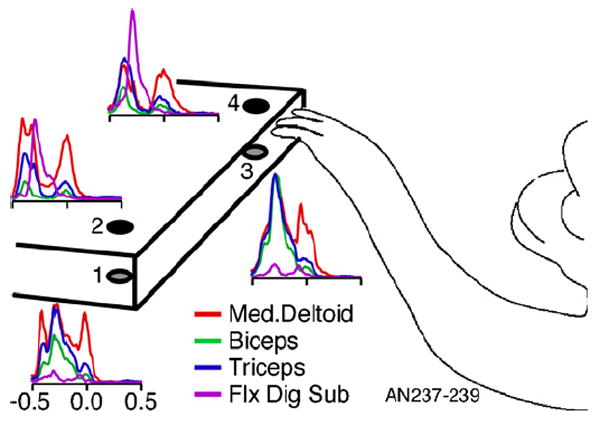
The button-pressing task and associated EMG modulation. Buttons were mounted on the top (buttons 2 and 4, black circles) and bottom (buttons 1 and 3, gray circles) surfaces of a platform, in a configuration that required quite different orientations of the arm. Representative EMG signals are shown corresponding to each of the buttons. Zero corresponds to the time of the button press.
Electrode array implantation surgery
A single array composed of 100 silicon microelectrodes in a 10 × 10 grid (Cyberkinetics, Inc.) was chronically implanted in each monkey’s primary motor cortex. A craniotomy was performed above M1, and the dura incised and reflected. The electrode array was positioned on the crown of the right precentral gyrus, approximately in line with the superior ramus (medial edge) of the arcuate sulcus. A piece of Preclude artificial pericardium was applied above the array, and the dura closed using 4.0 Nurolon suture. Another piece of Preclude was applied over the dura, and the craniotomy partially filled with two-part silicone (Kwik-Cast, World Precision Instruments). The craniotomy was then closed, either with the original bone flap or with dental acrylic, and finally the skin was closed. Surgery was conducted under isoflurane gas anesthesia. Antibiotics (amoxicillin or cephazolin) and dexamethasone were given pre- and postoperatively, Buprenex was also administered postoperatively.
Neural and EMG recording
Neural data were collected using a 32-channel acquisition processor system and the accompanying SortClient software (Plexon, Inc.). The data were sampled at 40 kHz and the action potential waveforms and the corresponding timestamps were saved when the signals exceeded user-defined threshold voltages. Since the number of array electrodes exceeded the available number of recording channels, the experimenter selected the 32 electrodes with the largest, mostly easily isolated single neurons, or those that appeared to have the greatest modulation during arm movements. Subsequently, Offline Sorter (Plexon, Inc.) was used to discriminate action potential waveforms based on clustering of the waveforms in principal components (PC) feature spaces. A given, well-defined cluster was considered to be from a single neuron, if the discriminated waveforms had a consistent shape and a minimum interspike interval (representing a refractory period) greater than 1.1 ms. Clusters which failed any of these tests were assumed to represent the overlapping activity of multiple neurons. All of these signals, whether single or multi-neuron, will be collectively referred to as ‘neural signals’ and were used equivalently in the subsequent analyses.
EMGs were recorded together with the neural data using surface electrodes (Therapeutics Unlimited) placed above the medial deltoid (MDl), biceps (Bic) and triceps (Tri). An electrode was also placed centrally within the forearm, above the flexor musculature for the hand. This recording was primarily from the flexor digitorum sublimis (FDS), but probably included some activity from the adjacent wrist flexors as well. The EMG signals were amplified and high-pass filtered (either 5 or 75 Hz) before being sampled at 2000 Hz. Behavioral data relating to the animals’ performance of the tasks (such as button presses, and the presence of the hand on the touch pad) were also recorded.
Both the neural and EMG data were converted into continuous, 100 Hz signals. The neural firing rates were determined simply by inverting the spike count of action potentials that fell within successive 10 ms bins. The EMG data were full-wave rectified (for one monkey a 50 Hz high-pass filter was applied prior to rectification to remove EKG artifact), then filtered using a 4-pole, low-pass, 10 Hz Butterworth filter before being downsampled to match the bin size of the neural discharge signals.
Linear systems identification
The EMG activity was predicted using a linear system with multiple inputs and a single output (MISO), in which each neural input xk was convolved with its finite impulse response function hk:
| (1) |
As a result, the system output was simply a result of a weighted, linear combination of N inputs stretching from the present (lag 0) to M points in the past. In our implementation, hk was a causal linear filter of 500 ms length (i.e., M = 50). Estimation of hk was computed using the auto- and cross-correlation matrices of the system inputs and outputs in a designated block of training data (Hunter 1983, Perreault et al 1999). We computed the pseudo-inverse of the auto- correlation matrix using singular value decomposition (Westwick and Kearney 1997, Westwick et al 2006).
Nonlinear systems identification
We also explored the benefit of modeling the system as a Wiener cascade. Wiener cascades are a class of nonlinear model that consists of a dynamic linear subsystem followed by a static nonlinearity. The filters described above can be used as the dynamic linear subsystem for such decoders, since the static nonlinearity does not influence estimates of the linear dynamics, except for a possible gain factor (Bussgang et al 1974, Hunter and Korenberg 1986). We implemented the static nonlinearity by fitting a third-order polynomial between the output of the linear subsystem and the recorded EMG of the training data. While Hunter and Korenberg have shown that, for some systems, the cascade can be improved by iteratively re-estimating the linear and nonlinear components, in limited tests with our data we did not find significant improvement in doing so.
Selection of optimal neural input signals
We were able to record as many as 66 neural signals simultaneously, but their discharge was often strongly correlated. Using the full set of available inputs offered little benefit to the decoder performance and was sometimes deleterious. The predictions we describe here used inputs from a small subset of signals determined by an optimal selection process developed by our group (Westwick et al 2006). Briefly, the selection process identifies the unique contribution of each neural signal to the prediction of a particular output. The unique output information must be calculated by taking into account the information available from all other recorded neural signals. The neural signal that contributes the least unique information is dropped from the pool of potential inputs. The process is then repeated with the remaining neural signals. The iterative process is necessary since the unique contributions of the remaining signals change, as each successive signal is dropped. Neural signals were chosen as decoder inputs on the basis of their ranks once all the signals had been so scored. Note that this ranking will not simply correspond to the covariance between the output and a given neural signal, unless all the signals are independent. Thus, the inputs can maximize the amount of information available to the decoder while minimizing the number of inputs that must be processed. This could be particularly important for real-time applications with limited training data or other situations in which the decoders are likely to overfit to the training data.
Model validation
Linear decoder models were estimated with either 4 or 6 min of data (as described further in the Results). In some cases, we report the quality of these initial fits in terms of the magnitude of the coefficient of determination (R2). In all cases, the fits were subsequently cross-validated by applying the decoder functions to novel data to generate predicted outputs. The accuracy of these predictions was evaluated by calculating R2 between 1 min segments of recorded and predicted data.
Results
Database
The results reported here were obtained from two male rhesus monkeys, each with a 100-electrode array (Cyberkinetics, Inc.) chronically implanted in the primary motor cortex. Recordings from monkey GI typically yielded 35–40 well-modulated neural signals. On average 15% of these were derived from well-discriminated, single neurons. The rest represented signals from more than one neuron that could not be reliably separated. More neural signals (58–66) were available from monkey AN. Furthermore, approximately 50% of these were classified as single neurons. For monkey GI, the entire data set included 117 min of data recorded during eight experimental sessions over a period of three months. For monkey AN, 128 min of data were recorded during three experimental sessions over two months.
Figure 1 illustrates the button-press device, including averaged snippets of EMG signals near each button that represent the patterns typical of each muscle (taken from monkey AN). The patterns of EMG activity from monkey GI were quite similar. Figure 2 includes a raster diagram of unit discharge, raw EMG signals and a logical signal indicating the timing of each button press. The rasters have been sorted to correspond with the selection order for the prediction of the deltoid EMG, the neural signal with the most unique information at the top. Most of the neural signals were well modulated during reaching, and the gross correspondence between neural and EMG signals can be readily appreciated. However, there is not an obvious difference in the modulation of the neurons as a function of their selection order. Part of the reason is that highly correlated neurons would have similar modulation, but potentially rather different sort order.
Figure 2.
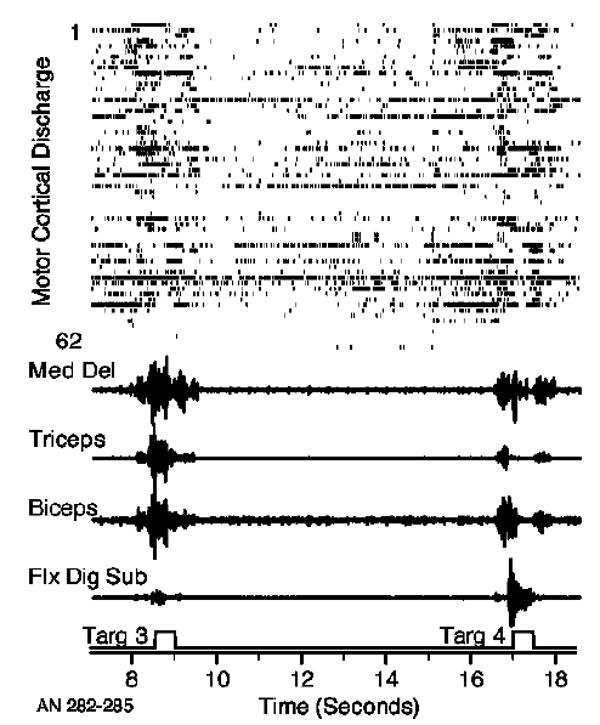
Raw data recorded during the button-press task. Rasters representing the discharge of approximately 60 M1 neural signals together with EMGs from four muscles recorded during the lower (3) and upper (4) button presses.
The way in which the muscle activity varied as the monkey reached to different buttons can be seen in both figures. For example, the upper buttons (2 and 4) required significantly more activity in the FDS than did the lower buttons (1 and 3). Conversely, biceps (which assists in supination) tended to have the greatest activation during reaches to the lower buttons. Among the four muscles, deltoid had the most consistent magnitude of activation across the buttons, consistent with its role in elevating the arm. These variations in EMG magnitude throughout the task were useful when evaluating the ability of the decoders to predict diverse muscle activity robustly.
Accuracy of EMG predictions
Figure 3 contains several examples of the linear predictions of EMG activity. In this particular example from monkey AN, the individual predictions (blue traces) were each generated from the activity of 16 neural signals (on average 34% of these represented well-defined single neurons), selected optimally for each muscle. The sets of signals used for all four muscles were partially overlapping.
Figure 3.
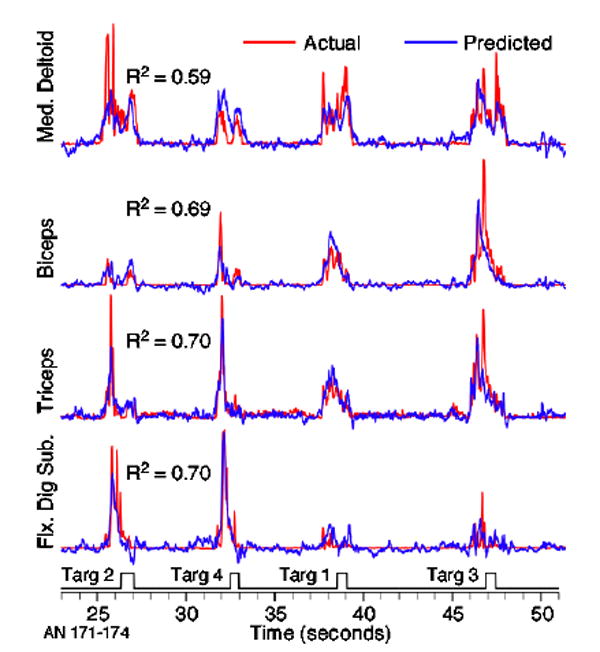
Actual (red) and predicted (blue) EMG signals during the button-press task. Logical signal at the bottom of figure indicates the times of a series of four different button presses. EMG has been rectified and filtered in order to detect the modulation envelope, which was quite well predicted for all four muscles and buttons. The R2 values were calculated from the 1 min segment of data from which these representative examples were taken.
The predictions captured most aspects of the EMG modulation quite well. Furthermore, the substantial differences in activation across the muscles demonstrate that there was not just one generic prediction that fit all the muscles equally well. Similarly, the large differences across buttons (quite noticeable for most muscles between the first two and last two reaches in figure 3) were predicted accurately. The R2 values, calculated using the full minute of data from which these examples were taken, were in the range of 0.60–0.70.
Figure 4 summarizes the means and 95% confidence intervals for all of the predictions made from the recordings during the button-press task for both monkeys (16 inputs for AN and 12 for GI). Only 12 neural signals were used for the predictions for monkey GI (on average 15% of these corresponded to single neurons), because fewer were available for selection. These quantities of neural input signals typically yielded fits with R2 between 90 and 95% of those obtained using all neurons, and cross-validation performance at or above 95% of that for the optimal number of inputs. Since using more than these numbers resulted in little or no gain in performance, it tended to unnecessarily increase model complexity. There were differences in the EMG predictions between the two monkeys, with the prediction R2 values for monkey AN (solid bars) averaging nearly 25% higher than those of monkey GI (two-sided, unpaired t-test, p ≪ 0.001). This was undoubtedly due, at least in part, to the larger pool of available neural signals from which the inputs were selected. Even if the models for AN were limited to 12 inputs, the decrease in prediction accuracy from the 16 input models was quite small: Del, Tri and FDS decreased by 1% (paired t-test, p ≪ 0.001) while the decrease for Bic was statistically insignificant (paired t-test, p = 0.5)
Figure 4.
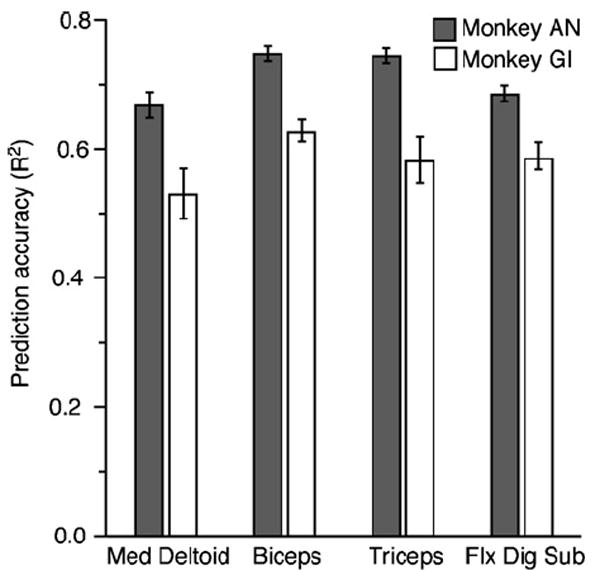
Summary of prediction accuracy for the data from two different monkeys. The average R2 values were found across a series of cross-validation predictions of 1 min segments of EMG data. Error bars represent the 95% confidence limits. There were 92 such data segments for monkey AN and 72 for monkey GI. Predictions typically accounted for 55–70% of the EMG variance.
Filter (i.e. impulse response) length for the decoders was set at 500 ms, which was near optimal for both monkeys. In a series of tests using the three data sets from monkey AN, both shorter (100 and 200 ms) and longer (700 and 1000 ms) filters typically yielded poorer performance in cross-validation assessments. Shorter filters were undoubtedly less effective because some informative data at longer latencies was not included. The longer filters were less effective presumably because of their greater tendency to overfit the data. The filters were estimated using 6 min of training data collected at the beginning of a given recording session for monkey AN and from 4 min of training data recorded at the end of each session for monkey GI. A larger amount of training data was appropriate for AN because of the greater number of inputs (and hence model complexity) used for that monkey. Increasing the amount of training data beyond these levels added little to the performance.
Our choice to filter the rectified EMG signals at 10 Hz also influenced the accuracy of the EMG predictions. To measure this effect, we analyzed the influence of a series of different low-pass filters on each of the data sets from monkey AN. Figure 5 shows these results, normalized to the filter that yielded the largest R2. In all cases, the 95% confidence intervals were smaller than the plotting symbol. A higher corner frequency (less filtering) tended to decrease the R2 of the predicted EMG signals, while more filtering increased R2. The effect reached a peak for a corner between 2–3 Hz, at which point R2 was approximately 12% larger than predictions made using 10 Hz filters. We ultimately chose to use 10 Hz, as a compromise between the improved prediction performance but more limited bandwidth that would have resulted from 2 Hz filters. The delays associated with the higher level of filtering could be problematic if used as a real BMI control signal.
Figure 5.
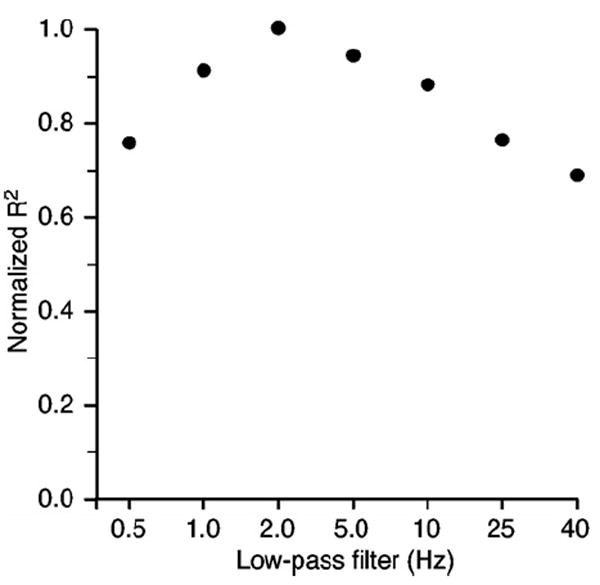
Effect of low-pass filtering on EMG prediction accuracy. There is significant power in the EMG signal at high frequencies that is due simply to the shape of the motor unit action potential and that is essentially noise. The data from monkey AN were used to test the effect of low-pass filtering on prediction accuracy. Decoder models were computed and cross-validated using EMG signals that had been processed with a range of different low-pass filters. The results were normalized to the peak R2 achieved for each segment. Peak precision accuracy occurred when the EMG signals were filtered with a corner between 2 and 3 Hz.
While the linear decoders captured the envelope of the signals quite well, they tended to have two characteristic prediction errors. These included failing to account for the extreme peaks of EMG activity (e.g. most muscles during the 1st and 4th reaches in figure 3) and predicting excessive EMG activity during the quiescent periods between reaches. This low-level noise was the result of the spontaneous firing rate typical of most M1 neurons. Both of these characteristics are evident in the blue curve (linear decoder) shown in figure 6(a). Using a Weiner cascade improved prediction accuracy by partially accounting for both of these errors. In figure 6(b), the actual FDS EMG is plotted against the EMG predicted by the linear decoder. A third-order polynomial was then fitted to these data and used as the static nonlinearity to transform the output of the linear decoder (black curve). At low (including negative) levels of predicted EMG activity, the function acted as a threshold operation, while at higher levels of EMG, it increased the gain of the output above 1 (blue line). As a result, the output of the nonlinear cascade model (black line in panel (a)) more nearly approximated the peaks of actual EMG and had much less power between movements. For the data in figure 6, R2 increased from 0.69 for the linear prediction to 0.75 for the nonlinear prediction.
Figure 6.
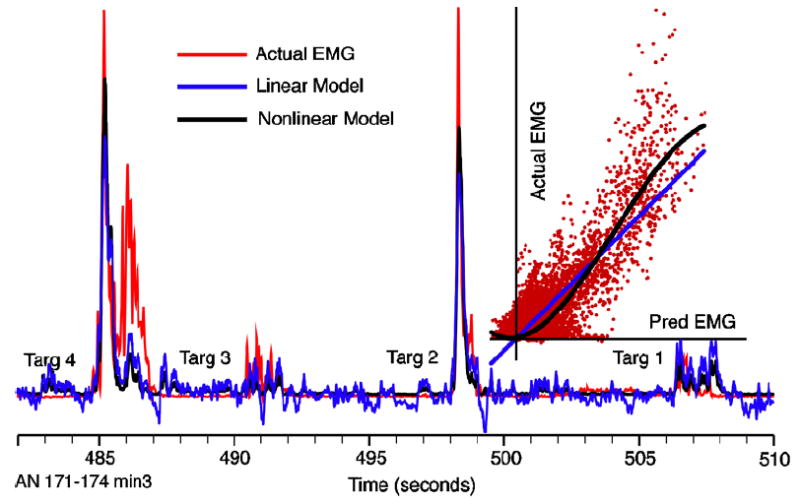
Nonlinear, Weiner cascades models increased prediction accuracy by a small amount, in characteristic ways. Linear predictions (blue line) tended to have more power between movements and fall short of the peaks of the actual EMG (red line). A third-order polynomial was fitted between the linear estimate and the actual EMG (black line, inset) of the training data and used to transform the output of the linear dynamic model. For most muscles, this nonlinear model typically improved prediction accuracy by only 2–3%; however, the effect for FDS was considerably larger.
The results shown in figure 6 were characteristic of the effect of the nonlinearity on predictions of FDS activity, which averaged about 10% for both monkeys. For other muscles, the effect was much smaller, typically 2–3%. For monkey AN, the increase in the prediction accuracy using the static nonlinearity was significant for all muscles, while for monkey GI only the Bic and FDS predictions were significantly improved (paired t-tests for each muscle; p < 0.01).
Stability of EMG predictions across time
We analyzed the stability of the decoders’ performance over time, both within and across sessions. Within sessions, the prediction accuracy for a 1 min segment of data recorded immediately after the training data was compared to that of a similar segment recorded at the end the session. Across all sessions and muscles, there were small, but statistically significant differences for both monkeys. For monkey AN, the prediction accuracy dropped by 4% (paired, one-tailed t-test; p = 0.019) across sessions that were approximately 40 min in length. For monkey GI, predictions at the end of a typical 30 min session were actually 5% higher than at the beginning (p = 0.045).
Using data from monkey GI, we also studied the stability of predictions that spanned a series of five sessions separated by as much as two weeks. In order to ensure a consistent pool of inputs, we used only a set of 30 signals that were consistently classified on given electrodes in all five sessions. We make no assertion that the discriminated signals on these electrodes were from a consistent set of neurons across all sessions. For four of these sessions, we computed decoder models using 12 of the 30 neurons, selected with the optimal process described above. One session lacked adequate data to create the models and was used only for cross-validation. We made predictions from the data for every session using all four decoders. This allowed decoders to be tested on data collected as much as 15 days before or after the data used to create them. Each session included enough novel data to make anywhere from 3 to 14, 1-min predictions. Predictions made from novel data collected on the day the decoder was computed are referred to as ‘day 0’ predictions. The predictions for a given decoder and muscle were normalized to the largest of the 1 min predictions occurring on day 0.
Figure 7 shows results for biceps, which were representative of the other muscles. Decoders from three of the four sessions yielded predictions equal to 80–95% of their day 0 values across as long as 15 days. Those decoders from the middle two sessions obviously could not be tested across a full 15 day time span. The decoders computed in one of the sessions (3/24) did not work well on data from other sessions, with R2 dropping to as low as 65% of the day 0 values. Likewise, the decoders from other sessions generally performed most poorly on the data from session 3/24. It is likely that there was something nonstationary about the monkey’s behavior or the neural data from that session, as the effects were present for all four muscles.
Figure 7.
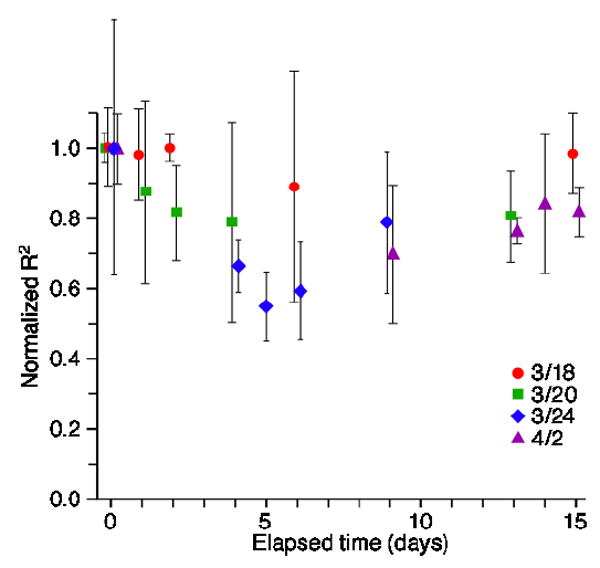
Stability of EMG predictions across sessions for monkey GI. Different symbols represent the average and 95% confidence limits of the cross-validation R2 values, obtained using EMG decoders computed from data collected on four different dates. Hence, predictions were made using data collected as much as 15 days before or after the session on which training data were collected (day 0). The x-axis thus represents absolute time between the sessions from which training and testing data were collected. Symbols for a given day have been slightly offset from each other to avoid overlap. Data points for any given muscle have been normalized to the single 1 min data segment yielding the largest R2 for any given decoder on day 0. Although these data summarize results only for biceps predictions, the results for the three other muscles were similar.
Generalization of EMG predictions over tasks
Using both button and prehension data from monkey AN, we tested the potential of the decoders to generalize across different tasks. The first set of bars in figure 8 repeats the results of figure 4, showing the mean values and 95% confidence intervals for EMG predictions during the button task. The second set of bars shows analogous predictions using prehension task data. For three of the four muscles there was little difference between button-press and prehension predictions, but FDS was predicted much more poorly during prehension. The third set of bars again shows the predictions for the button-press task data, but this time using decoders calculated from prehension data. The quality of these predictions, particularly those of FDS, was much lower than for the other conditions. Likewise, prediction results for prehension were quite low if generated from decoders based solely on the button-press task, suggesting that the relation between cortical and muscle activity during prehension differed from that of the button task. Given the different nature of these tasks, this result is not entirely unexpected.
Figure 8.
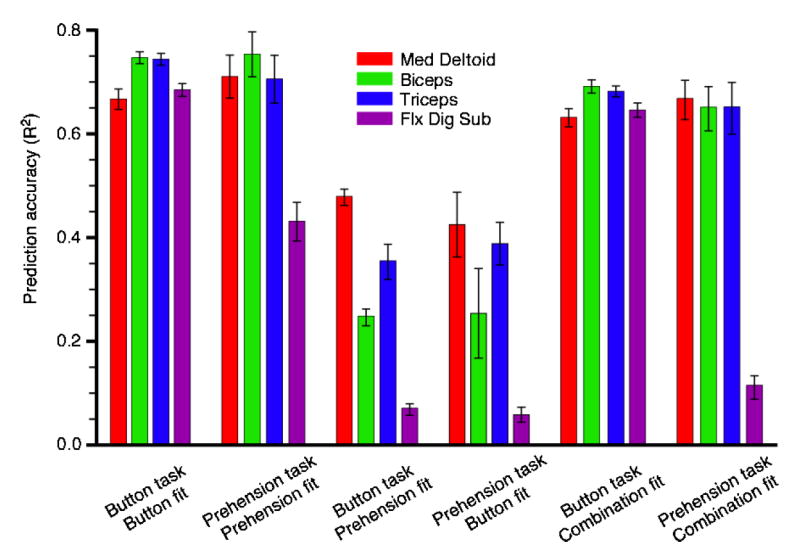
Cross-task generalization of EMG predictions for monkey AN. Each set of four bars indicates the mean and 95% confidence intervals for a particular combination of training and cross-validation data. The first two sets of bars show results for decoders that were trained and tested using data from a single task. The middle two sets of bars show predictions of button or prehension task data using training data involving the other task. The final set of columns shows predictions of both types of data using a single set of decoders that were constructed using a combination of button and prehension training data. In general, the performance that required extrapolation (from one task to another) was significantly degraded.
A more realistic expectation would be that a single set of decoders could predict EMG activation patterns observed during both tasks, provided they were computed from a more robust set of training data. The last two sets of bars summarize these results; predictions of both tasks were made using a single set of decoders computed using training data encompassing both tasks. On average, the prediction accuracy was 8% lower under these conditions than when data from a single task was used for decoder estimation and cross-validation. The prediction of FDS EMG during the prehension task was dramatically less accurate.
Not evident in this summary is the fact that R2 values for FDS predictions were consistently lower during reaches to the bottom buttons than to the top buttons. The most likely explanation is evident in both figures 1 and 2. The magnitude of FDS activity for the lower buttons (1 and 3) was not much beyond the noise level. Although the decoders successfully predicted relatively low reach-related activity for these buttons, the magnitude of the FDS signals during the lower button presses was not much greater than that of the background noise. As a consequence, the R2 values were low. Similarly, FDS activity tended to be quite low throughout the prehension task. Predications of this low level of activity were much improved when the FDS decoder was both computed and tested within the low range of activation levels (e.g., the second set of bars in figure 8).
Optimal selection of neural signal inputs
We typically found substantial overlap in the optimal set of neural signals selected to predict the EMG activity of the four different muscles of any given data set. Figure 9 shows an example of the neural rankings for each of four muscles for one of the button-press data sets from monkey GI. Similar results were seen for monkey AN (although the increased size of the neuron pool makes some of the trends less apparent to the eye). Each matrix indicates the ranking of all neural signals with respect to the unique information each contributed to the prediction of a particular muscle. The columns of each matrix correspond to individual neural signals, while the rows represent 12, 4 min blocks of data (each partially overlapping the previous by 75%) used for the rankings. The color of each element indicates the ranking of the neural signal. All of the columns are ordered according to the ranking obtained in the first data block for medial deltoid. This allows a number of observations to be made from this figure. It is apparent by looking at the first few columns that several neural signals (e.g. 1, 4 and 6) ranked highly for three of the four muscles. Note, however, that it was not always the same set of three muscles. The figure also shows examples of the differences in selected neural signals for the different muscles. At least two neural signals (17 and 19) were consistently ranked highly for biceps and triceps, but not for deltoid or FDS. Neural signal 32 contained unique information almost exclusively for biceps.
Figure 9.
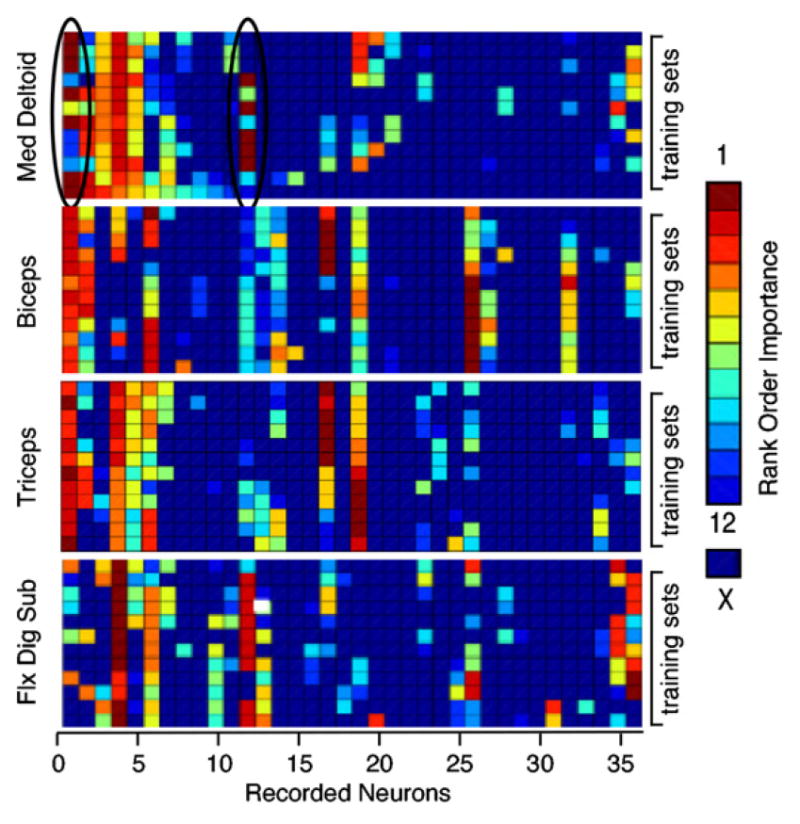
Consistency of input selection across training sets for monkey GI. The color of each element in a matrix represents the ranking of a particular neural signal in terms of its importance in the prediction of a specific muscle (number 1 was most unique). Columns in the figure represent the 36 signals recorded in this session, while the rows represent 12 partially overlapping data sets. Neural signal selection was quite consistent across data sets, with the occasional exception of highly correlated signals (which could substitute for each other). This process resulted in the selection of partially overlapping sets of neural signals for the prediction of the different muscles.
By scanning along any column, it is evident that the selection process was largely consistent across the different training sets. This is important, if these small subsets of neural signals are to provide reliable, stable performance. However, although the inputs were generally chosen quite consistently across training sets, there are a few examples in which a signal was ranked highly in one training set and not selected at all in another (e.g., neural signals 1 and 12 for the deltoid prediction; indicated by the black ovals). This is, in fact, the anticipated behavior in a noisy system with correlated inputs. In this particular example, the correlation between neural signals 1 and 12 was nearly three times higher than the average correlation among the top-ranked neural signals. Consequently, both inputs provided rather similar information. In any given block, when one was selected over the other (even by a slight margin) the information in the remaining input was no longer unique and thus lowly ranked. Either signal could be informative, but not both.
Because the set of neural signals used to predict the four different muscles was partially overlapping, the total number of signals required was larger than the number used for each muscle, but substantially less than four times that number. The average union of the sets of 12 neural signals needed to predict activities in the four muscles for monkey GI was 25, with approximately 14% of these being single neurons. For monkey AN, the union of the four sets of 16 neural signals contained 31 signals, of which 37% were single neurons.
Discussion
We have shown that rectified, filtered EMG signals can be predicted using a small number of optimally selected neural recordings from the primary motor cortex. The accuracy of these predictions was comparable to that previously shown for kinematic signals (Serruya et al 2002, Wessberg et al 2000, Wu et al 2006) consistent with the emerging consensus that M1 contains both kinematic and kinetic (or force-related) information (Kakei et al 1999, Morrow et al 2007, Thach 1978). The EMG predictions remained stable within an experimental session and even across sessions for periods as long as two weeks. However, the predictions generalized only modestly well across two different tasks, but individual decoders computed from data spanning both tasks predicted most muscles quite well. The sole exception was FDS, which was not predicted well in the prehension task, in which its activity was quite low compared to the button task. Nonlinear, Wiener cascade decoders yielded a modest improvement over the linear filter decoders.
Prediction of kinetic signals
The brain–machine interface field has been dominated by applications in which neural signals recorded from motor or premotor areas are used to predict kinematic signals: the position of a cursor on a computer screen (Serruya et al 2002, Taylor et al 2002, Santhanam et al 2006, Kennedy and Bakay 1998, Wolpaw and McFarland 2004) or the endpoint of a robotic limb (Serruya et al 2002, Chapin et al 1999, Taylor et al 2003, Carmena et al 2003). We have demonstrated that similar techniques can be used to predict the activity of individual muscles of the arm and hand. These results can be used to reveal the properties of M1 with respect to its representation of muscles. Of equal significance is the potential for the application of these predictions to a brain–machine interface based on functional neuromuscular stimulation to restore movement to paralyzed patients. We have reported preliminary accounts of these results (Pohlmeyer et al 2007).
In the context of these examples, a distinction should be made between prediction (or reconstruction) and control. Prediction is accomplished by first computing a mapping between multiple neural inputs and a given output signal. A variety of linear and nonlinear methods have been used for this purpose. The resulting decoder is cross-validated by applying it to new neural data to compute a predicted output signal. The quality of the prediction is typically evaluated by computing the coefficient of determination (R2), or a similar measure, between the predicted signals and the actual output signal generated by the subject. If this prediction is made in real time, it can actually be used for control. Now, however, because the subject can detect and correct errors, a meaningful comparison between the subject’s intended output and the decoder prediction can no longer be made.
It is difficult to compare the accuracy of our EMG predictions within the larger body of kinematic results because of the many differences in experimental methods. The particular behavioral task, the number of recorded neurons and the nature of the decoder model are all likely to be significant factors. Perhaps the most useful cross-metric comparison comes from the Carmena study cited previously, which computed predictions from M1 recordings for three types of signals: limb position, grip force and EMG. In that study, the most accurate predictions were made for grip force (R2 = 0.83) followed by hand position (R2 = 0.73) and velocity (R2 = 0.66), with the least accurate predictions (R2 = 0.61) being made for the EMGs. The Carmena study is unusual in the number of different types of signals that were predicted. Among those studies considering only kinematics, there has been a broad range of prediction accuracy reported, some a bit greater than and some less than that reported by Carmena (Wessberg and Nicolelis 2004, Wessberg et al 2000, Serruya et al 2003, Wu et al 2006). The one other EMG prediction study of which we are familiar reported EMG prediction accuracy that ranged from r2 = 0.29 to 0.74, with a mean of 0.56 (Santucci et al 2005). The accuracy of our own EMG predictions was somewhat greater than these, being quite similar to the Carmena kinematic predictions.
It is important to recognize that each of these types of signals has substantially different bandwidth, that of EMG being the highest and position the lowest. The energy in our rectified EMG signals was limited by the 10 Hz low-pass filters with which they were processed. Position signals rarely have significant power above 1–2 Hz. When we limited the power in the EMG signals to a range similar to that of position, the prediction R2 was significantly higher. Judging from the raw data examples (their figure 2) it is likely that the bandwidth of the force signal in the Carmena study was similar to that of position and well below EMG, but this was not reported quantitatively. In this sense, EMG signals are more difficult to predict, and it is significant that their prediction accuracy seems to be as high, or nearly as high, as that of movement kinematics.
Finally, there is evidence that neurons located more caudally within M1 are more closely related to muscle activity than those rostral in the cortex (Rathelot and Strick 2006). The greatest percentage of corticomotoneuronal cells is actually located within the central sulcus, which is inaccessible with the type of electrode array used in these experiments. The use of alternate methods that would allow neurons within the bank of the sulcus to be recorded might further increase the accuracy of EMG predictions.
Factors affecting prediction accuracy
In addition to the type of signal being predicted, a number of other factors affect prediction accuracy in a systematic way. Prediction accuracy has been shown repeatedly to increase with the number of neurons, but perhaps surprisingly, it tends to saturate with relatively small numbers when inputs are selected from the available pool of recorded neurons in an ordered fashion. When we selected inputs using an optimal sequence based on each neural signal’s unique, output-related information, we typically reached peak prediction accuracy with fewer than 15–20 inputs. Beginning with a larger pool of available neurons from which to select (as in moving from monkey GI to AN) undoubtedly yielded some improvement. Another study using a different selection method reported peak performance with essentially the same proportion of neurons (40 of 185; Sanchez et al 2004).
It is also possible that the difference between our monkeys may have been due to the quality of the signals used as inputs as well as their quantity. About half of the recordings from monkey AN were from well-defined single units, compared to only 15% for monkey GI. There is evidence that use of multi-unit signals results in performance roughly 20% lower than a comparable number of single units (Carmena et al 2003). However, the incorporation of multi-unit signals is technically simpler than the use of well-discriminated neurons, and, because each signal is composed of several sources, it is possible that multi-unit signals may be more stable over time. Moreover, we were surprised to find that for monkey AN, there was a small tendency for the optimal selection process to choose multi-unit signals. It will be important to study the relative advantages and disadvantages of these two approaches.
There were other significant factors contributing to the differences between these two monkeys, including the quality of the EMG recording. Unlike position and force, the signal/ noise ratio of EMG signals is subject to numerous factors that may be difficult to control. Decreased SN ratio will lead almost inevitably to lower prediction accuracy. Direct evidence of this can be seen in the prediction of FDS in figure 3. When the monkey pressed the lower buttons (1 and 3), very little activity was required in FDS compared to the upper buttons. This magnitude difference was actually quite well predicted (compare the first two button presses in figure 3 with the second two presses). Even so, when R2 was calculated only for reaches to the lower buttons, it was much lower than for reaches to the upper buttons, because of the much lower SN ratio for those reaches. Whether for reasons like this, or generally poor quality recordings, EMG signals with low SN ratios will be predicted poorly.
Incorporating a static output nonlinearity into the decoder resulted in a small, but consistent increase in EMG prediction accuracy. Although the increase in accuracy was typically less than 5%, it may be of disproportionate importance if these predicted signals were to be used for control. Most of the variance in the actual EMG signals occurs during the movement period, while the periods between movements are quite flat. However, during the inter-trial periods the linear predictions were typically substantially noisier than the actual EMG. As a control signal, even this small noise during quiescent periods could be problematic; hence the benefit of the threshold effect due to the Wiener cascade decoders could potentially be of much more importance in BMI applications than indicated by the improvement in R2 values.
In addition to the descending inputs to the spinal cord, there is evidence that perhaps 30% of muscle activation during reaching may result directly from spinal reflexes (Stein et al 2000, Yakovenko et al 2004). To the extent that these inputs were independent of, or significantly nonlinear functions of cortical activity, their effects on muscle activation would be difficult to predict. Furthermore, plateau potentials mediated by persistent inward calcium channels may actually contribute significantly more net current than the synaptic inputs that trigger them (Lee and Heckman 2000). It has been suggested that they may function as a powerful nonlinear amplifier of synaptic input. It is possible that other types of as yet unexplored nonlinear decoders may prove more successful at capturing some of these nonlinearities. For example, structured models that reflect this and other known nonlinear properties of the musculoskeletal system should be explored.
Cortical control of muscle contraction via FNS
The most obvious application of these predictions would be as control inputs to stimulators used to activate the muscles of a paralyzed individual. Functional neuromuscular stimulation (FNS) is being investigated for a variety of applications, including reaching and locomotion (Triolo et al 1996, Mirbagheri et al 2002, Chizeck et al 1988). The ‘Freehand’ system (Kilgore et al 1997, 2005) has FDA approval and has been implanted in an effort to restore the ability to open and close the hand in several hundred patients with C5-6 spinal injuries. However, finding the means for these patients to control multiple degrees of freedom is quite difficult. The difficulty is markedly compounded for patients with higher level injuries who lack control even of the proximal limb musculature. Intra-cortical recordings and the ability to predict natural muscle activation as described here provide the potential for patients to control multiple degrees of freedom simultaneously through largely natural processes.
If M1 recordings are to be a practical source of control signals, it must be possible to use a given decoder for an adequate period of time before it must be recalculated, in particular if such adjustments could not be readily made by the user. Such recalibrations might prove necessary if significant numbers of neurons were lost or if the discharge properties of existing neurons changed. The fact that the majority of the muscle predictions in our limited study remained useful for more than 24 h is encouraging in this respect. A daily recalibration process, provided it were simple, and required relatively little data, would not be a significant limitation.
The brain’s natural adaptive processes may prove beneficial for optimizing BMI inputs. There is evidence that the real-time use of hand-position predictions for control of a BMI leads to greater movement-related depth of modulation and more distinct spatial tuning, presumably leading to improved control properties (Carmena et al 2003, Taylor et al 2002). This adaptive process would be of particular importance for cases in which, unlike this study, the normal relation between neural and muscle activity could not be directly modeled, as in a human patient with a spinal cord injury. We postulate that neural recordings made during attempted or imagined movements, together with generic EMG modulation templates, could serve as adequate initial estimates for a set of decoders. A subsequent process of iterative, error-driven modifications could serve to adapt the decoders, as has been done in several kinematic BMI studies (Taylor et al 2002).
Generalization of control across a broad range of behaviors is also an important criterion for a completely intuitive BMI controller. We have investigated this by comparing the performance of our muscle decoders during a button-pressing task that required several constrained arm and hand postures, and a free-form prehension task. We were able to obtain high accuracy predictions of both behaviors, provided the EMG decoders were computed using data collected for both behaviors and that the muscles were consistently activated well above the noise level.
It will be important to investigate generalization across a broader range of reaching and grasping behaviors, and to understand the implications of incorporating task-dependent neurons into the decoder models. These considerations might lead to a more complex neuron selection process or the use of more complex nonlinear models. In any case, being able to predict muscle activity accurately from cortical recordings offers the exciting possibility of creating BMI systems that could be used to restore the use of paralyzed muscles in spinal cord injured individuals.
References
- Bussgang JJ, Ehrman L, Graham JW. Analysis of nonlinear systems with multiple inputs. Proc IEEE. 1974;62:1088–119. [Google Scholar]
- Carmena JM, Lebedev MA, Crist RE, O’Doherty JE, Santucci DM, Dimitrov D, Patil PG, Henriquez CS, Nicolelis MA. Learning to control a brain–machine interface for reaching and grasping by primates. PloS Biol. 2003;1:193–208. doi: 10.1371/journal.pbio.0000042. [DOI] [PMC free article] [PubMed] [Google Scholar]
- Chapin JK, Moxon KA, Markowitz RS, Nicolelis MA. Real-time control of a robot arm using simultaneously recorded neurons in the motor cortex. Nat Neurosci. 1999;2:664–70. doi: 10.1038/10223. [DOI] [PubMed] [Google Scholar]
- Chizeck HJ, Kobetic R, Marsolais EB, Abbas JJ, Donner IH, Simon E. Control of functional neuromuscular stimulation systems for standing and locomotion in paraplegics. Proc IEEE. 1988;76:1155–65. [Google Scholar]
- Evarts EV. Relation of pyramidal tract activity to force exerted during voluntary movement. J Neurophysiol. 1968;31:14–27. doi: 10.1152/jn.1968.31.1.14. [DOI] [PubMed] [Google Scholar]
- Georgopoulos AP, Caminiti R, Kalaska JF, Massey JT. Spatial coding of movement: a hypothesis concerning the coding of movement direction by motor cortical populations. Exp Brain Res Supp. 1983;7:327–36. [Google Scholar]
- Georgopoulos AP, Kalaska JF, Caminiti R, Massey JT. On the relations between the direction of two-dimensional arm movements and cell discharge in primate motor cortex. J Neurosci. 1982;2:1527–37. doi: 10.1523/JNEUROSCI.02-11-01527.1982. [DOI] [PMC free article] [PubMed] [Google Scholar]
- Hochberg LR, Serruya MD, Friehs GM, Mukand JA, Saleh M, Caplan AH, Branner A, Chen D, Penn RD, Donoghue JP. Neuronal ensemble control of prosthetic devices by a human with tetraplegia. Nature. 2006;442:164–71. doi: 10.1038/nature04970. [DOI] [PubMed] [Google Scholar]
- Hunter IW, Kearney RE. Two-sided linear filter identification. Med Biol Eng Comput. 1983;21:203–9. doi: 10.1007/BF02441539. [DOI] [PubMed] [Google Scholar]
- Hunter IW, Korenberg MJ. The identification of nonlinear biological systems: Wiener and Hammerstein cascade models. Biol Cybern. 1986;55:135–44. doi: 10.1007/BF00341929. [DOI] [PubMed] [Google Scholar]
- Kakei S, Hoffman DS, Strick PL. Muscle and movement representations in the primary motor cortex. Science. 1999;285:2136–9. doi: 10.1126/science.285.5436.2136. [DOI] [PubMed] [Google Scholar]
- Kennedy PR, Bakay RA. Restoration of neural output from a paralyzed patient by a direct brain connection. Neuroreport. 1998;9:1707–11. doi: 10.1097/00001756-199806010-00007. [DOI] [PubMed] [Google Scholar]
- Kilgore KL, Peckham PH, Keith MW, Thrope GB, Wuolle KS, Bryden AM, Hart RL. An implanted upper-extremity neuroprosthesis. Follow-up of five patients. J Bone Joint Surg Am. 1997;79:533–41. doi: 10.2106/00004623-199704000-00008. [DOI] [PubMed] [Google Scholar]
- Kilgore KL, Peckham PH, Montague FW, Hart RL, Bryden AM, Keith MW, Hoyen H, Bhadra N. An Implanted upper extremity neuroprosthesis utilizing myoelectric control. 2nd Int IEEE EMBS Conference on Neural Engineering, 2005: Conf Proc 2005 [Google Scholar]
- Lee RH, Heckman CJ. Adjustable amplification of synaptic input in the dendrites of spinal motoneurons in vivo. J Neurosci. 2000;20:6734–40. doi: 10.1523/JNEUROSCI.20-17-06734.2000. [DOI] [PMC free article] [PubMed] [Google Scholar]
- Mirbagheri MM, Ladouceur M, Barbeau H, Kearney RE. The effects of long-term FES-assisted walking on intrinsic and reflex dynamic stiffness in spastic spinal-cord-injured subjects. IEEE Trans Neural Syst Rehabil Eng. 2002;10:280–9. doi: 10.1109/TNSRE.2002.806838. see also IEEE Trans. Rehabil. Eng. [DOI] [PubMed] [Google Scholar]
- Morrow MM, Jordan LR, Miller LE. Direct comparison of the task-dependent discharge of M1 in hand space and muscle space. J Neurophysiol. 2007;97:1786–98. doi: 10.1152/jn.00150.2006. [DOI] [PMC free article] [PubMed] [Google Scholar]
- Perreault EJ, Kirsch RF, Acosta AM. Multiple-input, multiple-output system identification for characterization of limb stiffness dynamics. Biol Cybern. 1999;80:327–37. doi: 10.1007/s004220050529. [DOI] [PubMed] [Google Scholar]
- Pohlmeyer EA, Perreault EJ, Slutzky MW, Kilgore KL, Kirsch RF, Taylor DM, Miller LE. Real-time control of the hand by intracortically controlled functional neuromuscular stimulation. IEEE Proc 10th Int Conf Rehab Robotics 2007 [Google Scholar]
- Rathelot JA, Strick PL. Muscle representation in the macaque motor cortex: an anatomical perspective. Proc Natl Acad Sci USA. 2006;103:8257–62. doi: 10.1073/pnas.0602933103. [DOI] [PMC free article] [PubMed] [Google Scholar]
- Sanchez JC, Carmena JM, Lebedev MA, Nicolelis MA, Harris JG, Principe JC. Ascertaining the importance of neurons to develop better brain–machine interfaces. IEEE Trans Biomed Eng. 2004;51:943–53. doi: 10.1109/TBME.2004.827061. [DOI] [PubMed] [Google Scholar]
- Santhanam G, Ryu SI, Yu BM, Afshar A, Shenoy KV. A high-performance brain–computer interface. Nature. 2006;442:195–8. doi: 10.1038/nature04968. [DOI] [PubMed] [Google Scholar]
- Santucci DM, Kralik JD, Lebedev MA, Nicolelis MA. Frontal and parietal cortical ensembles predict single-trial muscle activity during reaching movements in primates. Eur J Neurosci. 2005;22:1529–40. doi: 10.1111/j.1460-9568.2005.04320.x. [DOI] [PubMed] [Google Scholar]
- Serruya M, Hatsopoulos NG, Fellows M, Paninski L, Donoghue J. Robustness of neuroprosthetic decoding algorithms. Biol Cybern. 2003;88:219–28. doi: 10.1007/s00422-002-0374-6. [DOI] [PubMed] [Google Scholar]
- Serruya MD, Hatsopoulos NG, Paninski L, Fellows MR, Donoghue JP. Instant neural control of a movement signal. Nature. 2002;416:141–2. doi: 10.1038/416141a. [DOI] [PubMed] [Google Scholar]
- Stein RB, Misiaszek JE, Pearson KG. Functional role of muscle reflexes for force generation in the decerebrate walking cat. J Physiol. 2000;525:781–91. doi: 10.1111/j.1469-7793.2000.00781.x. [DOI] [PMC free article] [PubMed] [Google Scholar]
- Taylor DM, Tillery SI, Schwartz AB. Direct cortical control of 3D neuroprosthetic devices. Science. 2002;296:1829–32. doi: 10.1126/science.1070291. [DOI] [PubMed] [Google Scholar]
- Taylor DM, Tillery SI, Schwartz AB. Information conveyed through brain-control: cursor versus robot. IEEE Trans Neural Syst Rehabil Eng. 2003;11:195–9. doi: 10.1109/TNSRE.2003.814451. [DOI] [PubMed] [Google Scholar]
- Thach WT. Correlation of neural discharge with pattern and force of muscular activity, joint position, and direction of next movement in motor cortex and cerebellum. J Neurophysiol. 1978;41:654–76. doi: 10.1152/jn.1978.41.3.654. [DOI] [PubMed] [Google Scholar]
- Triolo R, Nathan R, Handa Y, Keith M, Betz RR, Carroll S, Kantor C. Challenges to clinical deployment of upper limb neuroprostheses. J Rehabil Res Dev. 1996;33:111–22. [PubMed] [Google Scholar]
- Wessberg J, Nicolelis MA. Optimizing a linear algorithm for real-time robotic control using chronic cortical ensemble recordings in monkeys. J Cogn Neurosci. 2004;16:1022–35. doi: 10.1162/0898929041502652. [DOI] [PubMed] [Google Scholar]
- Wessberg J, Stambaugh CR, Kralik JD, Beck PD, Laubach M, Chapin JK, Kim J, Biggs SJ, Srinivasan MA, Nicolelis MA. Real-time prediction of hand trajectory by ensembles of cortical neurons in primates. Nature. 2000;408:361–5. doi: 10.1038/35042582. [DOI] [PubMed] [Google Scholar]
- Westwick DT, Kearney RE. Identification of physiological systems: a robust method for non- parametric impulse response estimation. Med Biol Eng Comput. 1997;35:83–90. doi: 10.1007/BF02534135. [DOI] [PubMed] [Google Scholar]
- Westwick DT, Pohlmeyer EA, Solla SA, Miller LE, Perreault EJ. Identification of multiple-input systems with highly coupled inputs: application to EMG prediction from multiple intracortical electrodes. Neural Comput. 2006;18:329–55. doi: 10.1162/089976606775093855. [DOI] [PMC free article] [PubMed] [Google Scholar]
- Wolpaw JR, McFarland DJ. Control of a two-dimensional movement signal by a noninvasive brain–computer interface in humans. Proc Natl Acad Sci USA. 2004;101:17849–54. doi: 10.1073/pnas.0403504101. [DOI] [PMC free article] [PubMed] [Google Scholar]
- Wu W, Gao Y, Bienenstock E, Donoghue JP, Black MJ. Bayesian population decoding of motor cortical activity using a Kalman filter. Neural Comput. 2006;18:80–118. doi: 10.1162/089976606774841585. [DOI] [PubMed] [Google Scholar]
- Yakovenko S, Gritsenko V, Prochazka A. Contribution of stretch reflexes to locomotor control: a modeling study. Biol Cybern. 2004;90:146–55. doi: 10.1007/s00422-003-0449-z. [DOI] [PubMed] [Google Scholar]