

Abstract
Prefrontal cortical functioning depends on D1 family receptors and their complex signal transduction cascade, including protein phosphatase-1 (PP1). Three PP1 isoforms are prominent in the brain: PP1α, PP1β and PP1γ1. PP1 localization by a variety of scaffolding proteins is critical for dopamine-mediated modulation of glutamatergic neurotransmission. We have quantified the subcellular distribution of each isoform in primate prefrontal cortex using immunoelectron microscopy. All three are found in spines, dendrites, axon terminals, axons and glia. However, PP1α and PP1γ1 labeling is enriched in spines, whereas PP1β label is enriched in dendrites. Using post-embedding immunogold labeling, we further examined the distribution of PP1α and PP1γ1 within spines. PP1γ1 is highly and specifically concentrated in the postsynaptic density (PSD) of these spines, while PP1α is enriched in the PSD but also found subjacent to the PSD in moderate amounts. Thus, PP1 isoforms are heterogeneously distributed in the cortical neuropil and within spines. These results suggest that each PP1 isoform has access to a different set of substrates and, furthermore, they demonstrate that the composition of signal transduction proteins varies in different parts of the neuron and even in different regions of a dendritic spine in the primate PFC.
Keywords: electron microscopy, post-embedding immunogold, postsynaptic density, scaffolding protein, signal transduction
Introduction
Protein phosphatase-1 (PP1) is a serine/threonine phosphatase involved in many cellular processes including glycogen metabolism, RNA transcription, protein synthesis, cellular division and apoptosis (reviewed in Aggen et al., 2000; Cohen, 2002; Ceulemans and Bollen, 2004). In neurons, PP1 influences neurite outgrowth (Oliver et al., 2002), synapse formation (Malchiodi-Albedi et al., 1997) and neurotransmission (reviewed in Greengard et al., 1999; Price and Mumby, 1999; Colbran, 2004). Many D1 dopamine receptor actions require PP1 (Greengard et al., 1999). PP1 regulates the coupling of D1 to Gαs (Zhen et al., 2001) and regulates AMPA (Yan et al., 1999; Snyder et al., 2000), NMDA (Snyder et al., 1998) and GABAA receptors (Flores-Hernandez et al., 2000), as well as calcium currents (Surmeier et al., 1995). PP1 is also critical for synaptic plasticity, especially long-term depression (Mulkey et al., 1994; Morishita et al., 2001).
PP1 consists of a catalytic subunit that can interact with over 50 regulatory or scaffolding proteins, and these binding partners specify localization, substrate selectivity and/or overall activity (Cohen, 2002). For example, spinophilin (Allen et al., 1997), neurabin (Nakanishi et al., 1997) and yotiao (Lin et al., 1998) are three neuronal PP1 scaffolding proteins. Scaffold-mediated localization of PP1 plays an important role in the control of NMDA currents (Westphal et al., 1999) and dopaminergic regulation of AMPA currents (Yan et al., 1999). The distribution of spinophilin and neurabin in primate prefrontal cortex (PFC) overlaps considerably, but not completely. Both scaffolding proteins are concentrated in spines, but are also found to a lesser extent in dendrites, glia and preterminal axons. However, only neurabin is found in axon terminals. Conversely, spinophilin, but not neurabin, is located within parvalbumin-containing interneurons (Muly et al., 2004a,b). These data highlight the potential functional importance of PP1 localization in neuronal signal transduction, and suggest a complex and highly specific targeting of PP1 to a variety of neuronal compartments.
There are four isoforms of PP1: PP1α, PP1β, PP1γ1 and PP1γ2. These isoforms differ in scaffolding protein binding preference (MacMillan et al., 1999; Terry-Lorenzo et al., 2002; Carmody et al., 2004), regulation by protein kinase C (Takizawa et al., 1997) and protein expression levels in response to neurodegenerative-like cellular stress (Amador et al., 2004). Electron microscopic studies in the primate have shown that PP1α and PP1γ1 are found in dendritic spines (Ouimet et al., 1995; Muly et al., 2001). Studies in the rat using subcellular fractionation and immunolabeling of cultured neurons and brain sections suggest PP1γ1 is enriched in actin-containing spines and terminals, while PP1β is predominately in the soma and microtubule-rich dendrites (Strack et al., 1999).
In light of this previous work on PP1 isoforms and scaffolding proteins, we addressed the extent of the exclusivity of PP1α and PP1γ1 localization in spines and PP1β localization in dendrites in macaque PFC. We then examined in detail the intraspinous localization of those isoforms concentrated in spines using the high-resolution post-embedding immunogold approach. Our results suggest a structural basis for differential functional roles of PP1 isoforms in axospinous neurotransmission.
Materials and Methods
Animals and Preparation of Tissue
Tissue from six macaque monkeys, identified as monkeys A–F, was used for this study. The care of the animals and all anesthesia and sacrifice procedures in this study were performed according to the National Institutes for Health Guide for the Care and Use of Laboratory Animals and were approved by the Institutional Animal Care and Use Committee of Emory University. The animals were sacrificed with an overdose of pentobarbital (100 mg/kg) and then perfused with a flush of Tyrode’s or Ringer’s solution through which 95% O2/5% CO2 was bubbled continuously. The flush was followed by 3–4 l of fixative solution of 4% paraformaldehyde/0.1–0.2% glutaraldehyde/0–0.2% picric acid in phosphate buffer (PB; 0.1 M, pH 7.4). The brain was blocked and post-fixed in 4% paraformaldehyde for 4–24 h. Coronal, 50 μm-thick Vibratome sections of prefrontal cortical area 9 (Walker, 1940) were cut and stored frozen in 15% sucrose until immunohistochemical experiments were performed.
Pre-embedding Immunohistochemistry
Single-label immunoperoxidase labeling was performed by using rabbit anti-PP1α, anti-PP1γ1 or anti-PP1β antisera. The production and characterization of the PP1α, PP1γ1 and PP1β antisera have been described previously (da Cruz e Silva et al., 1995; Strack et al., 1999). The antisera were used at the following dilutions: 1:5700 for PP1α, 1:1300 for PP1γ1 and 1:500 for PP1β.
Pre-embedding immunoperoxidase labeling was performed as described previously (Muly et al., 1998) in monkeys A–C. Briefly, sections were thawed, incubated in blocking serum (3% normal goat serum, 1% bovine serum albumin, 0.1% glycine, 0.1% lysine in 0.01 M phosphate-buffered saline, pH 7.4) for 1 h and then placed in primary antiserum diluted in blocking serum. After 36 h at 4°C, the sections were rinsed and placed in a 1:200 dilution of biotinylated goat anti-rabbit IgG (Vector, Burlingame, CA) for 1 h at room temperature. The sections were then rinsed, placed in avidin–biotinylated peroxidase complex (ABC Elite, Vector, Burlingame, CA) for 1 h at room temperature, and then processed to reveal peroxidase using 3,3’-diaminobenzidine (DAB) as the chromagen. Sections were then post-fixed in osmium tetroxide, stained en bloc with uranyl acetate, dehydrated and embedded in Durcupan resin (Electron Microscopy Sciences, Fort Washington, PA). Selected regions were mounted on blocks, and ultrathin sections were collected onto pioloform-coated slot grids and counterstained with lead citrate. Control sections, processed as above except for the omission of the primary immunoreagent, did not contain DAB label upon electron microscopic examination.
Post-embedding Immunogold Labeling
Tissue from monkeys D–F, sacrificed as described above, was prepared by high-pressure freezing and freeze substitution for post-embedding labeling as described previously (Kieval et al., 2001). Briefly, tissue sections were cut 100 μm thick using a Vibratome and placed in an ascending series of cryoprotectant (final concentrations: 10% glycerol, 25% sucrose in 0.05 M phosphate buffer, pH 7.4). Pieces of prefrontal cortex taken from these sections were frozen in a high pressure freezer (Balzers, HPM-010) and then processed by freeze substitution in 0.5% uranyl acetate in methanol (Bal-Tec TTP010), infiltrated with Lowicryl HM-20 resin and polymerized with UV light at −40°C in a low temperature polymerization unit (Bal-Tec LTPU 010). Blocks were prepared, and 80-nm-thick sections were cut and collected on pioloform-coated 400 mesh gold grids.
For immunolabeling, all solutions except the antisera were filtered through a 0.2 μm syringe filter. Both primary and secondary antisera were diluted in solutions that had been syringe filtered. The grids were etched with 0.1% Triton X-100 in 0.05 M Tris buffer (pH 7.6; TB) for 1–2 min and then treated with 0.1% sodium borohydride and 0.05 M glycine in TB for 10 min. They were then rinsed in TB and placed in blocking serum (1% normal goat serum and 2% human serum albumin, PE-BS) for 30 min. The grids were then incubated overnight at room temperature in either rabbit anti-PP1α (1:570) or rabbit anti-PP1γ1 (1:130) antisera diluted in PE-BS. After rinsing in TB, the grids were incubated in goat anti-rabbit IgG conjugated to 10 nm gold particles (1:100, produced by BBI, sold by Ted Pella, Inc., Redding, CA) diluted in PE-BS and 5 mg/ml of polyethylene glycol (mol. wt 8000) for 90 min. The grids were then rinsed, treated with 1% glutaraldehyde for 2 min and stained with uranyl acetate and lead citrate before being examined at the electron microscope (Zeiss EM10C).
Analysis of Material
The DAB-labeled material was analyzed as previously described (Muly et al., 2004b). Blocks of tissue from layer III of cortical area 9 were made and cut in ultrathin sections that were examined using a Zeiss EM10C electron microscope. Layer III was chosen based on previous research in layers I, III and V demonstrating no effect of cortical layer on the extent of spine labeling for PP1α and PP1γ1 (Muly et al., 2001), and this layer is a major site of integration of inputs from different cortical areas. Regions of the grids containing neuropil were selected based on the presence of label and adequate ultrastructural preservation. Fields of immunoreactive elements in the neuropil were randomly selected, and images were collected at a magnification of 31 500 using a Dualvision cooled CCD camera (1300 × 1030 pixels) and Digital Micrograph software (version 3.7.4, Gatan, Inc., Pleasanton, CA). For PP1α, a total of 183 micrographs, representing 1117 μm2, were taken. For PP1γ1, a total of 279 micrographs, representing 1703 μm2, were taken. For PP1β, a total of 269 micrographs, representing 1642 μm2, were taken. On each micrograph, DAB-labeled profiles were identified and classified as spines, dendrites, terminals, axons, glia or unknown based on ultrastructural criteria (Peters et al., 1991). Profiles were identified as spines based on size (0.3–1.5 μm in diameter), presence of spine apparatus, absence of mitochondria or microtubules and, in some cases, the presence of asymmetric synaptic contacts. Dendrites were identified by their larger size (≥0.5 μm in diameter), and the presence of microtubules, mitochondria and, in some cases, synaptic contacts. Axon terminals were characterized by the presence of numerous vesicles, mitochondria and occasionally a presynaptic specialization. Pre-terminal, unmyelinated axons were identified by their small size (0.1–0.3 μm in diameter), regular round shape and occasional presence of synaptic vesicles or neurofilaments. Glial profiles were identified based on their unusual shape, which appears to fill in the space between nearby profiles, and a relatively clear cytoplasm, which occasionally contained numerous glial filaments and mitochondria. Profiles that could not be clearly characterized based on these criteria were considered unknown profiles. The number of immunoreactive profiles was tabulated and the distributions (excluding the unknown profiles) compared with a χ2 analysis.
The analysis of the post-embedding immunogold labeling was performed as previously described for spinophilin and neurabin (Muly et al., 2004a,b). Each sample of post-embedding labeling was examined, and axospinous synapses were identified from mesh squares on each grid. A digital image was made of each axospinous synapse that contained gold label in either the spine or presynaptic terminal. For each grid, we required that a minimum of 10 labeled axospinous synapses be identified in no more than two randomly chosen mesh squares for the grid to be considered adequately labeled. From grids with adequate gold label, we imported the images of labeled axospinous synapses into a computer graphics program (Canvas, Deneba Software, Miami) and the area of the spine and terminal profile on each micrograph was measured. Each grid was considered independently and the density of gold particles over the spines and terminals and the ratio of spine to terminal gold density (STR) were then calculated. For PP1α a total of 45 grids were initially examined; 16 of these grids were from monkey D, 15 from monkey E and 14 from monkey F. Of the 45 total grids, 44 contained adequate gold label and were analyzed. For PP1γ1 a total of 60 grids were initially examined; 31 of these grids were from monkey D, 15 from monkey E and 14 from monkey F. Of the 60 total grids, 36 contained adequate gold label and were analyzed. Most grids labeled for PP1α showed an STR under 3.0; however, there was a select group of seven grids that had ratios above 3.0. These seven grids were distributed across the three monkeys: four were from monkey D, two were from monkey E and one was from monkey F. Most grids labeled for PP1γ1 showed an STR under 4.0; however, there was a select group of 11 grids with ratios above 4.0. These 11 grids were distributed across the three monkeys: nine were from monkey D while one grid each from monkeys E and F met this threshold. Because our analysis of DAB-labeled material indicated that PP1α and PP1γ1 were concentrated more in spines than in terminals, we selected those experiments which had the highest STRs for further analysis.
We first divided each spine containing gold label into three compartments: the postsynaptic density (PSD), the spine apparatus and the remaining spinoplasm. For each compartment, the total area, as well as the number and density of gold particles, was calculated. We then divided the spine into bins based on distance from the PSD. The first bin was the PSD itself, the second bin was defined as the area between 1 and 50 nm subjacent to the PSD, and subsequent bins were additional 50 nm increments in from the PSD. In addition, we included a pre-PSD bin which consisted of the area within 25 nm of the border of the PSD outside of the spine. We chose a 25 nm pre-PSD bin because of evidence that while the location of post-embedding gold label typically indicates the position of the protein of interest within 5 nm, the gold can, more rarely, be up to 25 nm distant (Matsubara et al., 1996). Thus, antigen present at the synaptic membrane could be visualized as gold signal on the presynaptic side up to 25 nm. For each bin, the total area, number of gold particles and density of gold label were determined. Finally, axon terminals were divided into two regions, a presynaptic region that included the area inside the terminal within 25 nm of the plasma membrane immediately adjacent to the synaptic cleft and the rest of the terminal. The density of gold label was determined in these two regions for the 86 terminals that contained PP1α gold label from our sample of 248 labeled axospinous synapses and the 39 axon terminals that contained PP1γ1 gold label from our sample of 163 labeled axospinous synapses. Of the 248 labeled synapses for PP1α, 66% (n = 163) were from monkey D, 18% (n = 45) were from monkey E and 16% (n = 40) were from monkey F. Of the 163 PP1γ1-labeled axospinous synapses, 88% (n = 144) were from monkey D, 6% (n = 10) from monkey E and 6% (n = 10) from monkey F.
Results
Subcellular Distribution of PP1 Isoforms
The localization of PP1α, PP1γ1 and PP1β in the PFC has been previously described in detail at the light microscopic level (da Cruz e Silva et al., 1995; Strack et al., 1999; Muly et al., 2001). Briefly, PP1α and PP1γ1 immunolabeling is mainly found in small puncta, but PP1α is also expressed in neuronal nuclei. On the other hand, PP1β immunostaining is largely confined to somatodendritic elements.
In the present study, we used immunoperoxidase electron microscopy to more precisely determine the subcellular distribution of neuropil labeling for PP1α, PP1γ1 and PP1β. Each isoform was seen in dendritic spines, dendritic shafts, axon terminals, preterminal axons and glia (Fig. 1). To explore differences in the neuropil distribution of the three PP1 isoforms, we quantified the relative distribution of immunoreactive profiles. For PP1α we examined 540 profiles in 183 micrographs; for PP1β we examined 661 profiles in 269 micrographs; and for PP1γ1 we examined 491 profiles in 279 micrographs. The relative distribution of PP1α, PP1γ1 and PP1β immunoreactivity across neuropil elements differed significantly (Fig. 2; χ2 = 562.389; P < 0.0001). Although all three isoforms were widely distributed in neuropil compartments, PP1α and PP1γ1 were found predominately in dendritic spines, while PP1β was more frequently found in dendritic shafts. Post hoc testing revealed that a significantly larger proportion of PP1α label was found in dendritic spines (65.7 %) than PP1γ1 (54.0%) or PP1β (9.4%), and PP1γ1 spine labeling was significantly greater than PP1β. PP1β labeled a significantly larger proportion of dendrites (43.4%), axon terminals (12.4%) and preterminal axons (18.3%) than either PP1α (6.7, 6.3 and 10.9%) or PP1γ1 (8.1, 4.5 and 13.6%). PP1β (16.5%) and PP1γ1 (19.8%) labeled a significantly larger percentage of glial processes than PP1α (10.4%). This analysis illustrates that PP1β displays a very different pattern of distribution than PP1α or PP1γ1 in the primate PFC. The distribution of PP1α and PP1γ1 differs, but primarily in the extent of glial labeling. When glial labeling was excluded in a follow up analysis and only neuronal compartments were considered, the distribution of PP1α and PP1γ1 was not significantly different (χ2 = 7.205, P = 0.066).
Figure 1.
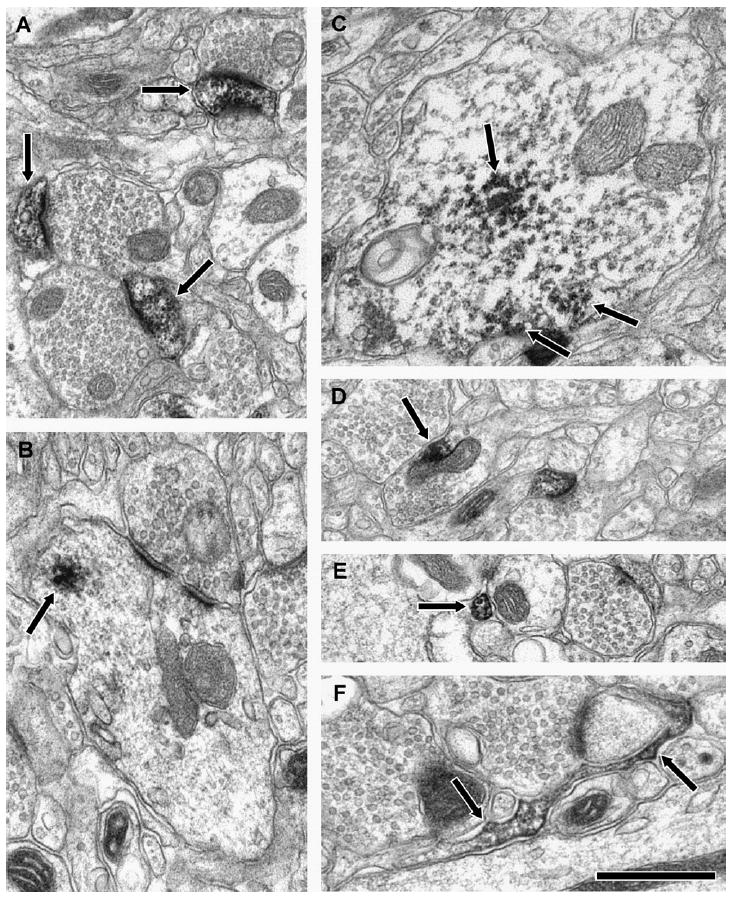
Electron micrographs illustrating the localization of PP1α, PP1γ1 and PP1β in the neuropil of PFC. Diaminobenzidine label (arrows) was most common in spines for PP1α and PP1γ1 (A; PP1α). Dendrites were most commonly immunoreactive for PP1β (B and C). Labeled axon terminals (D; PP1γ1), pre-terminal axons (E; PP1α) and glia (F; PP1β) were also observed for all three isoforms. The scale bar is 500 nm for B, C and F; and 750 nm for A, D and E.
Figure 2.
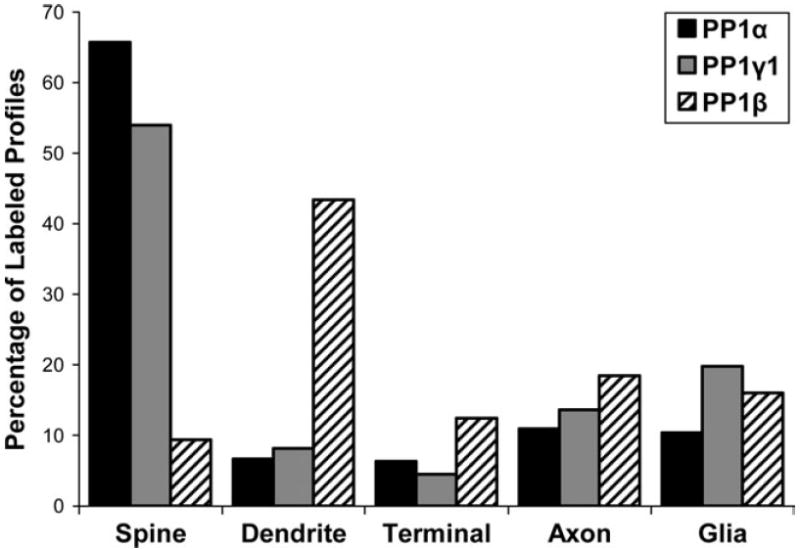
A histogram showing the relative abundance of labeled elements for PP1α, PP1γ1 and PP1β in the neuropil of primate PFC. The distribution of immunoreactive profiles is significantly different between the isoforms (χ2 = 562.389; P < 0.0001).
Intraspinous Localization of PP1α and PP1γ1
The analysis of immunoperoxidase neuropil labeling described above demonstrates that the distribution of PP1β is markedly different from that of either PP1α or PP1γ1. However, it provides little evidence for differences in neuronal localization between PP1α and PP1γ1 that could suggest functional differences between these two isoforms. In order to address this issue more carefully, we studied their distribution within spines using post-embedding immunogold labeling that has a better spatial resolution than the immunoperoxidase technique. For PP1α, we examined 248 labeled axospinous synapses, 207 of which had gold label within the spine and 86 of which had gold label within the terminal. This sample contained 494 gold particles of which 336 were located in the spine, 142 were located in the terminal and 16 were located within the synaptic cleft. For PP1γ1, we examined 163 labeled axospinous synapses, 130 of which had gold label within the spine and 39 of which had gold label within the terminal. This sample contained 222 gold particles, of which 171 were located in the spine, 50 were located in the terminal and one was located within the synaptic cleft.
In the PP1α-labeled axospinous synapses, gold particles were commonly seen in the PSD of dendritic spines (Fig. 3A), as well as in the subjacent spinoplasm (Fig. 3B). In addition, gold label for PP1α was occasionally found in the synaptic cleft (Fig. 3C). In PP1γ1-labeled sections, gold particles were very commonly seen in the PSD (Fig. 3D), but more rarely observed in the subjacent spinoplasm. In order to compare the distribution of label for the two isoforms, we measured the density of gold label in the three spine compartments (PSD, spine apparatus and the remaining spinoplasm), and the density of gold label in each region was calculated (Fig. 4). Both PP1α and PP1γ1 labeling showed a relative enrichment in the PSD with relatively less dense label in the spine apparatus. PP1γ1 gold label was less dense than PPα gold label in the spinoplasm. To further compare PP1α localization with that of PP1γ1, we divided the spine into ‘bins’ based on distance from the PSD. The values for number of gold particles, percentage of total spine area and density of label for each bin are plotted for PP1α (Fig. 5A) and PP1γ1 (Fig. 5B). The density of PP1α and PP1γ1 gold labeling was highest in the PSD. The density of PP1α label declined by ~50% in the 50 nm subjacent to the PSD and then slowly declined throughout the remainder of the spine. The density of PP1γ1 gold label was reduced sharply, by ~72%, in the 50 nm subjacent to the PSD and then fell to very low levels throughout the remainder of the spine. Only one gold particle for PP1γ1 was identified in the pre-PSD area, whereas 25 gold particles for PP1α were contained in the pre-PSD. Although both PP1α and PP1γ1 were concentrated in the PSD, the overall distribution of PP1γ1 was more focused to the PSD. The distribution of gold particles produced by labeling for the two isoforms was compared by χ2 analysis after normalization of PP1α so that the areas sampled for each bin are identical. The relative distribution of gold particles following immunolabeling for PP1α and PP1γ1 differed significantly across the spine (χ2 = 22.265; P = 0.0044). Post-hoc analysis revealed that PP1α had a greater number of gold particles in the pre-PSD than PP1γ1, while PP1γ1 had a greater number of gold particles in the PSD than PP1α. This analysis demonstrated that PP1α and PP1γ1 are not homogeneously distributed over the spine and suggests that the effects of PP1γ1 are predominately mediated within the PSD, while PP1α plays a significant role both deep to the PSD and on the presynaptic side of the PSD.
Figure 3.
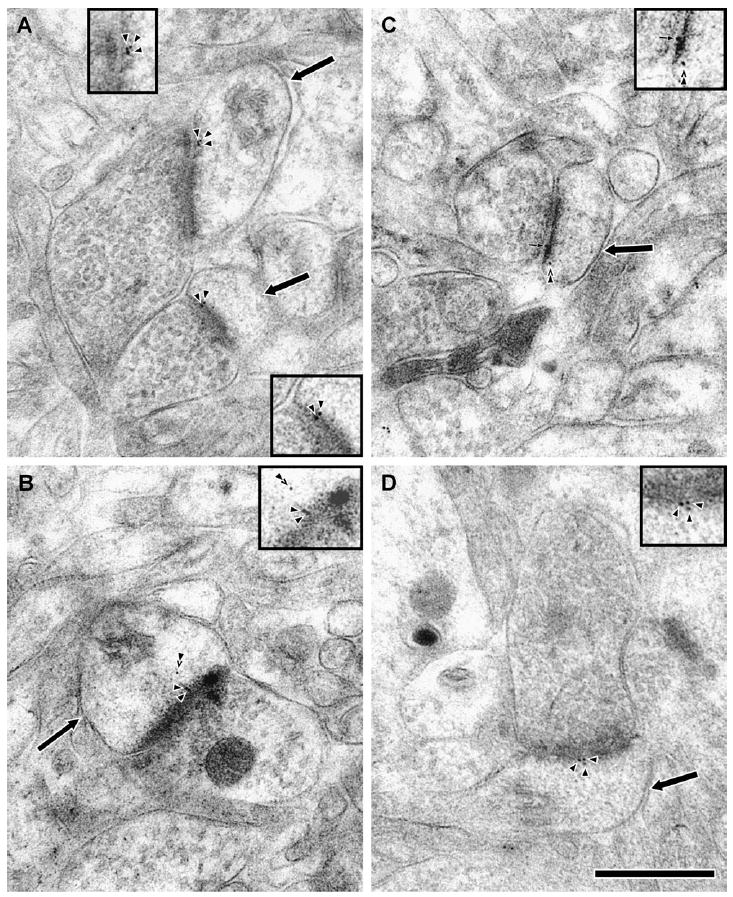
Electron micrographs of axospinous synapses in freeze-substituted material labeled for PP1α and PP1γ1 by post-embedding immunogold. Dendritic spines (arrows) receive asymmetric synapses from axon terminals. Immunoreactivity was revealed by 10 nm gold particles (arrowheads), and the insets show a magnified view of the gold particles. Gold particles labeling for PP1α (A, B) and PP1γ1 (D) were seen in the PSD. PP1α immunoreactivity was also commonly identified in deeper subjacent intraspinous domains (B and C, double arrowhead). PP1α labeling was also observed in the synaptic cleft (C, small arrow). The scale bar is 500 nm.
Figure 4.
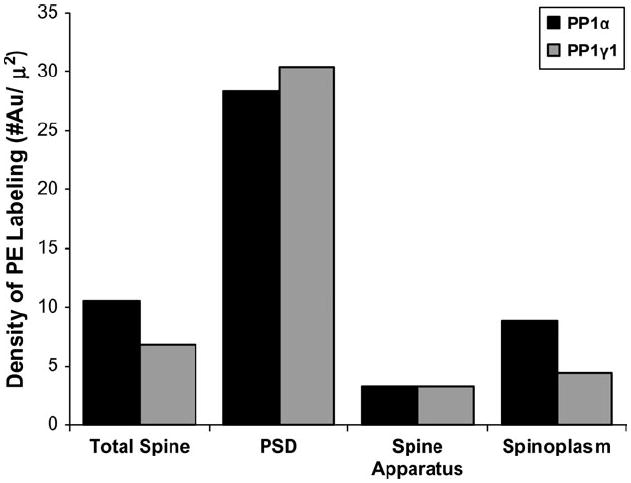
A histogram illustrating the density of gold label in different compartments within the dendritic spine. For PP1α, 207 gold-containing spines were analyzed; for PP1γ1, 130 gold-containing spines were analyzed. The gold density in the whole spine was calculated, and then each spine was divided into three different compartments: PSD, spine apparatus and remaining spinoplasm. The density of gold particles in the total spine and each compartment is plotted. Both isoforms show a relative enrichment of label in the PSD.
Figure 5.
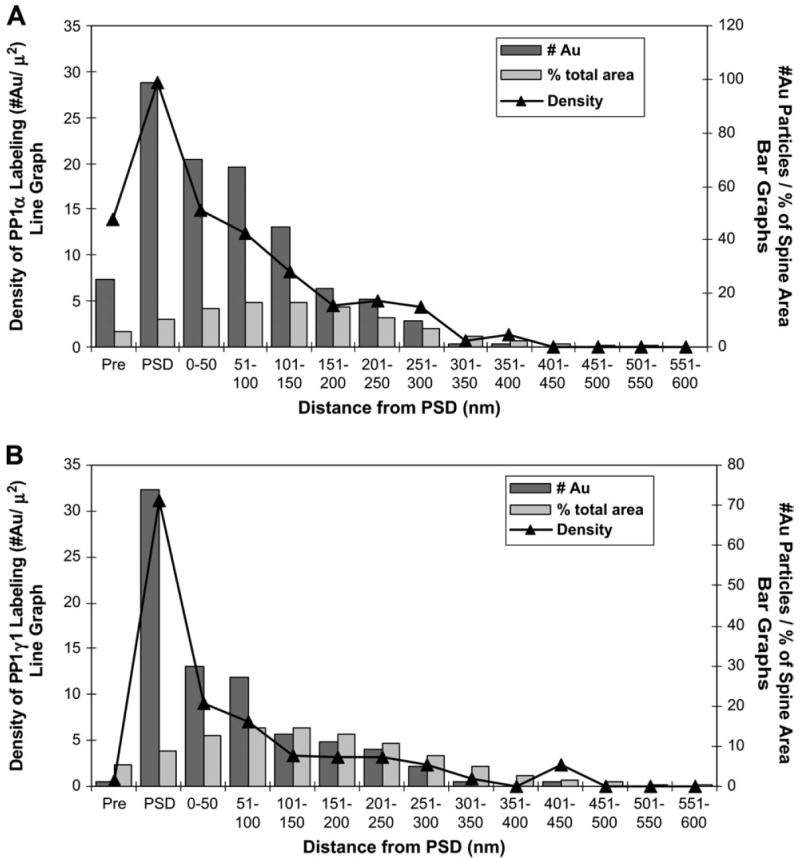
Graphs illustrating the distribution of immunogold labeling for PP1α (A) and PP1γ1 (B) within dendritic spines. A total of 207 spines containing immunogold label for PP1α and 130 spines containing immunogold label for PP1γ1 were divided into bins of 50 nm width, starting just below the PSD. In addition, a presynaptic bin consisting of the 25 nm immediately presynaptic to the PSD was drawn. For each spine, the area of PSD and each bin was determined, as well as the number of gold particles in each bin. These values were then summed across all the spines of the sample and the density of gold label in each bin was calculated. On these graphs, the number of gold particles in each bin is represented by the dark bars, and the fraction contributed by that bin to the total spine area is shown by the light bars (refer to right y-axis for both). The density of gold label in each bin is shown by the line graph (refer to left y-axis). For PP1α and PP1γ1, the highest density is seen in the PSD. However, PP1α label density remains relatively elevated in the 150 nm immediately subjacent to the PSD, whereas PP1γ1 label density falls dramatically in the 50 nm subjacent to the PSD and continues to decline to very low levels throughout the remainder of the spine. Strikingly, PP1α label density in the pre-PSD is almost as high as that found 50 nm subjacent to the PSD, while PP1γ1 label density in this same bin is less than one. No gold label was seen beyond 400 nm for PP1α and 450 nm for PP1γ1; however, as indicated by the light bars, this region contributed minimally to the total area of the sample and insufficient area may have been sampled to obtain a reliable estimate of PP1α and PP1γ1 density there.
The presence of high concentrations of PP1α labeling in the 25 nm presynaptic to the PSD was unexpected. The location of a gold particle may be up to 25 nm from the protein of interest, due to the size of the gold particle and the primary and secondary antibodies that couple to the antigen (Matsubara et al., 1996). However, the density of such label falls rapidly with distance from the antigen. Based on the studies of Matsubara et al (1996), the density in this pre-PSD bin should be no more than 23% of the density in the PSD. We observed PP1α label that was 48% of the density in the PSD, raising the possibility of a second source of PP1α, such as the presynaptic membrane. PP1α is relatively infrequent in axon terminals (Fig. 2), and the density of gold label is much less. Of the 248 labeled axospinous synapses, the density of gold over the terminal was 1.32 per μm2, compared with 10.59 for the spines. To determine if the presynaptic membrane was a site with particularly high concentrations of PP1α label, we analyzed the 86 terminals that contained gold label from our sample of 248 labeled axospinous synapses (Fig. 6). We divided the terminal into a presynaptic region that included the area inside the terminal within 25 nm from the plasma membrane immediately adjacent to the PSD and a second region that consisted of the rest of the terminal. The density of PP1α gold label in the presynaptic region is ~6 times higher than that seen in the terminal as a whole (Fig. 7). Analysis of the 39 axon terminals that contained PP1γ1 gold label from our sample of 163 labeled axospinous synapses showed a similar but less pronounced enrichment in the presynaptic region. The density of PP1γ1 gold label in the presynaptic region was ~3 times higher than that seen in the rest of the axon terminal (Fig. 7). These analyses suggest that the PP1α gold label in the synaptic cleft may be due to PP1α found in the PSD and presynaptic membrane. However, PP1γ1 is similarly enriched in these areas but only contains one gold particle in the cleft, compared with 16 gold particles for PP1α. Thus, our analyses cannot exclude the possibility of a PP1α-immunoreactive component in the synaptic cleft of axospinous synapses in the primate PFC.
Figure 6.
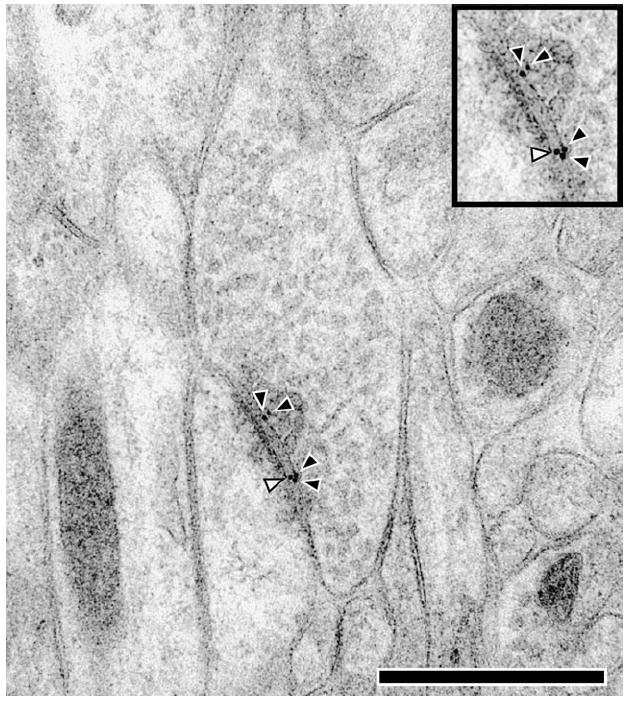
Electron micrograph of an axospinous synapse in freeze-substituted material labeled for PP1α with post-embedding immunogold. Gold particles were unexpectedly seen in the synaptic cleft (white arrowhead). When the terminal contained gold particles, they were most commonly identified on the presynaptic membrane or within the 25 nm subjacent (black arrowheads). The scale bar is 500 nm.
Figure 7.
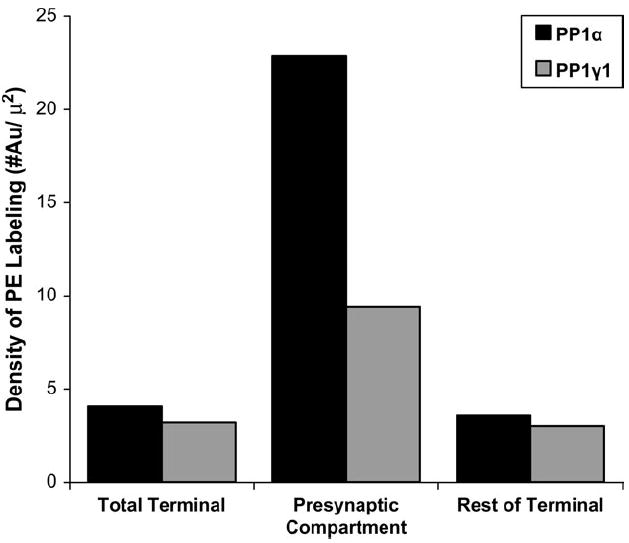
A histogram illustrating a total of 86 PP1α- and 39 PP1γ1- labeled terminals. Each terminal was divided into a presynaptic bin consisting of the 25 nm wide region adjacent to the presynaptic membrane and the remainder of the terminal. The density of label was calculated in the total terminal and each bin. The density of PP1α and PP1γ1 in the total terminal (4.05 gold particles/μm2, 3.17 gold particles/μm2 for PP1α and PP1γ1 respectively) was not substantially different from the density in the rest of the terminal (3.59 gold particles/μm2, 3.00 gold particles/μm2). The density of PP1α in the presynaptic compartment (22.87 gold particles/μm2) is ~6 times the density of PP1α in the remainder of the terminal. The density of PP1γ1 in the presynaptic compartment (9.38 gold particles/μm2) is ~3 times the density of the remainder of the terminal.
Discussion
This study represents an ultrastructural analysis that compares the neuronal localization of the three most prominent PP1 isoforms, PP1α, PP1γ1 and PP1β, in primate PFC. This study is also the first to examine the precise intraspinous localization of PP1α and PP1γ1. All three PP1 isoforms were observed in dendritic spines, dendritic shafts, axon terminals, pre-terminal axons and glia. However, PP1β was found predominately in dendritic shafts, while PP1α and PP1γ1 were mainly identified in dendritic spines. Post-embedding immunogold labeling revealed a different intraspinous distribution of PP1α and PP1γ1 (Fig. 8). PP1α has a more extensive distribution, with its peak density in the PSD but a significant amount of labeling in the pre-PSD and the 150 nm subjacent to the PSD. PP1γ1, on the other hand, is concentrated in the PSD, with little to none found either subjacent or presynaptic to the PSD.
Figure 8.
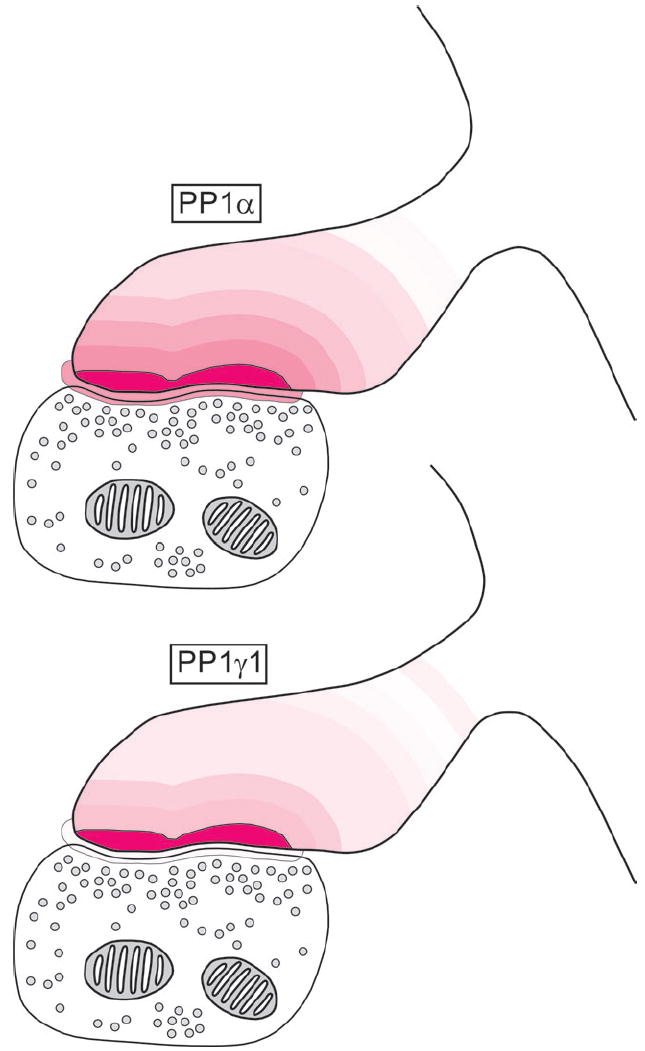
Summary of the density of PP1α and PP1γ1 immunoreactivity in spines of monkey PFC. For each protein, the model axospinous synapse is binned and each bin is given the identical color. The density of labeling in each bin is indicated by setting the transparency of the color to the percentage of the maximum density observed for each protein (PSD for both). For example, for PP1α the PSD is indicated by 100% color opacity, while the bin from 1–50 nm is indicated by 51.35% color opacity to reflect their gold labeling densities of 28.89 and 14.83 gold particles/μm2 respectively.
Localization of PP1 Isoforms in the Neuropil of PFC
Dendritic spines are the most frequently labeled neuropil elements for PP1α and PP1γ1 and the least frequent profile identified with PP1β immunoreactivity. Targeting of PP1 is accomplished by a variety of scaffolding proteins, two of which, spinophilin and neurabin, are also specifically enriched in spines (Muly et al., 2004a,b) and selectively bind PP1α and PP1γ1 over PP1β (MacMillan et al., 1999; Terry-Lorenzo et al., 2002; Carmody et al., 2004). It seems likely that the localization of spinophilin and neurabin underlies the selective localization of PP1α and PP1γ1, but not PP1β, to dendritic spines. PP1β was most commonly identified in dendritic shafts, whose major cytoskeletal element is the microtubule, and PP1 has been shown to associate with microtubules via the microtubule-associated protein tau (Liao et al., 1998). The localization of PP1β using immunofluorescent microscopy in cortical neuronal culture and subcellular fractionation has shown a preferential association of PP1β with microtubules (Strack et al., 1999). The anatomical data presented here and in Strack et al. (1999) suggest PP1β as the most likely isoform to interact with tau which may result in its distinct localization to dendrites.
PP1α, PP1γ1 and PP1β were all identified in pre-terminal axons and axon terminals, as well as postsynaptic spines and dendrites. Axon terminals and pre-terminal axons comprised a larger percentage of PP1β-immunoreactive profiles than PP1α and PP1γ1. Accordingly, neurabin-immunoreactive presynaptic profiles were also infrequently identified, and spinophilin is not found in axon terminals and rarely encountered in pre-terminal axons. However, the PP1 binding partner myosin phosphatase targeting subunit (MYPT1) is enriched in axons and nucleoli, co-immunoprecipitates with the synaptic vesicle marker synaptophysin and preferentially binds PP1β (Lontay et al., 2004). Thus, the relative enrichment in presynaptic elements of PP1β compared with PP1α and PP1γ1 is likely influenced by the relative lack of spinophilin and neurabin combined with the enrichment of MYPT. Alternatively, unidentified PP1β isoform-selective PP1 scaffolding proteins may play a role.
Localization of PP1α and PP1γ1 at Axospinous Synapses
In examining the localization patterns of PP1α and PP1γ1 using post-embedding techniques, we show that although both are highly concentrated in dendritic spines, their distributions within the spine are distinct. PP1α, and particularly PP1γ1, are concentrated in the PSD, but PP1α is also found both presynaptic and subjacent to the PSD. The intraspinous localization of spinophilin (Muly et al., 2004b) and neurabin (Muly et al., 2004a) has also been studied in detail, and the distributions of the two scaffolding proteins within spines are virtually identical, with high densities from the PSD through the 100 nm subjacent to the PSD. Comparison of these distributions suggests that spinophilin and neurabin are likely bound to PP1α and PP1γ1 in the PSD, but that only some of the spinophilin and neurabin in the 100 nm subjacent to the PSD is bound to PP1α and PP1γ1; and the distribution of the PP1 isoforms implicates PP1α as the most likely isoform bound to spinophilin and neurabin in this area of the spine.
There are several possible reasons for the contrasting distributions between scaffolding protein and PP1 isoform. Neurabin phosphorylation within its PP1 binding domain has been shown to decrease its PP1α binding ability (McAvoy et al., 1999; Oliver et al., 2002). The phosphorylation of spinophilin has also been shown to alter its subcellular localization away from the PSD, although in this case there is no obvious effect of phosphorylation on its PP1α binding ability (Hsieh-Wilson et al., 2003; Grossman et al., 2004). Thus the different sub-PSD pools of neurabin and spinophilin may influence the localization of PP1. Future studies on alterations in spinophilin and neurabin PP1 isoform binding preference due to phosphorylation and localization changes in neurabin due to phosphorylation will give insight to the differential distributions of PP1α and PP1γ1.
Other possible contributors to the localization patterns of PP1α and PP1γ1 are binding of PP1 isoforms to cellular elements such as the spine apparatus and targeting by other PP1 scaffolding proteins like yotiao (Lin et al., 1998; Westphal et al., 1999) and NF-L (Terry-Lorenzo et al., 2000). PP1α has been shown to directly interact with the neuronal type 1 inositol (1,4,5)-trisphosphate receptors (InsP3R1s) (Tang et al., 2003), and PP1 also interacts with InsP3R1s via yotiao (Tu et al., 2004). Our results do not indicate an enrichment of PP1α in the spine apparatus, but this element is not easily visualized in freeze-substituted material. It is possible that the association of PP1α with InsP3R1s and its targeting to InsP3R1s via yotiao contributes to its wider distribution within the spine. Additional studies on the localization patterns of yotiao and NF-L may give a more complete picture of the role of phosphatase targeting in signal transduction.
The unexpected identification of PP1α in the synaptic cleft led to further analysis of PP1α and PP1γ1 labeling in axon terminals forming axospinous synapses. Although immunoperoxidase axon terminal labeling for PP1α and PP1γ1 is low, post-embedding immunogold labeling for PP1α, and to a lesser degree PP1γ1, is enriched on and very near to the presynaptic membrane. It seems likely that the cleft labeling observed for PP1α and PP1γ1 is due to the high concentrations of protein in the PSD and the presynaptic membrane of the axon terminal. However, we cannot exclude the possibility that PP1α is found in the cleft.
Functional Implications
Our finding that PP1 is distributed in an isoform-specific pattern has a number of implications. PP1 has been shown to modulate many critical neuronal signaling proteins as well as metabolic and nuclear functions. PP1α and PP1γ1 are predominately located in dendritic spines, which are the principal sites for excitatory synapses in the CNS (Gray, 1959; Harris, 1999). The enrichment of PP1α and PP1γ1 in dendritic spines suggests they may be engaged more extensively in postsynaptic mechanisms of neurotransmission than PP1β. Additionally, the post-embedding data presented here suggest that the actions of PP1γ1 may be limited to the PSD, whereas PP1α is positioned to dephosphorylate substrates both in the PSD and deeper within the spine.
All three isoforms were present in axon terminals, suggesting that they may regulate presynaptic mechanisms of neurotransmission. PP1β is the principal PP1 isoform recruited by MYPT1, which interacts and colocalizes with synaptophysin, an integral membrane protein located in synaptic vesicles (Lontay et al., 2004). Interestingly, MYPT1 also co-precipitates with non-β isoforms of PP1 (Lontay et al., 2004), and we have shown that PP1α is particularly enriched in the area of an axon terminal that would contain the vesicle fusion machinery.
Localization of PP1 via scaffolding proteins greatly influences its substrate pool, and the differential localization of PP1α, PP1γ1 and PP1β indicates isoform-specific scaffolding protein binding. Additionally, PP1 isoforms may also contain an intrinsic determinant of substrate specificity, adding to the complexity of neuronal signaling. Further research on PP1 targeting proteins and possible intrinsic functional differences between the PP1 isoforms will inform this emerging picture of neuronal signal transduction.
Acknowledgments
Notes The authors gratefully acknowledge the excellent technical assistance of Maney Mazloom. This work was supported by MH01194, MH40899, DA10044, ND37423, RR00165, NS37508 and the Peter Jay Sharp Foundation.
References
- Aggen JB, Nairn AC, Chamberlin R. Regulation of protein phosphatase-1. Chem Biol. 2000;7:R13–23. doi: 10.1016/s1074-5521(00)00069-7. [DOI] [PubMed] [Google Scholar]
- Allen PB, Ouimet CC, Greengard P. Spinophilin, a novel protein phosphatase 1 binding protein localized to dendritic spines. Proc Natl Acad Sci USA. 1997;94:9956–9961. doi: 10.1073/pnas.94.18.9956. [DOI] [PMC free article] [PubMed] [Google Scholar]
- Amador FC, Henriques AG, da Cruz ESOA, da Cruz ESEF. Monitoring protein phosphatase 1 isoform levels as a marker for cellular stress. Neurotoxicol Teratol. 2004;26:387–395. doi: 10.1016/j.ntt.2003.12.007. [DOI] [PubMed] [Google Scholar]
- Carmody LC, Bauman PA, Bass MA, Mavila N, DePaoli-Roach AA, Colbran RJ. A protein phosphatase-1gamma1 isoform selectivity determinant in dendritic spine-associated neurabin. J Biol Chem. 2004;279:21714–21723. doi: 10.1074/jbc.M402261200. [DOI] [PubMed] [Google Scholar]
- Ceulemans H, Bollen M. Functional diversity of protein phosphatase-1, a cellular economizer and reset button. Physiol Rev. 2004;84:1–39. doi: 10.1152/physrev.00013.2003. [DOI] [PubMed] [Google Scholar]
- Cohen PT. Protein phosphatase 1 — targeted in many directions. J Cell Sci. 2002;115:241–256. doi: 10.1242/jcs.115.2.241. [DOI] [PubMed] [Google Scholar]
- Colbran RJ. Protein phosphatases and calcium/calmodulin-dependent protein kinase II-dependent synaptic plasticity. J Neurosci. 2004;24:8404–8409. doi: 10.1523/JNEUROSCI.3602-04.2004. [DOI] [PMC free article] [PubMed] [Google Scholar]
- da Cruz e Silva EF, Fox CA, Ouimet CC, Gustafson E, Watson SJ, Greengard P. Differential expression of protein phosphatase 1 isoforms in mammalian brain. J Neurosci. 1995;15:3375–3389. doi: 10.1523/JNEUROSCI.15-05-03375.1995. [DOI] [PMC free article] [PubMed] [Google Scholar]
- Flores-Hernandez J, Hernandez S, Snyder GL, Yan Z, Fienberg AA, Moss SJ, Greengard P, Surmeier DJ. D(1) dopamine receptor activation reduces GABA(A) receptor currents in neostriatal neurons through a PKA/DARPP-32/PP1 signaling cascade. J Neurophysiol. 2000;83:2996–3004. doi: 10.1152/jn.2000.83.5.2996. [DOI] [PubMed] [Google Scholar]
- Gray EG. Axo-somatic and axo-dendritic synapses of the cerebral cortex: an electron microscope study. J Anat. 1959;93:420–433. [PMC free article] [PubMed] [Google Scholar]
- Greengard P, Allen PB, Nairn AC. Beyond the dopamine receptor: the DARPP-32/protein phosphatase-1 cascade. Neuron. 1999;23:435–447. doi: 10.1016/s0896-6273(00)80798-9. [DOI] [PubMed] [Google Scholar]
- Grossman SD, Futter M, Snyder GL, Allen PB, Nairn AC, Greengard P, Hsieh-Wilson LC. Spinophilin is phosphorylated by Ca2+/calmodulin-dependent protein kinase II resulting in regulation of its binding to F-actin. J Neurochem. 2004;90:317–324. doi: 10.1111/j.1471-4159.2004.02491.x. [DOI] [PubMed] [Google Scholar]
- Harris KM. Structure, development, and plasticity of dendritic spines. Curr Opin Neurobiol. 1999;9:343–348. doi: 10.1016/s0959-4388(99)80050-6. [DOI] [PubMed] [Google Scholar]
- Hsieh-Wilson LC, Benfenati F, Snyder GL, Allen PB, Nairn AC, Greengard P. Phosphorylation of spinophilin modulates its interaction with actin filaments. J Biol Chem. 2003;278:1186–1194. doi: 10.1074/jbc.M205754200. [DOI] [PubMed] [Google Scholar]
- Kieval JZ, Hubert GW, Charara A, Pare JF, Smith Y. Subcellular and subsynaptic localization of presynaptic and postsynaptic kainate receptor subunits in the monkey striatum. J Neurosci. 2001;21:8746–8757. doi: 10.1523/JNEUROSCI.21-22-08746.2001. [DOI] [PMC free article] [PubMed] [Google Scholar]
- Liao H, Li Y, Brautigan DL, Gundersen GG. Protein phosphatase 1 is targeted to microtubules by the microtubule-associated protein Tau. J Biol Chem. 1998;273:21901–21908. doi: 10.1074/jbc.273.34.21901. [DOI] [PubMed] [Google Scholar]
- Lin JW, Wyszynski M, Madhavan R, Sealock R, Kim JU, Sheng M. Yotiao, a novel protein of neuromuscular junction and brain that interacts with specific splice variants of NMDA receptor subunit NR1. J Neurosci. 1998;18:2017–2027. doi: 10.1523/JNEUROSCI.18-06-02017.1998. [DOI] [PMC free article] [PubMed] [Google Scholar]
- Lontay B, Serfozo Z, Gergely P, Ito M, Hartshorne DJ, Erdodi F. Localization of myosin phosphatase target subunit 1 in rat brain and in primary cultures of neuronal cells. J Comp Neurol. 2004;478:72–87. doi: 10.1002/cne.20273. [DOI] [PubMed] [Google Scholar]
- MacMillan LB, Bass MA, Cheng N, Howard EF, Tamura M, Strack S, Wadzinski BE, Colbran RJ. Brain actin-associated protein phosphatase 1 holoenzymes containing spinophilin, neurabin, and selected catalytic subunit isoforms. J Biol Chem. 1999;274:35845–35854. doi: 10.1074/jbc.274.50.35845. [DOI] [PubMed] [Google Scholar]
- Malchiodi-Albedi F, Petrucci TC, Picconi B, Iosi F, Falchi M. Protein phosphatase inhibitors induce modification of synapse structure and tau hyperphosphorylation in cultured rat hippocampal neurons. J Neurosci Res. 1997;48:425–438. [PubMed] [Google Scholar]
- Matsubara A, Laake JH, Davanger S, Usami S, Ottersen OP. Organization of AMPA receptor subunits at a glutamate synapse: a quantitative immunogold analysis of hair cell synapses in the rat organ of Corti. J Neurosci. 1996;16:4457–4467. doi: 10.1523/JNEUROSCI.16-14-04457.1996. [DOI] [PMC free article] [PubMed] [Google Scholar]
- McAvoy T, Allen PB, Obaishi H, Nakanishi H, Takai Y, Greengard P, Nairn AC, Hemmings HC., Jr Regulation of neurabin I interaction with protein phosphatase 1 by phosphorylation. Biochemistry. 1999;38:12943–12949. doi: 10.1021/bi991227d. [DOI] [PubMed] [Google Scholar]
- Morishita W, Connor JH, Xia H, Quinlan EM, Shenolikar S, Malenka RC. Regulation of synaptic strength by protein phosphatase 1. Neuron. 2001;32:1133–1148. doi: 10.1016/s0896-6273(01)00554-2. [DOI] [PubMed] [Google Scholar]
- Mulkey RM, Endo S, Shenolikar S, Malenka RC. Involvement of a calcineurin/inhibitor-1 phosphatase cascade in hippocampal long-term depression. Nature. 1994;369:486–488. doi: 10.1038/369486a0. [DOI] [PubMed] [Google Scholar]
- Muly EC, Greengard P, Goldman-Rakic PS. Distribution of protein phosphatases-1 alpha and -1 gamma 1 and the D(1) dopamine receptor in primate prefrontal cortex: evidence for discrete populations of spines. J Comp Neurol. 2001;440:261–270. doi: 10.1002/cne.1384. [DOI] [PubMed] [Google Scholar]
- Muly EC, Allen P, Mazloom M, Aranbayeva Z, Greenfield AT, Greengard P. Subcellular distribution of neurabin immunolabeling in primate prefrontal cortex: comparison with spinophilin. Cereb Cortex. 2004a;14:1398–1407. doi: 10.1093/cercor/bhh101. [DOI] [PubMed] [Google Scholar]
- Muly EC, Smith Y, Allen P, Greengard P. Subcellular distribution of spinophilin immunolabeling in primate prefrontal cortex: localization to and within dendritic spines. J Comp Neurol. 2004b;469:185–197. doi: 10.1002/cne.11001. [DOI] [PubMed] [Google Scholar]
- Muly EC, Szigeti K, Goldman-Rakic PS. D1 receptor in interneurons of macaque prefrontal cortex: distribution and subcellular localization. J Neurosci. 1998;18:10553–10565. doi: 10.1523/JNEUROSCI.18-24-10553.1998. [DOI] [PMC free article] [PubMed] [Google Scholar]
- Nakanishi H, Obaishi H, Satoh A, Wada M, Mandai K, Satoh K, Nishioka H, Matsuura Y, Mizoguchi A, Takai Y. Neurabin: a novel neural tissue-specific actin filament-binding protein involved in neurite formation. J Cell Biol. 1997;139:951–961. doi: 10.1083/jcb.139.4.951. [DOI] [PMC free article] [PubMed] [Google Scholar]
- Oliver CJ, Terry-Lorenzo RT, Elliott E, Bloomer WA, Li S, Brautigan DL, Colbran RJ, Shenolikar S. Targeting protein phosphatase 1 (PP1) to the actin cytoskeleton: the neurabin I/PP1 complex regulates cell morphology. Mol Cell Biol. 2002;22:4690–4701. doi: 10.1128/MCB.22.13.4690-4701.2002. [DOI] [PMC free article] [PubMed] [Google Scholar]
- Ouimet CC, da Cruz e Silva EF, Greengard P. The alpha and gamma 1 isoforms of protein phosphatase 1 are highly and specifically concentrated in dendritic spines. Proc Natl Acad Sci USA. 1995;92:3396–3400. doi: 10.1073/pnas.92.8.3396. [DOI] [PMC free article] [PubMed] [Google Scholar]
- Peters A, Palay SL, Webster HD. The fine structure of the nervous system: neurons and their supporting cells. New York: Oxford University Press; 1991. [Google Scholar]
- Price NE, Mumby MC. Brain protein serine/threonine phosphatases. Curr Opin Neurobiol. 1999;9:336–342. doi: 10.1016/s0959-4388(99)80049-x. [DOI] [PubMed] [Google Scholar]
- Snyder GL, Fienberg AA, Huganir RL, Greengard P. A dopamine/D1 receptor/protein kinase A/dopamine- and cAMP-regulated phosphoprotein (Mr 32 kDa)/protein phosphatase-1 pathway regulates dephosphorylation of the NMDA receptor. J Neurosci. 1998;18:10297–10303. doi: 10.1523/JNEUROSCI.18-24-10297.1998. [DOI] [PMC free article] [PubMed] [Google Scholar]
- Snyder GL, Allen PB, Fienberg AA, Valle CG, Huganir RL, Nairn AC, Greengard P. Regulation of phosphorylation of the GluR1 AMPA receptor in the neostriatum by dopamine and psychostimulants in vivo. J Neurosci. 2000;20:4480–4488. doi: 10.1523/JNEUROSCI.20-12-04480.2000. [DOI] [PMC free article] [PubMed] [Google Scholar]
- Strack S, Kini S, Ebner FF, Wadzinski BE, Colbran RJ. Differential cellular and subcellular localization of protein phosphatase 1 isoforms in brain. J Comp Neurol. 1999;413:373–384. [PubMed] [Google Scholar]
- Surmeier DJ, Bargas J, Hemmings HC, Jr, Nairn AC, Greengard P. Modulation of calcium currents by a D1 dopaminergic protein kinase/phosphatase cascade in rat neostriatal neurons. Neuron. 1995;14:385–397. doi: 10.1016/0896-6273(95)90294-5. [DOI] [PubMed] [Google Scholar]
- Takizawa N, Mizuno Y, Komatsu M, Matsuzawa S, Kawamura T, Inagaki N, Inagaki M, Kikuchi K. Alterations in type-1 serine/threonine protein phosphatase PP1alpha in response to B-cell receptor stimulation. J Biochem (Tokyo) 1997;122:730–737. doi: 10.1093/oxfordjournals.jbchem.a021816. [DOI] [PubMed] [Google Scholar]
- Tang TS, Tu H, Wang Z, Bezprozvanny I. Modulation of type 1 inositol (1,4,5)-trisphosphate receptor function by protein kinase a and protein phosphatase 1alpha. J Neurosci. 2003;23:403–415. doi: 10.1523/JNEUROSCI.23-02-00403.2003. [DOI] [PMC free article] [PubMed] [Google Scholar]
- Terry-Lorenzo RT, Inoue M, Connor JH, Haystead TA, Armbruster BN, Gupta RP, Oliver CJ, Shenolikar S. Neurofilament-L is a protein phosphatase-1-binding protein associated with neuronal plasma membrane and post-synaptic density. J Biol Chem. 2000;275:2439–2446. doi: 10.1074/jbc.275.4.2439. [DOI] [PubMed] [Google Scholar]
- Terry-Lorenzo RT, Carmody LC, Voltz JW, Connor JH, Li S, Smith FD, Milgram SL, Colbran RJ, Shenolikar S. The neuronal actin-binding proteins, neurabin I and neurabin II, recruit specific isoforms of protein phosphatase-1 catalytic subunits. J Biol Chem. 2002;277:27716–27724. doi: 10.1074/jbc.M203365200. [DOI] [PubMed] [Google Scholar]
- Tu H, Tang TS, Wang Z, Bezprozvanny I. Association of type 1 inositol 1,4,5-trisphosphate receptor with AKAP9 (yotiao) and protein kinase A. J Biol Chem. 2004;279:19375–19382. doi: 10.1074/jbc.M313476200. [DOI] [PubMed] [Google Scholar]
- Walker A. A cytoarchitectural study of the prefrontal area of the macaque monkey. J Comp Neurol. 1940;73:59–86. [Google Scholar]
- Westphal RS, Tavalin SJ, Lin JW, Alto NM, Fraser ID, Langeberg LK, Sheng M, Scott JD. Regulation of NMDA receptors by an associated phosphatase-kinase signaling complex. Science. 1999;285:93–96. doi: 10.1126/science.285.5424.93. [DOI] [PubMed] [Google Scholar]
- Yan Z, Hsieh-Wilson L, Feng J, Tomizawa K, Allen PB, Fienberg AA, Nairn AC, Greengard P. Protein phosphatase 1 modulation of neostriatal AMPA channels: regulation by DARPP-32 and spinophilin. Nat Neurosci. 1999;2:13–17. doi: 10.1038/4516. [DOI] [PubMed] [Google Scholar]
- Zhen X, Torres C, Wang HY, Friedman E. Prenatal exposure to cocaine disrupts D1A dopamine receptor function via selective inhibition of protein phosphatase 1 pathway in rabbit frontal cortex. J Neurosci. 2001;21:9160–9167. doi: 10.1523/JNEUROSCI.21-23-09160.2001. [DOI] [PMC free article] [PubMed] [Google Scholar]