

Abstract
Mycotoxins are toxic secondary metabolites produced by certain molds and are common contaminants of many important food crops, such as grains, nuts, and spices. Some mycotoxins are found in fruits, vegetables, and botanical roots. These contaminants have a broad range of toxic effects, including carcinogenicity, immunotoxicity, neurotoxicity, and reproductive and developmental toxicity. The public health concerns related to both acute and chronic effects of mycotoxins in animals have prompted more than 100 countries to establish regulatory limits for some of the well-known mycotoxins, such as the aflatoxins (AFL). Our research focused on method development for 2 of these toxins, AFL and ochratoxin A (OTA), in ginseng and other selected botanical roots. Methods using an immunoaffinity column (IAC) cleanup, liquid chromatographic separation, and fluorescence detection were modified and evaluated. Two types of IAC cleanup were evaluated: IAC for AFL, and IAC for both AFL and OTA. Three derivatization techniques to enhance the fluorescence of the AFL were compared: precolumn trifluoroacetic acid, postcolumn bromination, and postcolumn ultraviolet irradiation. No derivatization was needed for OTA. Results for AFL using the single analyte IAC cleanup and the 3 derivatization techniques were all comparable for ginseng and for other roots such as ginger, licorice, and kava-kava. Recoveries of added AFL for ginseng at levels from 2 to 16 ng/g were about 80%. Using IAC cleanup for both AFL and OTA recoveries of added AFL for ginseng at 4–16 ng/g were about 70%, and for ginger, licorice, and kava-kava were about 60%. Recoveries of added OTA for ginseng, ginger, and echinacea at 4 ng/g were about 55%.
Many herbs are imported from countries where quality control may be deficient. The materials may be moldy due to exposure to adverse weather conditions, insect damage, improper harvesting procedures, transportation, inadequate drying, and poor storage facilities. The growing mold may produce toxic secondary metabolites, such as mycotoxins. Among hundreds of fungal secondary metabolites, 5 mycotoxins are of major health concern for humans and domestic animals: aflatoxins (AFL), deoxynivalenol, fumonisins (FB), ochratoxin A (OTA), and zearalenone (1). AFL consist of 4 structurally related compounds: the aflatoxins B1 (AFB1), B2 (AFB2), G1 (AFG1), and G2 (AFG2). More than 35 types of food products in the marketplace have been reported to be contaminated with AFL or metabolites of AFL. These include tree nuts, peanuts, figs, melon seed, pumpkin seed, sesame seed, sunflower seed, lotus seed, coix seed, red pepper, white pepper, nutmeg, paprika, mixed spice, rice, corn, mixed cereals, chilies, and copra (2). AFL have been found in herbs and spices at levels ranging from less than 10 to 51 ng/g (3). In another report, AFL were found in ginseng samples at levels ranging from 0.2 to 15 ng/g (4). OTA has been found in many cereals, raisins, cocoa products, green coffee beans, wine, soybeans, grape juice, pork sausages (5), spices, and herbs (6).
The International Agency for Research on Cancer (IARC; 7) has classified AFB1 as a human carcinogen and OTA as a possible human carcinogen. Our research focused on methods for AFL and OTA in botanical roots, specifically ginseng. Ginseng is one of the most widely sold herbs in the United States and has been used for over 3000 years for its medicinal and adaptogenic properties. There are 2 plant species labeled as ginseng: American ginseng (Panax quinquefolius), a species native to and primarily grown in the United States; and Asian ginseng (Panax ginseng), more commonly grown in Korea, Japan, and China.
Many analytical methods have been developed for AFL and OTA. These include chromatographic techniques such as thin-layer chromatography (TLC), liquid chromatography (LC), and immunoaffinity-based methods, such as enzyme-linked immunosorbent assay (ELISA) and immunoaffinity column (IAC) LC. These methods are applicable primarily to grain and grain products, but some are applicable to body fluids and animal tissues (8, 9). The methods can give unreliable results when applied to new types of products. The very limited surveys of mycotoxin contamination in some herbal products thus far published are sketchy (3, 5,10). No detailed information on the methods is described, and the number of samples analyzed is limited. For the most part, no attempts were made to confirm the results by appropriate techniques.
Because the IAC is more environmental- and user-friendly (11), it was selected as a cleanup column for this project. The IAC has the capability to isolate and purify the toxins that were then separated and quantified by reverse-phase LC without derivatization for OTA but with precolumn and postcolumn derivatization for AFL with fluorescence detection.
In this study, 2 types of IAC were evaluated: IAC for AFL (IAC/AFL; contains antibodies specific to AFL) and IAC for AFL and OTA (IAC/AFL-OTA; contains antibodies specific to AFL and OTA). Three different derivatization techniques to produce the highly fluorescent derivatives AFB2a and AFG2a from the less fluorescent AFB1 and AFG1, respectively, using reverse-phase LC separation were compared: precolumn derivatization (preCD) with trifluoroacetic acid (TFA), and postcolumn derivatization (PCD) using a PHRED cell or Kobra cell. The PHRED produces AFB2a and AFG2a derivatives from AFB1 and AFG1 respectively, that are subjected to ultraviolet (UV) irradiation while passing through the reaction coil that wraps around the UV light. The Kobra cell generates bromine to produce the brominated derivatives of the AFB1 and AFG1.
Experimental
Plant Material
The finely ground ginseng (Panax quinquefolius) samples were purchased from Schumacher Ginseng (Marathon, WI). The finely ground Echinacea purpea, ginger (zingiber officinale), kava-kava (Piper methysticum), and licorice (glycyrrhiza glabra) samples were purchased from Penn Herb Co. (Philadelphia, PA).
Apparatus
Orbital shaker.—No. DS-500E (VWR International, Bridgeport, NJ).
Centrifuge tube.—50 mL, polypropylene.
Refrigerated centrifuge.—No. DS-500E (VWR International).
Solid-phase extraction (SPE) manifold.—12 ports (Alltech Associates).
Glass microfiber filter paper.—11 cm, No. 934AH (Whatman, Inc., Florham Park, NJ).
IAC.—Aflatest P column, Aflaochra Test column (Vicam, Watertown, MA).
Column reservoir.—15 mL polypropylene (Alltech Grace Davison).
LC system.—Model 2690 Alliance and Model 474 fluorescence detector (Waters Corp., Milford, MA). LC operating conditions.—Flow rate, 1.0 mL/min; detector for aflatoxins set at excitation wavelength (Ex) 362 nm, emission wavelength (Em) 440 nm, for OTA set at Ex 333 nm. Em 460 nm; column: for aflatoxins, Waters AQ12S031546WT, YMC ODS-AQ S-3, 4.6 × 150 nm; for OTA, Beckman No. 235332, Utrasphere, 4.6 × 250 mm, 5 μm (Beckman Instruments, Inc., Fullerton, CA).
LC/mass spectrometry (LC/MS) system.—Micromass Quattro Micro triple-quadrupole mass spectrometer with an Agilent HPLC (Model 1100) electrospray ionization (ESI) source cooperated with the following conditions: source temperature 150°C, desolvation temperature 250°C, cone gas flow 208 L/h, desolvation gas flow 508 L/h; column. Phenomenex Luna 3 μL, 2 mm, C18; mobile phase, acetonitrile-water-acetic acid (50 + 50 + 1); flow rate. 0.230 mL/min.
PCD system.—PHRED cell (postcolumn photochemical derivatization cell; AURA Industries, New York, NY) and Kobra cell (postcolumn bromination derivatization cell; R-Biopharm Inc., Marshall, MI), set at 100 μA. (Caution: Do not turn on current until the LC pump is operating to avoid overheating the cell membrane.)
Reagents
(a) Solvents and reagents
LC grade methanol, acetonitrile, ACS grade acetic acid, NaCl, TFA; phosphate buffered saline (PBS), pH 7.4 (Sigma P-3813, Sigma-Aldrich, St. Louis, MO), and Tween 20 (Sigma P-5927).
(b) Extration solutions
Methanol PBS containing 1%Tween 20(8 + 2).
(c) AFL
A6636, A9887, A0138, A0263 (Sigma-Aldrich) Prepare stock standard solutions of each of the 4 AFL at 10μg/mL in acetonitrile according to revised AOAC Method 971.22 (12). Prepare an intermediate mixed standard solution to contain AFL at 400 ng/mL (B1, B2, G1, and G2 at 200, 50, 100, and 50 ng/mL) by adding appropriate amount of each aflatoxin stock standard to the same volumetric flask and diluting to volume with acetonitrile. Use the 400 ng/mL solution to prepare working standard solutions and to spike test samples for recovery study. Prepare working standard solutions with total AFL at 1, 2, 4, and 8 ng/mL by diluting the intermediate mixed standard solution with methanol–water (1 + 1).
(d) OTA standard solutions
OTA was isolated from cultures and purified in the U.S. Food and Drug Administration (FDA) laboratory. Prepare a stock standard solution at 100 μg/mL in methanol according to AOAC Method 973.37 (12). Prepare intermediate standard solutions at 200 and 20 ng/mL. Prepare working standards at 4, 2, 1, and 15 ng/mL by making serial dilution from the 20 ng/mL intermediate standard solution with methanol water (1 + 1). Use the 200 ng/mL OTA intermediate standard for recovery study.
(e) Mobile phase
Isocratic, 1 mL/min. For AFL precolumn derivatization, water acetonitrile methanol (60 + 25 + 15); for AFL postcolumn derivation with the Kobra cell, water–methanol–acetonitrile (620 + 220 + 160) + 350 μL 4 N nitric acid + 120 mg potassium bromide; for AFL postcolumn derivation with the PHRED cell, water– methanol–acetonitrile [600 + 250 +150); for OTA, acetonitrile–water–acetic acid [50 + 50+1).
(f) Derivatization reagent for AFL precolumn
Acetic acid–TFA–water (10 + 5 + 35).
Extraction of Samples
Weigh 5 g of test sample in a 50 mL centrifuge tube. Add 1 g NaCl and 25 mL of extraction solution, and shake at 300 rpm for 30 min. Centrifuge at standard acceleration of gravity (g) of 5323 mm/s2 (centrifuge set at 7000 rpm) at 10°C for 10 min. Pipet 7 mL into a 50 mL centrifuge, add 28 mL PBS mixture, and centrifuge again. Filter through glass microfiber paper. Collect 25 mL filtrate (equivalent to 1 g of test sample) into a 25 mL graduated cylinder and proceed immediately with IAC chromatography.
IAC Chromatography
Attach the IAC to the SPE manifold and connect a reservoir to the IAC. Add diluted test extract to the reservoir and pass through the IAC. Wash the column with 10 mL PBS followed by 10 mL water. Let the column run by gravity. Use a syringe to pass air through to dry the column for 1 s.
(a) Aflatest P column
(1) Precolumn derivatization
Remove the column and place in a 4 mL vial. Add 1.0 mL CH3CN to column directly. Collect eluate into a 4 mL vial. Collect in the same vial. Wait 1 min, add 1.0 mL CH3CN to the column again. Wait another 1 min and add 1.0 mL CH3CN. Push air through the column when the column stops dripping in order to collect the remaining eluate. Evaporate the eluate to dryness under a stream of nitrogen in a 50°C water bath. Add 200 μL CH3CN to the dry film. Mix on a Vortex mixer, add 300 μL derivatization reagent, cap, and mix. Place the vial in a 65°C heating block for 9 min. Remove from the heat, cool, add 500 μL water, and perform LC analysis. Prepare derivatives of aflatoxin standards by evaporating 1 mL of each working standards to dryness and follow the same procedure as for test samples.
(2) Postcolumn derivatization
Remove the column and place it in a 5 mL volumetric flask, making sure that the tip of the column is inside of the flask and the body of the column is slightly above the opening of the flask. Elute the column in the same manner as (a). Collect the eluate, add water, and dilute to the mark. Mix and perform LC analysis
(b) Aflaochra test column
Use the same procedure as for the Aflatest P column, except elute AFL and OTA from the column with methanol, collect the eluate in 5 mL volumetric flask, and dilute to mark with water. Perform LC analysis for OTA, and perform postcolumn derivatization LC analysis for AFL.
For OTA analysis, inject 50 μL reagent blank (50% methanol), working OTA standards, or test sample into the LC column. Identify the OTA peak in the test samples by comparing retention times (ca 8.7 min) with those of standards. Construct the standard curve. Determine the concentration of OTA in the test solution from the standard curve. If the test sample gives a response that is out of the range of the standard curve, dilute with acetonitrile-water or concentrate and reinject to bring the sample response within the range of standard curve.
For pre-CD of AFL, inject 50 μL reagent blank (50% acetonitrile), derivatives of aflatoxin working standards, or test sample into the LC column. Identify peaks of AFL test samples by comparing retention times with those of standards. Aflatoxins elute in the order G2a (derivative of G1), B2a (derivative of B1), G2, and B2 with retention times between ca 4 and 10 min and should be baseline resolved. Construct standard curves of each aflatoxin. Determine the concentration of each aflatoxin in a test solution from the standard curves.
For PCD of AFL, use the same LC procedure as for precolumn derivatization. Aflatoxins elute in the order AFG2, AFG2a, AFB2, and AFB2a with retention times between ca 10 and 20 min.
Calculations
Plot peak area (response, y-axis) of each toxin (OTA and each aflatoxin) standards against concentration (ng/mL, x-axis) and determine slope (S) and y-intercept (a). Calculate the level of toxin in the sample with the following formula if the injection volumes of the standards and test solutions are the same:
where R is the test solution peak area and V is the final volume (mL) of the injected test solution. W is 1 g test sample passed through the IAC. The level of total aflatoxins is the sum of the 4 aflatoxins.
Results
The extraction method for AFL in corn, peanuts, and peanut butter (8) was modified. The test sample size was reduced to 5 g because the botanical roots obtained from commercial sources were in a very fine powder form. The extraction solvent was methanol–PBS (8 + 2) containing 1% Tween 20, and the filtered extract was diluted with 1% Tween 20 in PBS before passing through the IAC to avoid clogging with colloidal particles.
Figure 1 shows liquid chromatograms of aflatoxin standards, and Figures 2 and 3 show chromatograms of naturally aflatoxin-contaminated ginseng extracts obtained by preCD and PCD bromination derivatization quantification. This root was purchased in a commercial market and showed mold growth on the surface. It was found to contain AFB1 at 14.8 ng/g and AFB2 at 0.4 ng/g. The disadvantage of using preCD is that it requires extra time for sample preparation prior to derivatization and for the derivatization. The PCD is free from interference and is less time-consuming.
Figure 1.
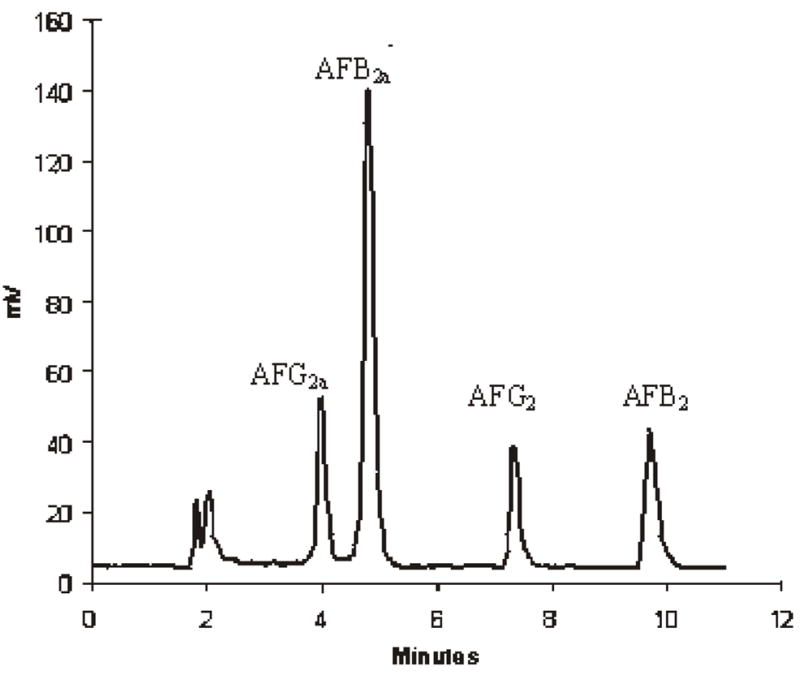
Chromatogram of added aflatoxins in ginseng (precolumn derivatization with TFA and water).
Figure 2.
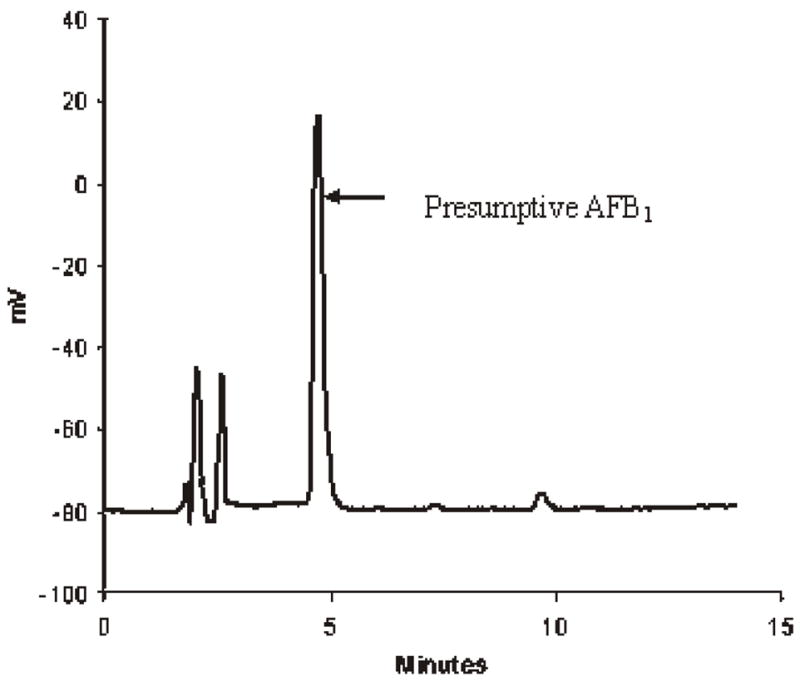
Chromatogram of presumptive AFB1 in ginseng (precolumn derivatization with TFA and water).
Figure 3.
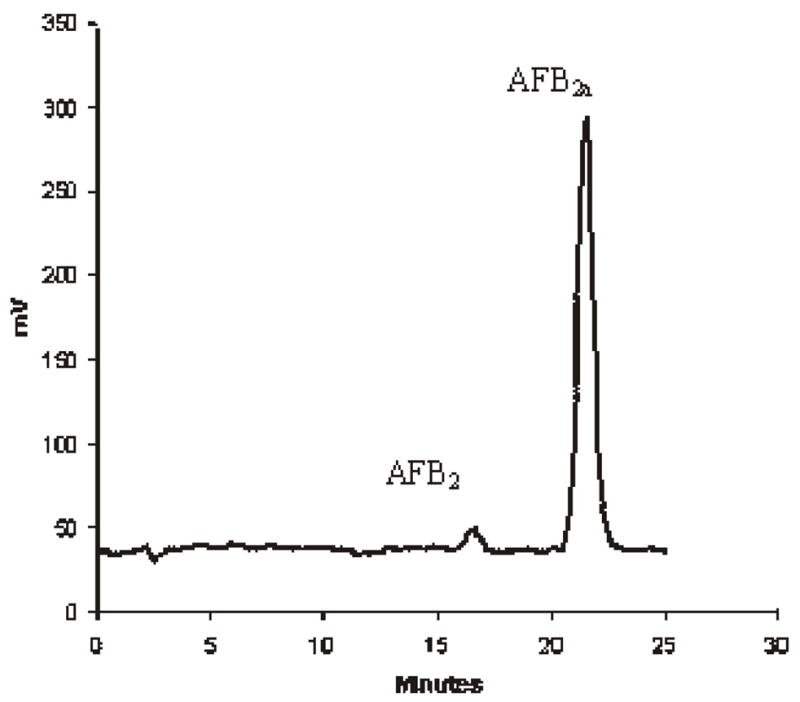
Chromatogram of AFB2a in ginseng (AFB1 derivative, postcolumn bromination derivatization) and AFB2.
Recoveries of AFL from ginseng using IAC cleanup for AFL at various levels with the 3 derivatization techniques are similar for various levels as shown in Table 1. The within-laboratory repeatability relative standard deviation (RSDr) values obtained using preCD are only slightly higher than those obtained using PCD. The RSDr values of the PCD/Kobra and PCD/PHRED are within the limit of the HorRat (13). Therefore, PCD/PHRED was used for AFL in other botanicals. Recoveries of AFB1, and AFG2, were all above 80%. Recoveries of AFB2 and AFG2 were about 60–70 and 40–50%, respectively. Tables 2 and 3 give recoveries of AFL and OTA in ginseng, ginger, and E. purpea using IAC for multitoxins, AFL, and OTA. In general, recoveries for AFL were 60–70% and for OTA were 50–60%.
Table 1.
Recovery of total aflatoxins added to ginseng and other botanical roots (Aflatest P IAC separation and isolation)
| Root | Procedure | AFL added, ng/g | AFL found, ng/g | Recovery, % | SDa | RSDrb |
|---|---|---|---|---|---|---|
| Ginseng | PreCDc | 0 | NDd | |||
| 2e | 1.8 | 90 | 3.5 | 3.9 | ||
| 4e | 3.1 | 77 | 6.3 | 8.1 | ||
| 8e | 7.3 | 91 | 6.3 | 6.7 | ||
| 16e | 13.2 | 83 | 1.7 | 2.1 | ||
| PCDf/Kobrag | 0 | ND | ||||
| 2e | 1.7 | 83 | 2.4 | 2.9 | ||
| 4e | 3.5 | 88 | 3.2 | 3.6 | ||
| 8h | 6.9 | 86 | 2.9 | 3.4 | ||
| PCD/PHREDi | 0 | ND | ||||
| 2e | 1.6 | 80 | 2.7 | 3.4 | ||
| 8h | 6.5 | 82 | 3.8 | 4.7 | ||
| Echinacea | PCD/PHRED | 0 | ND | |||
| 8e | 6.4 | 80 | 5.3 | 6.3 | ||
| Ginger | PCD/PHRED | 0 | ND | |||
| 4j | 3.2 | 81 | 2.5 | 3.1 | ||
| 8j | 6.3 | 79 | 5.5 | 7.0 | ||
| Kava-kava | PCD/PHRED | 0 | ND | |||
| 8j | 6.1 | 77 | 4.7 | 6.2 | ||
| Licorice | PCD/PHRED | 0 | ND | |||
| 8j | 6.4 | 80 | 5.6 | 7.0 |
SD = Standard deviation.
RSDr = Relative standard deviation.
PreCD = Precolumn derivatization.
ND = Nondetected, <0.1 ng AFB1/g.
n = 4.
PCD = Postcolumn derivatization.
Electrochemical reaction cell.
n = 6.
UV photochemical reaction cell.
n = 3.
Table 2.
Recovery of total aflatoxins added to ginseng and other botanical roots (Aflaochra IAC separation and isolation)
| Root | Procedure | AFL added, ng/g | AFL found, ng/g | Recovery, % | SDa, % | RSDrb, % |
|---|---|---|---|---|---|---|
| Ginseng | PCDc/PHREDd | 0 | NDe | |||
| 4f | 2.9 | 73 | 1.0 | 1.4 | ||
| 16f | 11.5 | 72 | 5.0 | 6.9 | ||
| Ginger | PCD/PHRED | 0 | ND | |||
| 8g | 5.3 | 66 | 3.6 | 5.6 | ||
| Kava-kava | PCD/PHRED | 8g | 4.7 | 59 | 2.3 | 3.9 |
| Licorice | PCD/PHRED | 0 | ND | |||
| 16g | 9.9 | 62 | 16.9 | 27.1 |
SD = Standard deviation.
RSD = Relative standard deviation.
PCD = Postcolumn derivatization.
UV photochemical reaction cell.
ND = Nondetected, <0.1 ng AFB1/g.
n = 3.
n = 4.
Table 3.
Recovery of ochratoxin A added to ginseng and other botanical roots (Aflaochra IAC separation and isolation)
| Root | OTA added, ng/g | OTA found, ng/g | Recovery, % | SDa | RSDrb |
|---|---|---|---|---|---|
| Ginseng | 1 | NDc | |||
| 4d | 2.1 | 52 | 5.6 | 10.5 | |
| 8d | 4.8 | 57 | 4.8 | 8.3 | |
| Ginger | 1 | NDc | |||
| 4e | 2.3 | 56 | 7.1 | 12.7 | |
| 8f | 5.1 | 63 | 1.5 | 2.4 | |
| Echinacea | 1 | NDc | |||
| 4g | 2.1 | 53 | 5.0 | 9.4 | |
| Licorice | 0 | 10.3 | |||
| Kava-kava | 0 | 3.0 |
SD = Standard deviation.
RSD = Relative standard deviation.
ND = Nondetected, <0.1 ng/g.
n = 5.
n = 7.
n = 4.
n = 3.
Licorice roots and kava-kava roots purchased from a botanical supplier were found to contain OTA at 3.0 and 10.3 ng/g. Corrected for about 50% recovery (from recovery data of the other roots), the actual concentrations found were 6 and 20 ng/g, respectively. The identity of OTA in kava-kava was confirmed by LC/MS.
Discussion
PCD can be used as a tool for confirmation of identity if preCD is used for quantification. The PHRED cell can be turned on for quantification and turned off for confirmation, as shown on Figure 4. When PHRED cell is turned off, no AFB2a and AFG2a are formed from the AFB1 and AFG1, respectively, that are present in the test extract. Consequently, the fluorescence responses of the 2 compounds are much less or may not be detectable. The Kobra cell can be used for confirmation in a similar way, as shown in Figure 3, but the column eluate would have to by-pass the cell to avoid derivative formation. It was found that even without applying current to the Kobra cell for 24 h, derivatives of AFB1 and AFG1 were formed in the column eluate containing AFB1 and AFG1 passed through the Kobra cell. This could be due to the fact that the membrane of the Kobra cell still holds bromine that derivatized AFB1 and AFG1.
Figure 4.
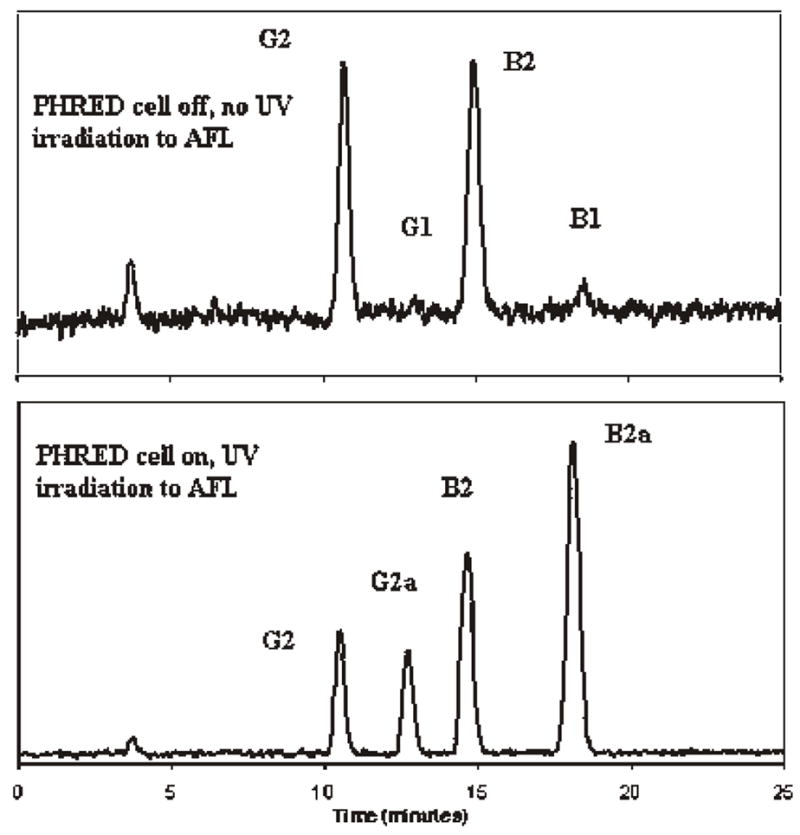
Chromatogram of added AFL in ginseng (with and without UV irradiation).
The Kobra cell gave slightly higher responses and greater slopes for the calibration curve than did the PHRED cell using the same calibrators with the same setting for the same fluorescence detector. The PHRED mobile phase, a mixture of water and organic solvents, affected the LC column less than the Kobra cell mobile phase. The elution time was about 3 min longer for the PHRED cell. The Kobra cell was less convenient to use because it required daily column flushing with water as recommended by the manufacturer. Both the Kobra cell and PHRED cell gave reproducible results using the same calibrators.
In conclusion, an IAC packed with antiaflatoxin antibodies is suitable for AFL determination in botanical roots. An IAC packed with antibodies specific for AFL and OTA gave recoveries of added AFL lower than an IAC for AFL alone. Recoveries of added OTA from the multitoxins column were<60%.
Acknowledgments
This work was partially supported by the Office of Dietary Supplements, National Institutes of Health, Bethesda, MD. The authors wish to thank Martha Gay, FDA, for performing confirmation of identity for OTA in kava-kava roots.
Contributor Information
Mary Trucksess, U.S. Food and Drug Administration, 5300 Paint Branch Pkwy, College Park, MD.
Carol Weaver, U.S. Food and Drug Administration, 5300 Paint Branch Pkwy, College Park, MD.
Carolyn Oles, U.S. Food and Drug Administration, 5300 Paint Branch Pkwy, College Park, MD.
Kathleen D’Ovidio, University of Maryland, College Park, MD.
Jeanne Rader, U.S. Food and Drug Administration, 5300 Paint Branch Pkwy, College Park, MD.
References
- 1.Miller JD. J Stored Products Res. 1995;31:1–6. [Google Scholar]
- 2.Wilson DM. In: Mycotoxins and Food Safety. DeVries JW, Trucksess MW, Jackson LS, editors. Kluwer Academic/Plenum Publishers; New York, NY: 2002. pp. 1–17. [Google Scholar]
- 3.MacDonald S, Castle L. Food Addit Contam. 1996;13:121–128. doi: 10.1080/02652039609374387. [DOI] [PubMed] [Google Scholar]
- 4.D’Ovidio KL, Trucksess MW, Weaver C, Horn E, McIntosh M, Bean G. Food Addit Contam. 2006;23:174–180. doi: 10.1080/02652030500442524. [DOI] [PubMed] [Google Scholar]
- 5.Pittet A. In: Mycotoxins and Phycotoxins in Perspective at the Turn of the Millennium. de Koe WJ, Samson RA, van Egmond HP, Gilbert J, Sabino M, editors. Ponsen & Looyen; Wageningen, The Netherlands: 2001. pp. 153–172. [Google Scholar]
- 6.Patel S, Hazel CM, Winterton AGM, Mortby E. Food Addit Contam. 1996;13:833–841. doi: 10.1080/02652039609374470. [DOI] [PubMed] [Google Scholar]
- 7.International Agency for Research on Cancer (IARC) IARC Monographs on the Evaluation of Carcinogenic Risks to Humans: Heterocyclic Amines and Mycotoxins. Vol. 56. IARC; Lyon, France: 1993. [Google Scholar]
- 8.Trucksess MW, Stack ME, Nesheim S, Page SW, Albert RH. J Assoc Off Ana Chem. 1991;74:81–88. [PubMed] [Google Scholar]
- 9.Trucksess MW. In: Mycotoxins and Phycotoxins in Perspective at the Turn of the Millennium. de Koe WJ, Samson RA, van Egmond HP, Gilbert J, Sabino M, editors. Ponsen & Looyen, Wageningen; The Netherlands: 2000. pp. 29–40. [Google Scholar]
- 10.Omurtage GZ, Yazicioglu D. J Food Prot. 2004;67:1782–1786. doi: 10.4315/0362-028x-67.8.1782. [DOI] [PubMed] [Google Scholar]
- 11.Scott PM, Trucksess MW. J AOAC Int. 1997;80:941–949. [PubMed] [Google Scholar]
- 12.Horwitz W, editor. Official Methods of Analysis of AOAC INTERNATIONAL. 18. AOAC INTERNATIONAL; Gaithersburg, MD: 2005. [Google Scholar]
- 13.Albert R, Horwitz W. Anal Chem. 1997;69:789–790. [Google Scholar]