

Abstract
The accuracy, repeatability, and reproducibility characteristics of a method using multitoxin immunoaffinity column cleanup with liquid chromatography (LC) for determination of aflatoxins (AF; sum of aflatoxins B1, B2, G1, and G2) and ochratoxin A (OTA) in powdered ginseng and ginger have been established in a collaborative study involving 13 laboratories from 7 countries. Blind duplicate samples of blank, spiked (AF and OTA added) at levels ranging from 0.25 to 16.0 μg/kg for AF and 0.25 to 8.0 μg/kg for OTA were analyzed. A naturally contaminated powdered ginger sample was also included. Test samples were extracted with methanol and 0.5% aqueous sodium hydrogen carbonate solution (700 + 300, v/v). The extract was centrifuged, diluted with phosphate buffer (PB), filtered, and applied to an immunoaffinity column containing antibodies specific for AF and OTA. After washing the column with water, the toxins were eluted from the column with methanol, and quantified by high-performance LC with fluorescence detection. Average recoveries of AF from ginseng and ginger ranged from 70 to 87% (at spiking levels ranging from 2 to 16 μg/kg), and of OTA, from 86 to 113% (at spiking levels ranging from 1 to 8 μg/kg). Relative standard deviations for within-laboratory repeatability (RSDr) ranged from 2.6 to 8.3% for AF, and from 2.5 to 10.7% for OTA. Relative standard deviations for between-laboratory reproducibility (RSDR) ranged from 5.7 to 28.6% for AF, and from 5.5 to 10.7% for OTA. HorRat values were ≤2 for the multi-analytes in the 2 matrixes.
Botanical products are in great demand in health food markets. Botanicals are used for treatment of diseases as well as to promote health (1). Raw materials for medicinal use and herbal supplements frequently are contaminated with toxigenic fungi originating in the soil; the plants themselves are susceptible to fungal growth both pre- and post-havest under the right environmental conditions (2). Contamination with mycotoxins produced by these fungi could pose human health problems. In recent years, many incidences of natural occurrence of mycotoxins in botanicals have been reported (3). Aflatoxins (AF), the naturally occurring aflatoxins B1, B2, G1, and G2 (AFB1, AFB2, AFG1, AFG2), and ochratoxin A (OTA) have been found in ginseng, ginger, licorice, turmeric, and kava-kava in the United States (4, 5). Fumonisins have been found in medicinal wild plants in South Africa (6) and medicinal plants in Turkey (7) and Portugal (8). Zearalenone was identified in ginseng root (9). The presence of AF and OTA in botanicals may pose risks to human health. AF and OTA were found to co-occur in ginger (5). A multitoxin method for the determination of AF and OTA in botanical roots is needed. A method that is capable of determining AF and OTA simultaneously in powdered ginger and ginseng had been developed (5). The method uses a single immunoaffinity column for cleanup, high-performance liquid chromatography (LC) with post-column derivatization for AF fluorescence enhancement, and fluorescence determination for the toxins. The purpose of this collaborative study was to establish the accuracy, repeatability, and reproducibility parameters of the method by the analysis of spiked powdered ginseng and ginger and naturally contaminated powdered ginger.
Collaborative Study
Test Materials and Material Preparation
The materials were packed in 50 mL polypropylene tubes (5 g) and each blank, spiked and naturally contaminated sample, was labeled with a random number and stored at <−18°C until shipping to collaborators.
Batches of blank ground ginger powder and ginseng powder that passed through a 1 mm sieve were separately mixed thoroughly by tumbling at 50 rpm for 4 h. Batches of finely ground, naturally contaminated ginger samples were analyzed and the AF and OTA content determined. Then the batches of naturally contaminated ginger samples were combined (total 400 g) and thoroughly mixed.
The homogeneity of the bulk materials was checked by analysis of subsamples of 5 g (n = 10) using AOAC Method 991.31 for aflatoxins and Method 2004.10 for OTA with minor modifications. The blank material contained AFB1, AFB2, AFG1, AFG2, and OTA <0.1 μg/kg. The naturally contaminated ginger containing approximately AF and OTA averaging 20 and 9 μg/kg, respectively, were mixed and homogeneity tests were performed. Ten 5 g test samples were taken from the composite and analyzed. The levels of AF and OTA were 17.4 and 9.75 μg/kg, respectively; and the repeatability relative standard deviation (RSDr) of AF and OTA were 7.61 and 14.74%, respectively.
Blank, spiked, and naturally contaminated ginger was used for the collaborative study. Only blank and spiked ginseng were used because it was difficult to obtain ginseng naturally contaminated with aflatoxins at levels >2 μg/kg.
Study Design
The study was designed and conducted in accordance with guidelines prescribed by AOAC INTERNATIONAL. Each laboratory was assigned a coded number. These laboratories were selected based on their analytical capabilities. Three participants had no experience in using immunoaffinity columns for isolation.
Each participant was supplied with the following materials:
(1) Test samples.—Each ginseng test sample provided was 5 g. One pair (duplicates) of blank ginseng sample (2 test samples, AF and OTA at levels <0.1 μg/kg). Four pairs of spiked ginseng samples (8 test samples, 2 test samples/level) at 2, 4, 8, and 16 μg/kg total AF (the spiking solution containing mixture of the 4 AF and the ratio of the 4 AF was as follows: AFB1:AFB2:AFG1:AFG2 = 4:1:2:1, e.g., AF at 8 μg/kg composed of 4 μg/kg AFB1, 1 μg/kg AFB2, 2 μg/kg AFG1, and 1 μg/kg AFG2) and at 1, 2, 4, and 8 μg/kg OTA.
Each ginger test sample size was 5 g. One pair of blank ginger samples (2 test samples, AF and OTA at levels <0.1 μg/kg). One pair of naturally contaminated ginger samples (2 test samples). Three pairs of spiked ginger samples (total 6 test samples, 2 test samples/level) at 2, 4, and 16 μg/kg total AF (AFB1:AFB2:AFG1:AFG2 = 4:1:2:1) and 1, 2, and 8 μg/kg OTA.
(2) Practice samples.—Eight (2 ginseng test samples and 2 ginger test samples with known concentration of aflatoxins and OTA; and 2 ginseng test samples and 2 ginger test samples with unknown toxin concentrations).
(3) Blank samples.—20 g blank ginseng and 20 g blank ginger (AF <0.1 μg/kg, OTA <0.1 μg/kg) for additional practice purposes, in case the participants were experiencing analytical problems with practice samples.
(4) Immunoaffinity columns.—Forty AflaOchraTest immunoaffinity columns (Vicam, Watertown, MA).
(5) Aflatoxin stock standard solution.—In a 4 mL silanized vial (total AF 400 ng/mL in acetonitrile: AFB1 200 ng/mL, AFB2 50 ng/mL, AFG1 100 ng/mL, AFG2 50 ng/mL).
(6) OTA stock standard solution.—In a 4 mL silanized vial (OTA 200 ng/mL in methanol).
(7) Dry phosphate buffer powder.—One tube. Sufficient to prepare 2 L 0.1 M phosphate buffer.
(8) Phosphate saline powder.—One package. Sufficient to prepare 1 L 10 mM phosphate buffered saline.
(9) Polypropylene centrifuge tubes.—Fifty; 50 mL.
(10) Fiber glass filter papers.—Fifty (Whatman, Inc., Clifton, NJ).
(11) Copy of the method.
(12) CD.—Containing a copy of data workbook XLS file for data calculation, tabulation, and summary.
(13) Instructions.—A set of additional instructions for the collaborators, method, and materials (printed copies).
(14) Form for collaborators’ comments.
(15) Collaborative study materials receipt form.
Participants were requested to analyze all practice test samples for each matrix prior to proceeding with the collaborative study. Participants were requested to ensure that their known practice test sample results fell within the specified range indicated on the labels before proceeding with the unknown practice test samples and reporting results to Study Director. Participants obtaining acceptable AF and OTA results for unknown practice test sample A (recoveries 60−120%) were notified to proceed with the collaborative study. This recovery range is within the guideline of acceptable recovery limits of AOAC (10) and the Codex Alimentarius (11). The AOAC guideline for the acceptable recovery at the 10 μg/kg level is 70−125% (10) and Codex acceptable recovery range is 70−110% for a level of 10−100 μg/kg, and 60−120% for a level of 1−10 μg/kg. Participants obtaining results out of range were instructed to practice the method procedure by analyzing additional spiked samples prepared in their own laboratories.
After performing the practice study, participants analyzed all test samples of the same matrix on the same day. For each test sample, participants prepared a single cleaned-up extract and performed a single LC separation and determination for AF and for OTA.
AOAC Official Method 2008.02 Aflatoxins B1, B2, G1, and G2 and Ochratoxin A in Ginseng and Ginger
Multitoxin Immunoaffinity Column Cleanup and Liquid Chromatographic Quantitation First Action 2008
[Applicable to the determination of total aflatoxins (AF; sum of AFB1, AFB2, AFG1, and AFG2) in powdered ginseng and ginger at 2−16 μg/kg and ochratoxin A (OTA) in the matrixes at 1−8 μg/kg.]
Caution: The International Agency for Research on Cancer (IARC) has classified AF as a human carcinogen (group 1 A) and OTA as a possible human carcinogen (group 2B; 1). Wear protective clothing, gloves, and safety glasses at all times, and perform all standard and sample preparation stages inside the fume hood. Clean accidental spills of AF and OTA with diluted bleach (1 to 10 dilution), and let stand 10 min. After wiping off the bleach solution of the area, wipe with 5% aqueous acetone. Rinse all glassware with diluted bleach before washing. Methanol and acetonitrile are hazardous and must be poured in a fume hood. All analyses should be carried out inside the fume hood. Dispose of waste solvents according to applicable environmental rules and regulations.
See Tables 2008.02A and 2008.02B for the results of the interlaboratory study supporting acceptance of the method.
Table 2008.02A.
Interlaboratory study results for aflatoxins and ochratoxin A in powdered ginseng by liquid chromatography after immunoaffinity column cleanup
| Mycotoxina | Level, μg/kg | Average, μg/kg | Mean recovery, % | sr, μg/kg | sR, μg/kg | RSDr, % | RSDR, % | HorRat | 0.22c | HorRatb | No. labs used | Outliers |
|---|---|---|---|---|---|---|---|---|---|---|---|---|
| AFB1 | 1 | 0.72 | 72 | 0.02 | 0.10 | 3.24 | 13.78 | 0.29 | 0.16 | 0.63 | 9 | 2 |
| AFB2 | 0.25 | 0.21 | 85 | 0.02 | 0.03 | 10.51 | 13.76 | 0.24 | 0.05 | 0.63 | 11 | 0 |
| AFG1 | 0.5 | 0.33 | 67 | 0.02 | 0.11 | 7.35 | 31.55 | 0.76 | 0.07 | 1.43 | 11 | 0 |
| AFG2 | 0.25 | 0.19 | 78 | 0.01 | 0.02 | 5.40 | 12.49 | 0.22 | 0.04 | 0.57 | 10 | 1 |
| AF | 2 | 1.47 | 74 | 0.04 | 0.20 | 2.64 | 13.91 | 0.33 | 0.32 | 0.63 | 9 | 2 |
| OTA | 1 | 0.92 | 92 | 0.06 | 0.09 | 6.76 | 9.37 | 0.20 | 0.20 | 0.43 | 10 | 1 |
| AFB1 | 2 | 1.37 | 68 | 0.14 | 0.31 | 9.97 | 22.51 | 0.52 | 0.30 | 1.02 | 11 | 0 |
| AFB2 | 0.5 | 0.38 | 77 | 0.02 | 0.03 | 6.39 | 8.93 | 0.17 | 0.08 | 0.41 | 10 | 1 |
| AFG1 | 1 | 0.67 | 67 | 0.07 | 0.19 | 10.10 | 28.87 | 0.60 | 0.15 | 1.31 | 11 | 0 |
| AFG2 | 0.5 | 0.36 | 72 | 0.01 | 0.06 | 3.79 | 17.43 | 0.33 | 0.08 | 0.79 | 10 | 1 |
| AF | 4 | 2.80 | 70 | 0.23 | 0.59 | 8.31 | 21.22 | 0.55 | 0.61 | 0.96 | 11 | 0 |
| OTA | 2 | 1.82 | 91 | 0.05 | 0.12 | 2.50 | 6.49 | 0.16 | 0.40 | 0.30 | 11 | 0 |
| AFB1 | 4 | 2.81 | 70 | 0.19 | 0.57 | 6.93 | 20.17 | 0.52 | 0.62 | 0.92 | 11 | 0 |
| AFB2 | 1 | 0.78 | 78 | 0.05 | 0.11 | 5.93 | 14.14 | 0.30 | 0.17 | 0.64 | 11 | 0 |
| AFG1 | 2 | 1.38 | 69 | 0.09 | 0.34 | 6.84 | 24.47 | 0.57 | 0.30 | 1.11 | 11 | 0 |
| AFG2 | 1 | 0.73 | 73 | 0.04 | 0.11 | 5.42 | 14.98 | 0.32 | 0.16 | 0.68 | 11 | 0 |
| AF | 8 | 5.65 | 71 | 0.34 | 1.08 | 6.02 | 19.04 | 0.55 | 1.24 | 0.87 | 11 | 0 |
| OTA | 4 | 3.42 | 86 | 0.15 | 0.19 | 4.46 | 5.53 | 0.15 | 0.75 | 0.25 | 11 | 0 |
| AFB1 | 8 | 5.54 | 69 | 0.21 | 1.09 | 3.84 | 19.76 | 0.57 | 1.22 | 0.90 | 10 | 1 |
| AFB2 | 2 | 1.62 | 81 | 0.07 | 0.14 | 4.43 | 8.58 | 0.20 | 0.36 | 0.39 | 10 | 1 |
| AFG1 | 4 | 2.74 | 69 | 0.18 | 0.69 | 6.71 | 25.34 | 0.65 | 0.60 | 1.15 | 10 | 1 |
| AFG2 | 2 | 1.45 | 73 | 0.11 | 0.25 | 7.64 | 17.25 | 0.40 | 0.32 | 0.78 | 11 | 0 |
| AF | 16 | 11.27 | 71 | 0.49 | 2.29 | 4.31 | 20.29 | 0.65 | 2.48 | 0.92 | 10 | 1 |
| OTA | 8 | 6.99 | 87 | 0.25 | 0.63 | 3.56 | 8.99 | 0.27 | 1.54 | 0.41 | 11 | 0 |
Note: Blank samples were found to contain <0.1 μg/kg AF and OTA.
AF = Aflatoxin (sum of aflatoxins B1, B2, G1, and AFG2); OTA = ochratoxin A.
Calculated using predicted standard deviation of 0.22c.
Table 2008.02B.
Interlaboratory study results for aflatoxins and ochratoxin A in powdered ginger by liquid chromatography after immunoaffinity column cleanup
| Mycotoxina | Level, μg/kg | Average, μg/kg | Mean recovery, % | sr, μg/kg | sR, μg/kg | RSDr, % | RSDR, % | HorRat | 0.22c | HorRatb | No. labs used | Outliers |
|---|---|---|---|---|---|---|---|---|---|---|---|---|
| AFB1 | 1 | 0.88 | 88 | 0.06 | 0.07 | 6.39 | 7.71 | 0.17 | 0.19 | 0.35 | 10 | 1 |
| AFB2 | 0.25 | 0.22 | 90 | 0.02 | 0.02 | 7.55 | 7.94 | 0.14 | 0.05 | 0.36 | 10 | 1 |
| AFG1 | 0.5 | 0.41 | 82 | 0.03 | 0.09 | 6.46 | 21.80 | 0.42 | 0.09 | 0.99 | 11 | 0 |
| AFG2 | 0.25 | 0.22 | 86 | 0.01 | 0.03 | 4.79 | 12.30 | 0.22 | 0.05 | 0.56 | 10 | 1 |
| AF | 2 | 1.74 | 87 | 0.10 | 0.24 | 5.70 | 13.76 | 0.33 | 0.38 | 0.63 | 11 | 0 |
| OTA | 1 | 0.93 | 93 | 0.08 | 0.10 | 8.14 | 10.72 | 0.23 | 0.20 | 0.49 | 10 | 1 |
| AFB1 | 2 | 1.65 | 83 | 0.07 | 0.10 | 4.51 | 5.79 | 0.14 | 0.36 | 0.26 | 9 | 2 |
| AFB2 | 0.5 | 0.45 | 89 | 0.03 | 0.04 | 7.05 | 8.60 | 0.17 | 0.10 | 0.39 | 11 | 0 |
| AFG1 | 1 | 0.69 | 69 | 0.05 | 0.14 | 7.97 | 20.99 | 0.44 | 0.15 | 0.95 | 11 | 0 |
| AFG2 | 0.5 | 0.40 | 79 | 0.03 | 0.05 | 8.07 | 13.17 | 0.25 | 0.09 | 0.60 | 11 | 0 |
| AF | 4 | 3.11 | 78 | 0.16 | 0.47 | 5.10 | 15.07 | 0.40 | 0.69 | 0.68 | 11 | 0 |
| OTA | 2 | 1.86 | 93 | 0.08 | 0.16 | 4.31 | 8.56 | 0.21 | 0.41 | 0.39 | 11 | 0 |
| AFB1 | NCc | 8.44 | NAd | 0.65 | 0.68 | 7.69 | 8.06 | 0.25 | 1.86 | 0.37 | 9 | 2 |
| AFB2 | NC | 0.83 | NA | 0.07 | 0.13 | 7.79 | 15.89 | 0.34 | 0.18 | 0.72 | 10 | 1 |
| AFG1 | NC | 6.33 | NA | 0.76 | 2.82 | 11.96 | 44.56 | 1.30 | 1.39 | 2.03 | 11 | 0 |
| AFG2 | NC | 1.03 | NA | 0.13 | 0.31 | 12.88 | 30.58 | 0.68 | 0.23 | 1.39 | 11 | 0 |
| AF | NC | 16.22 | NA | 1.46 | 4.64 | 9.00 | 28.60 | 0.96 | 3.57 | 1.30 | 11 | 0 |
| OTA | NC | 7.27 | NA | 0.39 | 0.52 | 5.36 | 7.20 | 0.21 | 1.60 | 0.33 | 10 | 1 |
| AFB1 | 8 | 6.47 | 81 | 0.19 | 0.46 | 2.96 | 7.10 | 0.21 | 1.42 | 0.32 | 11 | 0 |
| AFB2 | 2 | 1.74 | 87 | 0.05 | 0.10 | 3.00 | 5.81 | 0.14 | 0.38 | 0.26 | 11 | 0 |
| AFG1 | 4 | 2.60 | 65 | 0.09 | 0.68 | 3.34 | 26.00 | 0.66 | 0.57 | 1.18 | 11 | 0 |
| AFG2 | 2 | 1.52 | 76 | 0.05 | 0.23 | 3.61 | 15.19 | 0.36 | 0.33 | 0.69 | 11 | 0 |
| AF | 16 | 12.85 | 80 | 0.29 | 0.74 | 2.22 | 5.74 | 0.19 | 2.83 | 0.26 | 9 | 2 |
| OTA | 8 | 9.02 | 113 | 0.46 | 0.93 | 5.15 | 10.31 | 0.32 | 1.99 | 0.47 | 10 | 1 |
Note: Blank samples were found to contain <0.1 μg/kg AF and OTA.
AF = Aflatoxin (sum of aflatoxins B1, B2, G1, and AFG2); OTA = ochratoxin A.
Calculated using predicted SD of 0.22c.
NC = Naturally contaminated.
NA = Not applied.
A. Principle
A test portion is extracted with methanol and 0.5% aqueous sodium bicarbonate solution (700 + 300, v/v). The extract is centrifuged, diluted with phosphate buffer (PB; 0.1 M, pH 7.4) containing 1% Tween 20, filtered, and applied to an immunoaffinity column containing antibodies specific for AF and OTA. After washing, the toxin is eluted from the column with methanol and determined and quantified by high-performance liquid chromatography (LC) with fluorescence detection. For AF post-column derivatization, PHRED or Kobra cell is used.
B. Plant Material
Finely ground (<125 μm) ginseng (Panax quinquefolius) for the recovery study was purchased from Schumacher Ginseng (Marathon, WI). The ground ginger (the dried, ground rhizomes of Zingiber officinale Roscoe) for the recovery study was purchased from McCormick (Baltimore, MD). Naturally contaminated ginger (Zingiber officinale) was purchased from Penn Herb (Philadelphia, PA).
C. Apparatus
(a) Orbital shaker.—VWR DS-500E (VWR International, Bridgeport, NJ), or equivalent, capable of 400 rpm.
(b) Centrifuge tube.—50 mL, polypropylene.
(c) Centrifuge.—Allegra X-22R (VWR International).
(d) Glass microfiber filter paper.—Whatman No. 934AH, 11 cm (Whatman, Inc., Clifton, NJ).
(e) Immunoaffinity column.—AflaOchraTest column (G1017; Vicam, Watertown, MA). Aflatoxin/OTA immunoaffinity columns contain monoclonal antibodies cross reactive toward aflatoxins B1, B2, G1, and G2, and monoclonal antibodies cross reactive toward OTA. The immunoaffinity columns should have a minimum capacity of not <100 ng total aflatoxin and 100 ng OTA and should give a recovery of not <80% for aflatoxins B1, B2, G1, and G2, and OTA when 5 ng of each aflatoxins B1, B2, G1, and G2, and OTA is applied in 10 mL of 10% methanol:phosphate buffered saline (PBS; v/v). The columns should have a shelf life of 18 months at 4°C or 12 months at room temperature. The use by date was September 19, 2008.
(f) Column reservoir.—50 mL polypropylene (Alltech Associates, Deerfield, IL) with luer tip or 25 mL glass syringe with luer tip, or equivalent.
(g) Column manifold.—Vicam G1104 12-position stand, or equivalent.
(h) LC system.—Waters Model 2690 Alliance Separation System (Waters, Milford, MA), Waters Model 2475 fluorescence detector; or equivalent LC system. Operating conditions.—Flow rate, for AF 0.8 mL/min; for OTA 1.0 mL/min. Detector, for AF set at excitation wavelength (Ex) 362 nm and emission wavelength (Em) 440 nm; for OTA set at Ex 333 nm and Em 460 nm. Column, for AF, Waters, Cat. No. AQ12S031546WT, YMC ODS-AQ S-3, 4.6 × 150 mm, or equivalent; for OTA, Beckman, Cat. No. 235332, Ultrasphere, 4.6 × 250 mm, 5 μm (Beckman Instruments, Inc., Fullerton, CA), or equivalent.
(i) Post-column derivatization (PCD) systems for AF.—(1) PHRED cell.—Post-column photochemical derivatization cell (AURA Industries, New York, NY), or equivalent. (Caution: Avoid looking at the UV lamp.) (2) Kobra cell.—Electrochemical cell, post-column bromination derivatization cell (R-Biopharm Inc., Marshall, MI). (Caution: Set at 100 μA, do not turn on current until LC pump is operating to avoid overheating the cell membrane.)
D. Reagents
(a) Solvent and reagents.—LC grade methanol, acetonitrile, ACS grade acetic acid, sodium chloride (NaCl), monosodium phosphate, disodium phosphate, PBS (pH 7.4; Sigma P-3813; Sigma-Aldrich, St. Louis, MO), Tween 20 (Sigma P-5927), and Milli-Q water (ultrapure water).
(b) Extraction solvent.—Methanol–0.5% sodium bicarbonate (700 + 300, v/v); mix and equilibrate to room temperature. Prepare fresh daily.
(c) PBS solution.—10 mM. Dissolve 1 package Sigma P-3813 PBS powder in 1 L water.
(d) PB solution.—0.1 M. Dissolve 8.69 g disodium phosphate (anhydrous) and 4.66 g monosodium phosphate (anhydrous) or 5.36 g monosodium phosphate monohydrate in 800 mL water, adjust to pH 7.4 with 2 M sodium hydroxide, add 10 mL Tween 20, and dilute to 1 L.
(e) Aflatoxins.—Cat. Nos. A 6636, A 9887, A 0138, and A 0263 for AFB1, AFB2, AFG1, and AFG2, respectively (Sigma Aldrich). Prepare stock standard solutions of each of the 4 AF at 10 μg/mL in acetonitrile according to revised AOAC Method 971.22.
(1) Preparation of 10 μg/mL first individual aflatoxin stock standard solution.—Weigh 10 mg of each aflatoxin into a separate 100 mL volumetric flask. Add 50 mL acetonitrile, mix, dilute to mark with additional acetonitrile, and mix. Then pipet 10 mL of this solution into another 100 mL volumetric flask and dilute to mark with acetonitrile. Record UV spectrum of each aflatoxin solution. Determine concentration of aflatoxin solution by measuring absorbance (A) at wavelength of maximum absorption close to 360 nm and using equation in 971.22 [μg Aflatoxin/mL = (A × MW × 1000)/ε], where MW is molecular weight and ε is molecular absorptivity. The concentration should be approximately 10 μg/mL.
(2) Preparation of 400 ng/mL AF second stock standard solution (mixture of the 4 AFB1, B2, G1, and G2 at 200, 50, 100, and 50 ng/mL).—Add appropriate amount of each AF stock standard to the same volumetric flask and dilute to volume with acetonitrile. Use the 400 ng/mL AF second stock standard as the spiking solution for recovery study. Store stock standard solution at −18°C. Equilibrate to room temperature before use.
(3) Preparation of working AF calibrant solution.—Prepare 6 calibrants in separate 10 mL volumetric flasks according to Table 2008.02C. Dilute to volume with methanol–water (1 + 1, v/v). Store in refrigerator and equilibrate to room temperature before use. Prepare working calibrant solutions daily.
Table 2008.02C.
Preparation of working aflatoxin calibrant solutions
| Final aflatoxin concentration of working calibrant solution1 ng/mL |
||||||
|---|---|---|---|---|---|---|
| Working calibrant solution | 2nd Stock standard solution, μL | AFB1 | AFB2 | AFG1 | AFG2 | AF |
| 1 | 0 | 0 | 0 | 0 | 0 | 0 |
| 2 | 12.5 | 0.25 | 0.0625 | 0.125 | 0.0625 | 0.5 |
| 3 | 25 | 0.5 | 0.125 | 0.25 | 0.125 | 1 |
| 4 | 50 | 1 | 0.25 | 0.5 | 0.25 | 2 |
| 5 | 100 | 2 | 0.5 | 1 | 0.5 | 4 |
| 6 | 200 | 4 | 1 | 2 | 1 | 8 |
(f) OTA standard solutions.—O1877 (Sigma Aldrich).
(1) Preparation of a 30 μg/mL first OTA stock standard solution.—Weigh 10 mg OTA into a 100 mL volumetric flask. Add 50 mL methanol, mix, dilute to mark with additional methanol, and mix. Pipet 1 mL of the 100 μg/mL OTA solution into a 3 mL volumetric flask and dilute to volume with methanol. Determine absorbance at 333 nm. Use molar absorptivity of 6330 to calculate concentration. The stock standard solution should be approximately 30 μg/mL. Store stock standard solution at −18°C. Equilibrate to room temperature before use.
(2) Preparation of 200 ng/mL second OTA stock standard solution.—Add appropriate amount of stock standard to a 25 mL volumetric flask and dilute to volume with methanol.
(3) Preparation of working OTA calibrant solution.—Prepare 6 calibrants in separate 10 mL volumetric flasks according to Table 2008.02D. Dilute to volume with methanol–water (1 + 1, v/v). Store in refrigerator and equilibrate to room temperature before use. Prepare working calibrant solutions daily.
Table 2008.02D.
Preparation of working calibrant ochratoxin A solutions
| Working calibrant solution | 2nd Stock solution, μL | Final ochratoxin A concentration of working calibrant solution, μg/mL |
|---|---|---|
| 1 | 0 | 0 |
| 2 | 12.5 | 0.25 |
| 3 | 25 | 0.5 |
| 4 | 50 | 1 |
| 5 | 100 | 2 |
| 6 | 200 | 4 |
(g) Mobile phase.—Isocratic, 0.8 mL/min for AF and 1 mL/min for OTA.
(1) For AF post-column derivatization with PHRED cell.—Water–methanol–acetonitrile (600 + 250 +150, v/v/v).
(2) For AF post-column derivatization with Kobra cell.—1 L water–methanol–acetonitrile (600 + 250 + 150, v/v/v) + 350 μL 4 M nitric acid (M of concentrated nitric acid is 15.9) + 120 mg potassium bromide, and mix.
(3) For OTA.—Acetonitrile–water–acetic acid (500 + 500 + 10, v/v/v).
E. Extraction
Weigh 5 g test sample in a 50 mL centrifuge tube. Add 1 g NaCl and 25 mL MeOH–0.5% NaHCO3 (700 + 300, v/v). Mix on a Vortex mixer until sample particles and extract solvent are well mixed. Shake at 400 rpm for 10 min. Centrifuge for 10 min at 7000 rpm (g value = 5323 mm/s2) or at speed that can result a firm pellet of residues. Immediately pipet 7 mL into a 50 mL centrifuge, add 28 mL 0.1 M PB containing 1% Tween 20, mix, and filter through glass microfiber paper. Collect 25 mL filtrate (equivalent to 1 g test sample) into a 25 mL graduate cylinder and proceed immediately with immunoaffinity column (IAC) chromatography.
F. Immunoaffinity Column Isolation
(Caution: For immunoaffinity column cleanup, columns must be kept at room temperature for at least 15 min before use.)
Remove top cap from column and connect with reservoir. Remove end cap from column and attach to column manifold (the fit must be tight). Let liquid in column pass through until liquid is about 2−3 mm above column bed. Pass 25 mL filtrate into reservoir. Let filtrate flow through column by gravity force. Let column run dry. In order to start flow easily again, remove column from manifold, add about 2 mL 10 mM PBS into column, reattach column to reservoir, wash column with additional 3 mL 10 mM PBS and then with 5 mL water (the 5 mL 10 mM PBS can be added directly to column reservoir if other techniques are used to dislodge the air bubble at the end of the column and to start flow easily again). Let column run dry, then force 3 mL air through column with a syringe. Place a 3 mL volumetric flask under column. Elute and collect AF and OTA in the 3 mL volumetric flask with 1 mL HPLC grade methanol; let drip freely. Let column run dry. Let stand for 1 min, then elute with additional 1 mL methanol and collect into the same volumetric flask. Let column run dry and force 10 mL air through column. Dilute eluate to volume with water and perform LC analysis for AF immediately. Perform LC analysis for OTA next.
G. LC Analysis
(a) Aflatoxins.—Post-column derivatization for AF (use UV cell or Kobra cell).—Inject 50 μL reagent blank (calibrant 1), AF working standards, or test sample into LC column. Identify AF peaks in test sample extract by comparing retention time with those of standards. AF elute in the order of G2, G1, B2, and B1. After passing through the PHRED cell or Kobra cell, the AFG1 and AFB1 have been derivatized to form AFG2a (derivative of G1) and AFB2a (derivative of B1). The chemical structures of the derivatives resulted from electrochemical bromination and photolysis are not the same. The structures of AFB1 and AFG1 photolysis products have not been established. The retention times of AFG2, AFG2a, AFB2, and AFB2a are between about 14 and 27 min using the PHRED cell (Figure 2008.02A); retention times are shorter using the Kobra cell. The peaks should be baseline resolved. Construct standard curves of each AF. Determine concentration of each AF in test solution from calibration curve.
Figure 2008.02A.
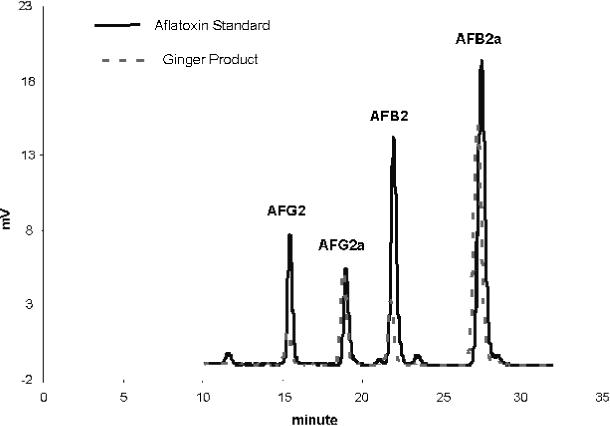
Liquid chromatograms of aflatoxin standard and aflatoxins in ginger product.
Aflatoxins calibration curves.—Calibration curves should be prepared for each of the aflatoxin using the working calibrant solutions containing the 4 aflatoxins described. These solutions cover the range of 0.25−4 ng/mL for AFB1, 0.0625−1 ng/mL for AFB2, 0.125−2 ng/mL for AFG1, and 0.0625−1 ng/mL for AFG2. Make the calibration curves prior to analysis according to Table 2008.02C and check the plot for linearity. If test portion area response is outside (higher) the calibration range, then the purified test extract should be diluted with methanol–water (1 + 1, v/v) and reinjected into the LC column.
(b) OTA.—Inject 50 μL reagent blank (calibrant 1), OTA working standards, or test sample into LC column. Identify OTA peaks in test sample extracts by comparing retention time with those of standards. OTA elutes with retention times of between 10−11 min (Figure 2008.02B). There is a small peak with a retention time about 0.5 min ahead the OTA peak in ginseng. Construct standard curves of OTA. Determine concentration of OTA in test solution from calibration curve.
Figure 2008.02B.
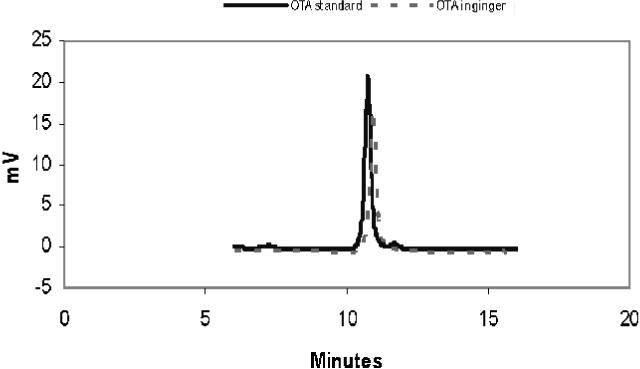
Liquid chromatograms of ochratoxin A standard and ochratoxin A in ginger product.
OTA calibration curve.—Calibration curves should be prepared for OTA using the working calibrant solutions. These solutions cover the range of 0.25−4 ng/mL for OTA. Make the calibration curves prior to analysis according to Table 2008.02D and check the plot for linearity. If test portion area response is outside (higher) the calibration range, then the purified test extract should be diluted with methanol–water (1 + 1, v/v) and reinjected into the LC column.
(c) Quantitation of aflatoxins and OTA.—Quantitation of AF and OTA should be performed by measuring peak areas at each AF and OTA retention time and comparing them with the corresponding calibration curve.
H. Calculations
Plot peak area (response, Y-axis) of each toxin (OTA and each AF) standards against concentration (ng/mL, X-axis) and determine slope (S) and Y-intercept (a). Calculate level of toxin in sample with the following formula, where R is the test solution peak area, V is the final volume (mL) of the injected test solution, and F is the dilution factor. F is 1 when V is 3 mL. W is 1 g test sample passed through the immunoaffinity column. The total AF is the sum of the AFG2, G1, B2, and B1.
References: (1) IARC Monographs on the Evaluation of Carcinogenic Risks to Humans (1993) Some Naturally Occurring Substances: Food Items and Constituents, Heterocyclic Aromatic Amines and Mycotoxins, Vol. 56, International Agency for Research on Cancer, Lyon, France, pp 489−521.
(2) J. AOAC Int. 91, 511(2008).
Results and Discussion
Table 1 shows laboratory numbers, data submission, and reasons why data were not included for statistical analysis. A total of 16 laboratories were invited to participate in this study. Fourteen participants submitted data. Data submitted by 3 participants (laboratories 3, 7, and 8) were considered invalid and were not included in Tables 2008.02A and 2008.02B. Laboratories 3 and 7 did not follow the instructions provided and had problems with the analysis. Data from laboratory 8 were also excluded as the participant had problems with the LC separation. It was not clear if this was due to an instrumental problem or an LC column problem. All OTA peaks showed no baseline separation from interference peaks and no AFG1 and AFG2 data for most of the ginger test samples. Two laboratories did not return results: laboratory 9 because of problems with the Kobra cell during the analysis and laboratory 10 did not perform any tests due to other more urgent assignments. Three new collaborators (laboratories 10, 14, and 15) were invited to participate. Numbers were reused for laboratory 10 because only 15 sets of random numbers were generated before the collaborative study.
Table 1.
Status of data submission by participants
| Lab No. | Data submission | Reason for data exclusion |
|---|---|---|
| 1 | Yes | |
| 2 | Yes | |
| 3 | Yes | Not following instructions |
| 4 | Yes | |
| 5 | Yes | |
| 6 | Yes | |
| 7 | Yes | Problems with analysis |
| 8 | Yes | Problems with LC separation |
| 9 | No | |
| 10 | No, original participant | |
| 10 | Yes, new participant | |
| 11 | Yes | |
| 12 | Yes | |
| 13 | Yes | |
| 14 | Yes | |
| 15 | Yes |
Valid data of the collaborative study for ginseng and ginger are presented in Tables 2 and 3, respectively. Interlaboratory study results for the determination of AF and OTA in ginseng and ginger by LC after immunoaffinity column cleanup are reported in Tables 2008.02A and 2008.02B which summarize the statistical data of the entire study, including mean concentrations, mean recoveries, values for within-laboratory repeatability standard deviation (sr) and relative standard deviations (RSDr), between-laboratory reproducibility standard deviations (sR) and relative standard deviations (RSDR), number of sets of acceptable results, number of outlier laboratories, and the HorRat values, which is considered a measure of acceptability of method performance. Determinations of outliers were assessed by Cochran, Single Grubbs, and Paired Grubbs tests. Pairs of results identified as outliers are marked by code and indicated by footnotes on Tables 2 and 3. Laboratory 2 reported data that were outliers in most cases (9 out of 12) and in the remaining ones contributed to a considerable increase of the RSD of the entire study. The participant was contacted by the coordinator in order to look for the causes of these unexpected results, but no valid reason to eliminate the submitted results was found.
Table 2.
Collaborative study results for determination of aflatoxinsa and ochratoxin A in blind duplicates of spiked powdered ginseng samples
| Lab No. | AFB1 |
AFB2 |
AFG1 |
AFG2 |
AF |
OTA |
||||||
|---|---|---|---|---|---|---|---|---|---|---|---|---|
| 0 μg/kg | 0 μg/kg | 0 μg/kg | 0 μg/kg | 0 μg/kg | 0 μg/kg | |||||||
| 1 | NDb | ND | ND | ND | ND | ND | ND | ND | ND | ND | ND | ND |
| 2 | 0.45 | 0.45 | 0.15 | 0.15 | 0.08 | 0.08 | 0.11 | 0.11 | ND | ND | ND | ND |
| 4 | ND | ND | ND | ND | ND | ND | ND | ND | ND | ND | ND | ND |
| 5 | ND | ND | ND | ND | ND | ND | ND | ND | ND | ND | ND | ND |
| 6 | ND | ND | ND | ND | ND | ND | ND | ND | ND | ND | ND | ND |
| 10 | ND | ND | ND | ND | ND | ND | ND | ND | ND | ND | 0.38 | 0.14 |
| 11 | ND | ND | ND | ND | ND | ND | ND | ND | ND | ND | ND | ND |
| 12 | ND | ND | ND | ND | ND | ND | ND | ND | ND | ND | ND | ND |
| 13 | ND | ND | ND | ND | ND | ND | ND | ND | ND | ND | ND | ND |
| 14 | ND | ND | ND | ND | ND | ND | ND | ND | ND | ND | ND | ND |
| 15 |
ND |
ND |
ND |
ND |
ND |
ND |
ND |
ND |
ND |
ND |
ND |
ND |
| |
1 μg/kg |
0.25 μg/kg |
0.5 μg/kg |
0.25 μg/kg |
2 μg/kg |
1 μg/kg |
||||||
| 1 | 0.73 | 0.75 | 0.20 | 0.21 | 0.42 | 0.39 | 0.17 | 0.19 | 1.52 | 1.53 | 1.01 | 0.86 |
| 2 | 0.81c | 0.45c | 0.22 | 0.15 | 0.14 | 0.08 | 0.21c | 0.11c | 1.38c | 0.80c | 0.90 | 1.10 |
| 4 | 0.78 | 0.76 | 0.23 | 0.22 | 0.41 | 0.41 | 0.22 | 0.22 | 1.61 | 1.64 | 1.00c | 0.48c |
| 5 | 0.63 | 0.65 | 0.18 | 0.19 | 0.25 | 0.25 | 0.18 | 0.18 | 1.24 | 1.26 | 0.92 | 0.87 |
| 6 | 0.56 | 0.59 | 0.17 | 0.19 | 0.24 | 0.26 | 0.15 | 0.17 | 1.12 | 1.21 | 0.84 | 0.84 |
| 10 | 0.99 | 0.95 | 0.27 | 0.25 | 0.51 | 0.43 | 0.24 | 0.22 | 2.00 | 1.85 | 0.99 | 0.99 |
| 11 | 0.68 | 0.66 | 0.27 | 0.21 | 0.26 | 0.30 | 0.20 | 0.24 | 1.40 | 1.41 | 0.96 | 0.89 |
| 12 | 0.73c | 0.88c | 0.19 | 0.22 | 0.40 | 0.45 | 0.18 | 0.20 | 1.75c | 1.52c | 0.91 | 0.96 |
| 13 | 0.77 | 0.85 | 0.21 | 0.21 | 0.38 | 0.41 | 0.19 | 0.19 | 1.66 | 1.55 | 0.98 | 0.96 |
| 14 | 0.89 | 0.87 | 0.24 | 0.23 | 0.44 | 0.43 | 0.22 | 0.22 | 1.80 | 1.75 | 0.93 | 0.88 |
| 15 |
0.78 |
0.77 |
0.22 |
0.21 |
0.42 |
0.37 |
0.22 |
0.21 |
1.64 |
1.57 |
0.76 |
0.75 |
| |
2 μg/kg |
0.5 μg/kg |
1 μg/kg |
0.5 μg/kg |
4 μg/kg |
2 μg/kg |
||||||
| 1 | 1.33 | 1.40 | 0.39 | 0.38 | 0.78 | 0.81 | 0.36 | 0.37 | 2.86 | 2.96 | 1.72 | 1.77 |
| 2 | 0.92 | 0.91 | 0.31 | 0.36 | 0.34 | 0.35 | 0.32 | 0.36 | 1.89 | 1.97 | 1.84 | 1.93 |
| 4 | 1.67 | 1.27 | 0.47 | 0.39 | 0.88 | 0.65 | 0.46c | 0.38c | 2.69 | 3.47 | 1.96 | 1.97 |
| 5 | 1.26 | 1.26 | 0.36 | 0.37 | 0.52 | 0.54 | 0.33 | 0.35 | 2.51 | 2.47 | 1.79 | 1.84 |
| 6 | 1.04 | 1.40 | 0.34 | 0.39 | 0.46 | 0.65 | 0.33 | 0.34 | 2.78 | 2.16 | 1.85 | 1.77 |
| 10 | 1.96 | 1.94 | 0.52d | 0.52d | 0.98 | 0.95 | 0.44 | 0.46 | 3.91 | 3.86 | 1.99 | 2.03 |
| 11 | 0.77 | 1.06 | 0.34 | 0.37 | 0.40 | 0.41 | 0.23 | 0.21 | 1.74 | 2.05 | 1.66 | 1.79 |
| 12 | 1.51 | 1.48 | 0.39 | 0.38 | 0.79 | 0.72 | 0.36 | 0.37 | 2.95 | 3.05 | 1.84 | 1.89 |
| 13 | 1.51 | 1.55 | 0.41 | 0.41 | 0.73 | 0.74 | 0.39 | 0.39 | 3.09 | 3.04 | 1.90 | 1.85 |
| 14 | 1.39 | 1.55 | 0.38 | 0.41 | 0.70 | 0.76 | 0.36 | 0.37 | 2.83 | 3.09 | 1.71 | 1.75 |
| 15 |
1.44 |
1.42 |
0.42 |
0.41 |
0.79 |
0.78 |
0.43 |
0.43 |
3.08 |
3.04 |
1.61 |
1.62 |
| |
4 μg/kg |
1 μg/kg |
2 μg/kg |
1 μg/kg |
8 μg/kg |
4 μg/kg |
||||||
| 1 | 2.92 | 2.92 | 0.91 | 0.80 | 1.62 | 1.61 | 0.81 | 0.76 | 6.09 | 6.26 | 3.05 | 3.11 |
| 2 | 1.80 | 1.53 | 0.55 | 0.51 | 0.73 | 0.59 | 0.59 | 0.54 | 3.68 | 3.17 | 3.65 | 3.30 |
| 4 | 3.02 | 3.61 | 0.76 | 0.84 | 1.30 | 1.55 | 0.71 | 0.79 | 5.30 | 6.19 | 3.39 | 3.61 |
| 5 | 2.56 | 2.66 | 0.73 | 0.75 | 1.20 | 1.20 | 0.71 | 0.70 | 5.20 | 5.31 | 3.40 | 3.38 |
| 6 | 2.70 | 3.01 | 0.78 | 0.84 | 1.33 | 1.50 | 0.73 | 0.77 | 6.13 | 5.54 | 3.47 | 3.59 |
| 10 | 3.77 | 3.32 | 1.00 | 0.86 | 1.82 | 1.69 | 0.91 | 0.80 | 7.50 | 6.67 | 3.93 | 3.37 |
| 11 | 1.90 | 2.08 | 0.70 | 0.69 | 0.80 | 1.04 | 0.50 | 0.59 | 3.90 | 4.39 | 3.28 | 3.34 |
| 12 | 3.17 | 3.03 | 0.85 | 0.81 | 1.62 | 1.57 | 0.75 | 0.74 | 6.16 | 6.39 | 3.51 | 3.54 |
| 13 | 2.99 | 2.95 | 0.81 | 0.80 | 1.49 | 1.50 | 0.78 | 0.76 | 6.07 | 6.01 | 3.49 | 3.51 |
| 14 | 2.90 | 2.76 | 0.78 | 0.75 | 1.46 | 1.38 | 0.68 | 0.69 | 5.82 | 5.58 | 3.31 | 3.25 |
| 15 |
3.01 |
3.17 |
0.86 |
0.87 |
1.61 |
1.66 |
0.89 |
0.90 |
6.37 |
6.59 |
3.36 |
3.43 |
| |
8 μg/kg |
2 μg/kg |
4 μg/kg |
2 μg/kg |
16 μg/kg |
8 μg/kg |
||||||
| 1 | 5.81 | 5.26 | 1.60 | 1.45 | 3.03 | 2.73 | 1.49 | 1.38 | 11.92 | 10.82 | 5.86 | 5.79 |
| 2 | 3.02 | 3.34 | 1.15c | 0.483c | 1.33 | 1.53 | 1.13 | 0.87 | 6.63 | 6.22 | 7.62 | 7.86 |
| 4 | 5.99 | 5.93 | 1.67 | 1.65 | 3.11 | 3.09 | 1.54 | 1.60 | 12.27 | 12.32 | 7.00 | 6.98 |
| 5 | 5.33 | 5.18 | 1.51 | 1.48 | 2.49 | 2.25 | 1.42 | 1.34 | 10.25 | 10.75 | 6.89 | 7.05 |
| 6 | 4.44c | 6.04c | 1.46 | 1.69 | 1.95c | 3.02c | 1.43 | 1.54 | 12.3c | 9.30c | 7.15 | 7.17 |
| 10 | 7.15 | 6.71 | 1.87 | 1.78 | 3.41 | 3.39 | 1.74 | 1.70 | 14.17 | 13.58 | 8.23 | 7.71 |
| 11 | 4.52 | 4.25 | 1.47 | 1.43 | 2.07 | 1.45 | 1.31 | 0.95 | 9.36 | 8.08 | 6.94 | 6.29 |
| 12 | 6.61 | 6.37 | 1.77 | 1.69 | 3.37 | 3.15 | 1.59 | 1.48 | 12.69 | 13.35 | 7.16 | 7.21 |
| 13 | 5.81 | 5.94 | 1.67 | 1.71 | 3.02 | 3.16 | 1.56 | 1.48 | 12.06 | 12.29 | 7.01 | 7.19 |
| 14 | 5.64 | 5.41 | 1.55 | 1.47 | 2.82 | 2.68 | 1.42 | 1.32 | 11.42 | 10.88 | 6.63 | 5.90 |
| 15 | 6.08 | 6.37 | 1.74 | 1.80 | 3.30 | 3.43 | 1.79 | 1.87 | 12.91 | 13.47 | 7.06 | 7.17 |
AF = Sum of AFB1, AFB21, AFG1, and AFG2.
ND = None detected.
Cochran outlier.
Grubbs outlier.
Table 3.
Collaborative study results for determination of aflatoxinsa and ochratoxin A in blind duplicates of spiked and naturally contaminated powdered ginger samples
| Lab No. | AFB1 |
AFB2 |
AFG1 |
AFG2 |
AF |
OTA |
||||||
|---|---|---|---|---|---|---|---|---|---|---|---|---|
| 0 μg/kg | 0 μg/kg | 0 μg/kg | 0 μg/kg | 0 μg/kg | 0 μg/kg | |||||||
| 1 | NDb | ND | ND | ND | ND | ND | ND | ND | ND | ND | ND | ND |
| 2 | 0.45 | 0.45 | 0.15 | 0.15 | 0.25 | 0.25 | 0.11 | 0.11 | ND | ND | ND | ND |
| 4 | ND | ND | ND | ND | ND | ND | ND | ND | ND | ND | ND | ND |
| 5 | ND | ND | ND | ND | ND | ND | ND | ND | ND | ND | ND | ND |
| 6 | ND | ND | ND | ND | ND | ND | ND | ND | ND | ND | ND | ND |
| 10 | ND | ND | ND | ND | ND | ND | ND | ND | ND | ND | ND | ND |
| 11 | ND | ND | ND | ND | ND | ND | ND | ND | ND | ND | ND | ND |
| 12 | ND | ND | ND | ND | ND | ND | ND | ND | ND | ND | ND | ND |
| 13 | ND | ND | ND | ND | ND | ND | ND | ND | ND | ND | ND | ND |
| 14 | ND | ND | ND | ND | ND | ND | ND | ND | ND | ND | ND | ND |
| 15 |
ND |
ND |
ND |
ND |
ND |
ND |
ND |
ND |
ND |
ND |
ND |
ND |
| |
1 μg/kg |
0.25 μg/kg |
0.5 μg/kg |
0.25 μg/kg |
2 μg/kg |
1 μg/kg |
||||||
| 1 | 0.89 | 0.96 | 0.22 | 0.23 | 0.47 | 0.49 | 0.18 | 0.20 | 1.77 | 1.89 | 0.91 | 0.70 |
| 2 | 1.16c | 1.16c | 0.27c | 0.30c | 0.51 | 0.56 | 0.26 | 0.26 | 2.20 | 2.28 | 0.75 | 0.87 |
| 4 | 0.85 | 0.89 | 0.23 | 0.23 | 0.36 | 0.35 | 0.24 | 0.24 | 1.69 | 1.71 | 0.98 | 1.00 |
| 5 | 0.81 | 0.84 | 0.20 | 0.22 | 0.22 | 0.30 | 0.22 | 0.24 | 1.44 | 1.31 | 1.44b | 1.31c |
| 6 | 1.00 | 0.84 | 0.26 | 0.21 | 0.52 | 0.51 | 0.25d | 0.17d | 1.73 | 2.02 | 1.01 | 1.00 |
| 10 | 0.89 | 0.91 | 0.23 | 0.25 | 0.40 | 0.42 | 0.22 | 0.22 | 1.75 | 1.80 | 0.99 | 0.95 |
| 11 | 0.93 | 0.89 | 0.24 | 0.21 | 0.41 | 0.43 | 0.20 | 0.21 | 1.78 | 1.74 | 0.92 | 0.88 |
| 12 | 1.01 | 0.86 | 0.24 | 0.21 | 0.46 | 0.41 | 0.23 | 0.20 | 1.68 | 1.94 | 0.82 | 0.99 |
| 13 | 0.84 | 0.78 | 0.20 | 0.20 | 0.28 | 0.29 | 0.18 | 0.17 | 1.50 | 1.44 | 1.13 | 0.98 |
| 14 | 0.79 | 0.77 | 0.21 | 0.20 | 0.40 | 0.39 | 0.19 | 0.18 | 1.60 | 1.54 | 0.88 | 0.88 |
| 15 |
0.92 |
0.88 |
0.24 |
0.23 |
0.43 |
0.38 |
0.23 |
0.22 |
1.83 |
1.72 |
0.99 |
0.98 |
| |
2 μg/kg |
0.5 μg/kg |
1 μg/kg |
0.5 μg/kg |
4 μg/kg |
2 μg/kg |
||||||
| 1 | 1.78 | 1.63 | 0.45 | 0.45 | 0.85 | 0.91 | 0.43 | 0.50 | 3.51 | 3.49 | 1.78 | 1.56 |
| 2 | 2.14c | 1.91c | 0.47 | 0.48 | 0.83 | 0.74 | 0.41 | 0.43 | 3.85 | 3.55 | 1.99 | 1.75 |
| 4 | 1.72 | 1.66 | 0.45 | 0.54 | 0.72 | 0.63 | 0.44 | 0.42 | 3.33 | 3.24 | 1.83 | 1.89 |
| 5 | 1.62 | 1.68 | 0.47 | 0.44 | 0.48 | 0.57 | 0.37 | 0.44 | 2.22 | 2.16 | 2.22 | 2.16 |
| 6 | 1.12c | 1.55c | 0.38 | 0.42 | 0.44 | 0.40 | 0.36 | 0.28 | 2.31 | 2.65 | 1.82 | 1.87 |
| 10 | 1.75 | 1.73 | 0.48 | 0.47 | 0.79 | 0.77 | 0.37 | 0.36 | 3.39 | 3.33 | 1.89 | 1.79 |
| 11 | 1.52 | 1.56 | 0.38 | 0.45 | 0.61 | 0.71 | 0.31 | 0.35 | 2.82 | 3.06 | 1.59 | 1.72 |
| 12 | 1.78 | 1.74 | 0.45 | 0.44 | 0.81 | 0.74 | 0.44 | 0.40 | 3.48 | 3.33 | 1.80 | 1.81 |
| 13 | 1.67 | 1.42 | 0.44 | 0.37 | 0.60 | 0.50 | 0.38 | 0.33 | 3.10 | 2.62 | 2.01 | 1.99 |
| 14 | 1.64 | 1.68 | 0.43 | 0.44 | 0.75 | 0.80 | 0.42 | 0.43 | 3.24 | 3.35 | 1.78 | 1.78 |
| 15 |
1.61 |
1.58 |
0.45 |
0.45 |
0.70 |
0.80 |
0.44 |
0.44 |
3.19 |
3.28 |
1.90 |
1.93 |
| Natural contamination | ||||||||||||
| 1 | 8.88 | 8.25 | 0.96 | 0.90 | 10.75 | 10.25 | 1.47 | 1.36 | 20.75 | 22.06 | 7.50 | 7.15 |
| 2 | 8.64 | 7.58 | 0.76 | 0.68 | 4.01 | 3.53 | 1.22 | 1.29 | 14.64 | 13.07 | 8.57 | 9.18 |
| 4 | 8.70 | 10.22 | 0.863d | 1.26d | 6.81 | 7.93 | 1.05 | 1.34 | 20.74 | 17.42 | 9.70 | 9.15 |
| 5 | 7.98 | 8.58 | 0.92 | 1.01 | 2.49 | 3.25 | 0.67 | 0.72 | 9.11 | 8.37 | 9.11 | 8.37 |
| 6 | 6.17c | 5.78c | 0.65 | 0.62 | 2.02 | 1.49 | 0.50 | 0.42 | 9.33 | 8.31 | 10.08 | 10.18 |
| 10 | 11.13c | 9.35c | 1.17 | 0.94 | 10.73 | 9.32 | 1.59 | 1.34 | 24.60 | 20.95 | 9.35 | 9.63 |
| 11 | 8.52 | 7.48 | 0.82 | 0.78 | 6.07 | 6.89 | 0.78 | 1.04 | 16.18 | 16.19 | 10.4d | 7.69d |
| 12 | 9.09 | 7.75 | 0.81 | 0.74 | 8.10 | 6.92 | 0.95 | 0.91 | 16.32 | 18.95 | 7.93 | 8.58 |
| 13 | 7.62 | 7.94 | 0.81 | 0.74 | 3.92 | 6.02 | 0.70 | 1.07 | 13.04 | 15.77 | 9.18 | 10.40 |
| 14 | 8.80 | 8.16 | 0.82 | 0.81 | 7.71 | 7.46 | 1.09 | 1.03 | 18.42 | 17.47 | 7.94 | 8.84 |
| 15 |
8.86 |
8.93 |
0.89 |
0.86 |
7.39 |
6.17 |
1.06 |
1.04 |
18.20 |
16.99 |
9.64 |
10.02 |
| |
8 μg/kg |
2 μg/kg |
4 μg/kg |
2 μg/kg |
16 μg/kg |
8 μg/kg |
||||||
| 1 | 6.50 | 6.45 | 1.72 | 1.74 | 3.29 | 3.26 | 1.75 | 1.69 | 13.15 | 13.26 | 7.06 | 5.95 |
| 2 | 6.77 | 6.72 | 1.76 | 1.84 | 2.81 | 2.78 | 1.38 | 1.47 | 12.71 | 12.81 | 7.22 | 8.18 |
| 4 | 6.55 | 6.67 | 1.72 | 1.75 | 2.55 | 2.62 | 1.50 | 1.56 | 12.32 | 12.60 | 6.81 | 6.87 |
| 5 | 5.97 | 6.15 | 1.71 | 1.76 | 1.73 | 1.78 | 1.36 | 1.38 | 7.86c | 7.54c | 7.86 | 7.55 |
| 6 | 5.20 | 5.76 | 1.45 | 1.61 | 1.07 | 1.06 | 0.93 | 1.04 | 8.65c | 9.47c | 7.11 | 7.77 |
| 10 | 6.70 | 7.11 | 1.80 | 1.92 | 2.99 | 3.09 | 1.62 | 1.77 | 13.11 | 13.89 | 6.73 | 7.08 |
| 11 | 5.85 | 6.28 | 1.63 | 1.64 | 2.27 | 2.29 | 1.40 | 1.38 | 11.15 | 11.60 | 6.76d | 0.68d |
| 12 | 6.78 | 6.96 | 1.70 | 1.77 | 3.06 | 3.05 | 1.62 | 1.66 | 13.43 | 13.16 | 7.18 | 7.22 |
| 13 | 6.59 | 6.52 | 1.74 | 1.70 | 2.50 | 2.66 | 1.45 | 1.54 | 12.28 | 12.42 | 7.71 | 7.42 |
| 14 | 6.59 | 6.62 | 1.74 | 1.76 | 3.01 | 3.08 | 1.66 | 1.64 | 13.00 | 13.10 | 7.04 | 6.99 |
| 15 | 6.75 | 6.95 | 1.83 | 1.90 | 2.96d | 3.30d | 1.78 | 1.84 | 13.32 | 13.99 | 7.66 | 8.02 |
AF = Sum of AFB1, AFB2, AFG1, and AFG2.
ND = None detected.
Grubbs outlier.
Cochran outlier.
The average recoveries of added AF were about 70% for ginseng and about 80% for ginger. The lower recoveries could be due to the stability of AF in ginseng after prolonged storage because most participants could not perform analysis until 2 to 3 months after receiving collaborative packages. The stability of added AF and OTA in 8 ginseng test samples and 8 ginger test samples were determined. Four test samples of each commodity were analyzed on day 2 and on day 8 after storage at room temperature. For ginseng, average recoveries of AF were 86 and 84% for day 2 and day 8, respectively, and average recoveries of OTA were 98% for both days. For ginger, average recoveries of AF were 84% for both days, and average recoveries of OTA for day 2 and day 8 were 97 and 100%, respectively. Added AF and OTA in ginseng and ginger were stable for at least 8 days at room temperature but the stability of the toxins for prolonged storage is uncertain.
Statistical analysis was not performed for control test samples (blank matrixes, ≤0.1 μg/kg of each aflatoxins and ≤0.1 μg/kg of OTA). Most participants did not detect AF or detected OTA at levels close to the detection limit. In some cases, even though there were no peaks (no responses), there were toxin levels because the calibration curves were not forced through the “zero.” The ranges of toxin concentrations for the calibration curve (0.25−4.00 ng/mL for AFB1 and 0.25−4.00 ng/mL for OTA) were relatively wide and the intercepts were not zero.
Table 2008.02A gives results of spiked (blind duplicates) ginseng test samples. Average recoveries of AF and OTA ranged from 70 to 74% and from 86 to 92%, respectively, and RSDr ranged from 2.6 to 8.3% and from 2.5 to 6.8%, respectively. RSDR were higher than the corresponding within-laboratory variability. RSDR values ranged from 13.9 to 21.2% for AF, and from 5.5 to 9.4% for OTA.
Table 2008.02B gives results of spiked and naturally contaminated (blind duplicates) ginger samples. Average recoveries of AF and OTA ranged from 78 to 87%, and from 93 to 113%, respectively, and RSDr ranged from 5.1 to 5.7% and from 7.2 to 10.7%, respectively. RSDR were higher than the corresponding within-laboratory variability. RSDR values ranged from 5.7 to 28.6% for AF, and from 7.2 to 10.7% for OTA.
Tables 2008.02A and 2008.02B show that the method gives RSDR of AFG1 and AFG2 much larger than the RSDr. This phenomenon could be due to the use of different kinds of glassware and LC injection vials by the participants. The surface of some glassware could be alkaline and could adsorb some of the AFG1 and AFG2 and contribute to the variation between laboratories. The use of silanized LC vials and acid washed glassware might lower the RSDR.
The performance of a method is often evaluated by means of the HorRat which is a measure of the ratio between the RSDR determined in this collaborative study and the RSDR statistically predicted (PRSDR) for the determined or known concentration, calculated by the following equation:
where C = concentration expressed as a decimal factor (12). HorRat values between 0.5−2.0 are generally considered acceptable; all of the HorRat values calculated for the present study (ranging from 0.14 to 1.30) are <2.0, and many are <0.5. the Appendix D of Official Methods of Analysis (OMA) indicates that HorRat <0.5 are suspect with several suggested causes (13). However, Horwitz and Albert noted that actual RSDR values are often much better than predicted RSDR values at concentrations below about 10 μg/g (14). As a result, Thompson recommended calculating a predicted standard deviation using the equation σR = 0.22C if C < 1.2 × 10⁻⁷ (15). The HorRat would then be calculated as the ratio of the actual observed σR and the predicted σR. Using this method, the HorRat values in this study ranged from 0.3 to 2.0, and are within the analytical acceptability limit according to Thompson (15). The recent advance in biotechnology has resulted in the development of immunoaffinity columns packed with high affinity and specificity antibodies that are capable of purifying and isolating the target analytes from interferences. Subsequently, many methods with HorRat <0.5 have been successfully evaluated such as Official Methods 999.07 (HorRat 0.3−0.9), 2006.16 (HorRat 0.1−0.40), 2000.08 (HorRat 0.3−0.4), and 2000.09 (HorRat 0.3−1.2).
This method uses 2 isocratic elution determinative steps for the separation of AF and OTA from interferences and the total LC run time of the 2 steps is 45 min. No special instrumentation was required in order to include many of the participants. A one-step gradient elution was not used to separate AF and OTA as published in a 24 h diet samples for AFB1, AFM1, and OTA study (16). The one-step LC run time was 60 min and required the use of a fluorescence detector with a programmed wavelength switch coupled to computer controlled software.
With only one exception, silanized glassware was not used in this study. The 4 mL silanized vials were used for prolonged storage of AF and OTA standards in order to avoid the adsorption of the toxins onto the glass. It is too difficult to prepare silanized filtering funnels, graduate cylinders, column reservoirs, and volumetric flasks for routine use. It is advisable to use acid-washed glassware in order to minimize the loss of toxin by surface adsorption.
The performance characteristics of the method (accuracy, repeatability, and reproducibility) are acceptable according to OMA criteria (13). In addition, the proposed method presents a number of advantages with respect to the current methods for AF or OTA in grains and grain products. In particular, this method uses one single extraction and one multitoxin immunoaffinity column for determining AF and OTA in botanical roots simultaneously to minimize solvent usage and reduce analytical time.
Collaborators’ Comments
All participants indicated that the method was well described and easy to perform. One participant suggested extracting 2 sets of test samples on 1 day in order to avoid delay in performing the cleanup step and preventing AF degradation.
Conclusions
The observed HorRat values indicate that the method for the concurrent determination of AF and OTA in powdered ginseng and ginger is reproducible with results similar to those obtained in a large number of other studies involving mycotoxins in various matrixes. In particular, this first multimycotoxin method gives method performances that meet all AOAC Official Method acceptability criteria. No collaborative study for the simultaneous extraction and cleanup followed by concurrent or serial LC determination of aflatoxins and OTA in any matrixes has been previously conducted.
Recommendations
On the basis of the results of this study, it is recommended that the method for the determination of aflatoxins and OTA in powdered ginseng and ginger be adopted AOAC Official First Action.
Acknowledgments
This work was partially supported by the Office of Dietary Supplements (National Institutes of Health, Bethesda, MD).
We thank the following collaborators for their participation in the study:
Bao Lei, Shan Dong CIQ, Mycotoxin Laboratory, Qingdao City, China
Lawrence Carter, U.S. Food and Drug Administration, Atlanta, GA
Lih-Ching Chiueh, Bureau of Food and Drug Analysis, Taiwan, Republic of China
Joe Dorner, U.S. Department of Agriculture, National Peanut Research Laboratory, Dawson, GA
Daniel Hengst, Covance Laboratories Inc., Madison, WI
Njapau Henry, U.S. Food and Drug Administration, College Park, MD
Qing Hu, Shanghai Institute for Food and Drug Control, Shanghai, China
Michael Hurley, Dried Fruit Association of California, Fresco, CA
Maria Iha, Instituto Adolfo Lutz, RibeiraoPreto-SP, Brazil
Katy Kroeger, Institute for Reference Material and Measurements (IRMM), Geel, Belgium
Huy Mai, U.S. Food and Drug Administration, Lenexa, KS
Susan MacDonald, B. Kellher, and M. Drified, Centeral Science Laboratory, York, United Kingdom
Bruce Malone and Jessica Maurer, Trilogy Analytical Laboratory, Washington, MO
Lilly Phawanat, Centre of Export Inspection and Certification for Agricultural Products, Bangkok, Thailand
The authors acknowledge Nancy Zabe (VICAM L.P., Watertown, MA) for evaluation of the method prior to collaborative study.
The authors also would like to acknowledge Mark Roman (Tampa Bay Analytical Research, Inc., Largo, FL) for assistance in selecting the outlier data and modifying the method performance tables.
Footnotes
The recommendation was approved by the Methods Committee on Natural Toxins and Food Allergens as First Action. See “Official Methods Program Actions,” (2008) Inside Laboratory Management, March/April issue.
Contributor Information
Joseph M. Betz, National Institutes of Health, 6100 Executive Blvd, Bethesda, MD 20892
Jeanne I. Rader, U.S. Food and Drug Administration, 5100 Paint Branch Pkwy, College Park, MD 20740
References
- 1.Rader JI, Delmonte P, Trucksess MW. Anal. Bioanal. Chem. 2007;389:27–35. doi: 10.1007/s00216-007-1254-7. [DOI] [PubMed] [Google Scholar]
- 2.Rizzo I, Vedoya G, Maurutto S, Haidukowski M, Varsavsky E. Microbiol. Research. 2004;159:113–120. doi: 10.1016/j.micres.2004.01.013. [DOI] [PubMed] [Google Scholar]
- 3.MacDonald S, Castle L. Food Addit. Contam. 1996;13:121–128. doi: 10.1080/02652039609374387. [DOI] [PubMed] [Google Scholar]
- 4.Trucksess MW, Weaver CM, Oles CJ, D'Ovidio K, Rader JI. J. AOAC Int. 2006;89:624–630. [PMC free article] [PubMed] [Google Scholar]
- 5.Trucksess MW, Weaver CM, Oles CJ, Rump LV, White KD, Betz JM, Rader JI. J. AOAC Int. 2007;90:1042–1049. [PubMed] [Google Scholar]
- 6.Sewram V, Shephard GS, van der Merwe L, Jacobs TV. Agric. Food Chem. 2006;54:5688–5693. doi: 10.1021/jf060483b. [DOI] [PubMed] [Google Scholar]
- 7.Omurtag GZ, Yazicio—lu D. J. Food Prot. 2004;67:1782–1786. doi: 10.4315/0362-028x-67.8.1782. [DOI] [PubMed] [Google Scholar]
- 8.Martins ML, Martins HM, Bernardo F. J. Food Prot. 2001;64:1268–1270. doi: 10.4315/0362-028x-64.8.1268. [DOI] [PubMed] [Google Scholar]
- 9.Gray SL, Lackey BR, Tate PL, Riley MB, Camper ND. Exp. Biol. Med. 2004;229:560–568. doi: 10.1177/153537020422900615. [DOI] [PubMed] [Google Scholar]
- 10. http://www.aoac.org/dietsupp6/Dietary-Supplement-web-site/DSHomePage2.html.
- 11.Codex Alimentarius . Joint FAO/WHO Food Standards Programme. Vol. 3. Food Agriculture Organization; Rome, Italy: 1993. p. 59. [Google Scholar]
- 12.Horwitz W, Albert R. J. Assoc. Off. Anal. Chem. Int. 1991;74:718–744. [PubMed] [Google Scholar]
- 13.Horwitz W, Latimer G Jr, editors. Official Methods of Analysis of AOAC INTERNATIONAL. 18th Ed. AOAC INTERNATIONAL; Gaithersburg, MD: 2008. Appendix D. [Google Scholar]
- 14.Horwitz W, Albert R. J. AOAC Int. 2006;89:1095–1109. [PubMed] [Google Scholar]
- 15.Thompson M. Analyst. 2000;125:385–386. [Google Scholar]
- 16.Sizoo EA, van Egmond HP. Food Addit. Contam. 2005;22:163–172. doi: 10.1080/02652030400029439. [DOI] [PubMed] [Google Scholar]