

Ventricular bigeminy refers to the appearance of paired different ventricular complexes in the body-surface ECG (Figure, A inset, lead V2). From this ECG morphology, it has been inferred that bigeminy is generated by interaction between an extrasystolic beat and a regular periodic ventricular beat.1 The regular beat is typically generated by sinus rhythm but could also be a paced rhythm. The mechanism of ventricular bigeminy was inferred mainly on the basis of analysis of body-surface ECG signals.1,2 However, the ECG measures the reflection of cardiac electrical activation at a limited number of points, on the body surface, remote from the heart. It does not provide detailed information about cardiac activation patterns, data that are necessary for understanding the mechanism of ventricular bigeminy.
Figure.
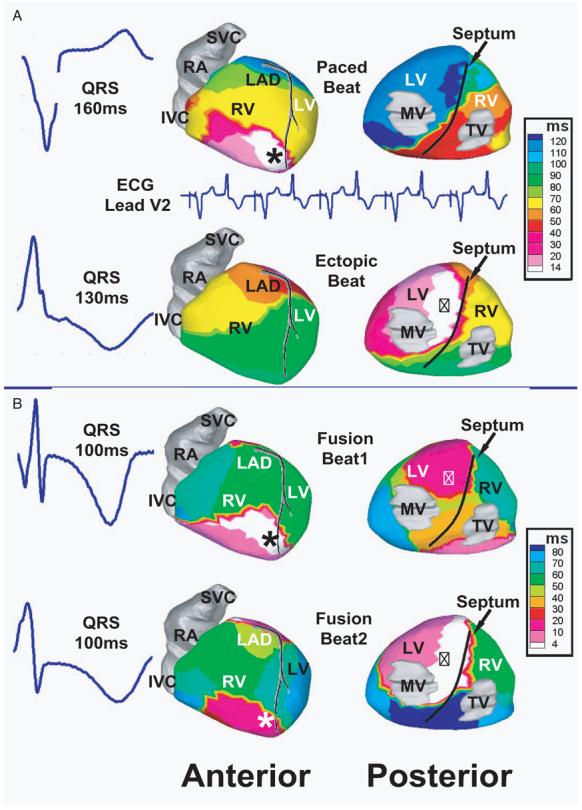
A, The ventricular activation sequence during bigeminy. Top row shows activation sequence for a paced beat from a pacemaker lead located at right ventricular (RV) apex (black asterisk) in the anterior and posterior views (with atria removed). Bottom row shows activation during an extrasystolic beat from a left ventricular (LV) ectopic site (triangles). B, Ventricular activation sequence during 2 different fusion beats between the paced beat and extrasystolic beat. In the top row, the onset of paced activation precedes that of extrasystolic activation by 15 ms. In the bottom row, the extrasystole onset precedes the paced beat by 10 ms. RA indicates right atrium; SVC, superior vena cava; IVC, inferior vena cava; MV, mitral valve; and TV, tricuspid valve. The solid black line in the posterior view indicates septum location.
Here we apply noninvasive electrocardiographic imaging (ECGI)3 to image ventricular epicardial activation during bigeminy in a patient with atrial fibrillation who underwent atrioventricular node ablation and pacemaker implantation in the right ventricular apex (asterisk in anterior view). ECGI is a functional imaging modality that combines 250 body-surface ECGs with thoracic computed tomography.3,4 By using inverse reconstruction algorithms, ECGI noninvasively generates electroanatomic maps on the epicardial surface of the heart. After extensive validation, it has been applied in human subjects with various cardiac electrophysiological conditions.5-8
The Figure (A) shows the sequence of ventricular activation during bigeminy. The top row demonstrates the regular paced beat, with wavefront propagation from the pacing site to the rest of the heart over a duration of 160 ms because of slow activation in the absence of conduction system participation. The bottom row shows activation during the following beat, with wavefront propagation from a left ventricular ectopic initiation site (triangles in posterior view) to complete ventricular activation in 130 ms. The interaction between the extrasystolic beat and the paced beat generates the bigeminy. Occasionally, we captured and imaged fusion between the paced rhythm and the extrasystole. Such fusion beats are shown in the Figure (B). In the top row, the initiation of paced activation precedes that of extrasystolic activation by 15 ms. This closely coupled biventricular activation increases electrical synchronization and reduces the QRS duration to 100 ms. In the bottom row, the sequence is reversed, and the extrasystole initiation precedes the paced beat by 10 ms, with fusion beats of similar duration but different morphology. These first ECGI images of bigeminy in a human subject provide detailed epicardial activation sequences, confirming the origin of bigeminy in the interaction between an extrasystolic beat and a regular periodic beat.
Acknowledgments
Sources of Funding
This study was supported by NIH–NHLBI Merit Award R37-HL-33343 and Grant R01-HL-49054 (to Dr Rudy). Dr Rudy is the Fred Saigh Distinguished Professor at Washington University in St Louis.
Footnotes
Disclosures
Dr Rudy chairs the scientific advisory board of and holds equity in CardioInsight Technologies. CardioInsight Technologies does not support any research conducted by Dr Rudy, including that presented here.
References
- 1.Langendorf R, Pick A, Winternitz M. Mechanisms of intermittent ventricular bigeminy, I: appearance of ectopic beats dependent upon length of the ventricular cycle, the “rule of bigeminy.”. Circulation. 1955;11:422–430. doi: 10.1161/01.cir.11.3.422. [DOI] [PubMed] [Google Scholar]
- 2.Langendorf R, Pick A. Mechanisms of intermittent ventricular bigeminy, II: parasystole, and parasystole or re-entry with conduction disturbance. Circulation. 1955;11:431–439. doi: 10.1161/01.cir.11.3.431. [DOI] [PubMed] [Google Scholar]
- 3.Ramanathan C, Ghanem RN, Jia P, Ryu K, Rudy Y. Noninvasive electrocardiographic imaging for cardiac electrophysiology and arrhythmia. Nat Med. 2004;10:422–428. doi: 10.1038/nm1011. [DOI] [PMC free article] [PubMed] [Google Scholar]
- 4.Ramanathan C, Jia P, Ghanem RN, Ryu K, Rudy Y. Activation and repolarization of the normal human heart under complete physiological conditions. Proc Natl Acad Sci, U S A. 2006;103:6309–6314. doi: 10.1073/pnas.0601533103. [DOI] [PMC free article] [PubMed] [Google Scholar]
- 5.Ghanem RN, Jia P, Ramanathan C, Ryu K, Markowitz A, Rudy Y. Noninvasive electrocardiographic imaging (ECGI): comparison to intra-operative mapping in patients. Heart Rhythm. 2005;2:339–354. doi: 10.1016/j.hrthm.2004.12.022. [DOI] [PMC free article] [PubMed] [Google Scholar]
- 6.Intini A, Goldstein RN, Jia P, Ramanathan C, Ryu K, Giannattasio B, Gilkeson R, Stambler BS, Brugada P, Stevenson WG, Rudy Y, Waldo AL. Electrocardiographic imaging (ECGI), a novel diagnostic modality used for mapping of focal left ventricular tachycardia in a young athlete. Heart Rhythm. 2005;2:1250–1252. doi: 10.1016/j.hrthm.2005.08.019. [DOI] [PMC free article] [PubMed] [Google Scholar]
- 7.Jia P, Ramanathan C, Ghanem RN, Ryu K, Varma N, Rudy Y. Electrocardiographic imaging of cardiac resynchronization therapy in heart failure: observation of variable electrophysiologic responses. Heart Rhythm. 2006;3:296–310. doi: 10.1016/j.hrthm.2005.11.025. [DOI] [PMC free article] [PubMed] [Google Scholar]
- 8.Wang Y, Cuculich PS, Woodard PK, Lindsay BD, Rudy Y. Focal atrial tachycardia after pulmonary vein isolation: noninvasive mapping with electrocardiographic imaging (ECGI) Heart Rhythm. 2007;4:1081–1084. doi: 10.1016/j.hrthm.2007.04.014. [DOI] [PMC free article] [PubMed] [Google Scholar]