Abstract
Objectives
To more fully understand the mechanisms of vocal fold vibration and sound production, we studied the velocity flow fields above the folds. Such velocity fields during phonation have not been reported in the literature.
Methods
Using the particle image velocimetry method for 3 excised canine larynges, we obtained the velocity fields in the mid-membranous coronal plane during different phases of phonation. The velocity field was determined synchronously with the vocal fold motion recorded by high-speed videography.
Results
The results show that vortices occur immediately above the vocal folds and that the location and shape of the vortices depend on the phase of the phonation cycle. Consistent vortical structures found included starting vortices, Kelvin-Helmholtz vortices, entrainment vortices, and vortices directly above the folds during the divergent glottal stage.
Conclusions
These vortical structures were consistently found during specific phases of the glottal cycle for 3 canine larynges that significantly varied in size. This consistent behavior suggests that the vortices may be important for both vibration and sound production; however, further study is needed to prove this. The clinical significance of these vortices is discussed.
Keywords: laryngeal disease, larynx, phonation, voice disorder
INTRODUCTION
Modeling flow through the glottis is an important component of current biophysical models of voice production.1 Airflow through the glottis produces forces that drive vocal fold vibration. In addition, certain airflow patterns may produce sound by mechanisms other than flow modulation due to vocal fold vibration.2,3 Theoretical models make assumptions and predictions about the flow patterns through the glottis, but many of these assumptions have not yet been tested in an animal model.
The flow patterns of interest in this report are vortices, or areas of concentrated rotational motion. Vortices can be associated with relatively significant negative or positive pressures, depending on their location and the direction of rotation relative to the main flow. Vortices associated with negative pressure could cause an additional force during closing, if they occur within the glottis. If vortices do occur in the glottis during closing, flow separation is the presumed mechanism of vortex formation. Because of increasing pressure in a divergent duct (adverse pressure gradient), the edges of the flow can separate from the main flow; this separated flow takes the form of vortices that can travel downstream. The glottis is divergent during the closing phase, and separation has been predicted and demonstrated in a variety of models.
Pelorson et al4 predicted that flow separation occurs in the divergent glottis during closing by using analytical methods; separation was predicted to occur along both sides of the glottal duct in a symmetric fashion. Zhao et al5 showed separation in their computational model of forced vocal fold motion. Alipour and Titze1 showed asymmetric flow separation within the glottis in a computational model. Shinwari et al6 showed asymmetric flow separation in a static mechanical model of a symmetric glottis with a 10° divergence angle. Flow separation in the glottis may also lower the phonation threshold pressure, thus making it easier for the vocal folds to vibrate.7 Vortex formation and shedding have been seen in computational simulations of 2-dimensional flow through a glottis with a static diverging shape8 and through a physical model of vibrating vocal folds.9 Vorticity has also been observed in mechanical models using flow visualization.4,9
Vortices can also be a source of sound. The acoustic significance of vortices has been investigated in a dynamic mechanical model of the vocal folds and vocal tract10; these studies suggest that there is sound produced by the interaction of the vortices with the vocal tract.
The results of theoretical and mechanical approaches have added to our understanding of the mechanisms of phonation. However, the link to human phonation needs to be made through tissue models. In particular, investigation of the glottal flow in an animal model is needed to test and refine current computational, theoretical, and mechanical models. Experimental characterization of phonatory jet flow in animals has consisted mostly of velocity measurements above the glottis. Velocities obtained from hot-wire anemometry during phonation have been described in the in vivo canine larynx11,12 and the excised canine larynx.13 The measurements are consistent with complex turbulent jet flow exiting the glottis. In these experiments, a single hot-wire anemometer was used to measure velocity 1 cm above the glottis. Measurements were not made within the first centimeter above the glottis because placement in this location would interfere with vocal fold vibration and damage the probe tip.11 Also, a single element hot-wire measures the absolute value of the velocity magnitude that is perpendicular to its axis; therefore, only 1 velocity component can be resolved, and this magnitude may not be accurate if there are components of flow that are not perpendicular to the measuring element. Single hot-wires are most useful when there is only 1 significant unidirectional component of the velocity in the jet flow. Also, the flow direction relative to the wire cannot be determined; thus, flow reversal cannot be identified.14 This makes it difficult to detect rotational motion. Multiple element hot-wires could be used o t determine all velocity components, but they still cannot detect flow reversals. Sensors with multiple hot-wires are bulky and therefore can interfere with flow and would be more difficult to place within the first centimeter downstream of the glottis. However, the computational and theoretical models mentioned above suggest that the velocities in and above the glottis have at least 2 significant velocity components and that there is a rotational motion. Particularly in complex jet flow, there may be discernible vortices and patterns that are difficult to detect by hot-wire anemometry techniques. For similar reasons, particle image velocimetry (PIV) in conjunction with anemometry is often used in engineering applications. Particle image velocimetry can be used to qualitatively and quantitatively characterize vortices and circulation.
In the PIV method, micron-size particles or droplets are injected into the flow in order to render it visible when illuminated. Illumination is produced by a laser beam that is spread into a light sheet with a cylindrical lens. The laser is pulsed such that 2 sheets are produced microseconds apart. Both images are recorded on a specialized camera. Computer analysis of the resultant images correlates the particles in the 2 images, allowing a displacement field to be calculated. Since the time between the 2 images is known, a velocity field can be calculated. The advantage of the PIV technique is that it is non-invasive and can give the magnitude and direction of velocity vectors in any plane of a complex flow field at a given instance of time.14
METHODS
The methodology, reliability, and validity of the phonation method and our experimental techniques are briefly described below.
Excised canine larynges were harvested from shared research dogs immediately after the animals were euthanized. The first larynx was from a female mongrel dog weighing approximately 22 kg. The membranous folds were approximately 20 mm in length from the vocal process to the anterior commissure. The second and third larynges were from female mongrel dogs weighing 16 and 13 kg, respectively. The length of the membranous folds was 13 mm for the second animal and 9.5 mm for the third one. Immediately after harvest, the larynx was placed in normal saline solution (0.9% sodium chloride) and refrigerated.
The results shown below are all from experiments conducted 1 day after harvest. At this time, all cartilage and soft tissue above the vocal folds were removed. Their removal produced an unobstructed view of the vocal folds. The tracheas were 8 to 10 cm long.
For all animals, the inferior 4 cm of the trachea was placed over a rigid tube (inner diameter of 1/2 inch or 12.7 mm and outer diameter of 5/8 inches or 15.9 mm). A stitch was used to adduct the vocal processes. One suture was placed through both vocal processes at the same level. A phonosurgeon placed this stitch with the aid of magnification. The stitch was tied with the minimal tension needed to have a prephonatory width between the vocal processes of 0 mm. Special care was taken to position the suture symmetrically in both the anterior-posterior and inferior-superior directions. The posterior glottis was left open. The larynx was fixed in space by use of a square mounting apparatus that had double prong pins on each side. Each pin was inserted into the cricoid cartilage. The mounting apparatus was connected to a heavy external frame that was bolted to the floor. Electroglottography (EGG) clip electrodes were placed on the soft tissue lateral to the vocal folds on each side. A microphone was placed 1.5 inches (38.1 mm) to the side of the glottal exit in such a way that it did not interfere with laryngeal airflow or with the laser illumination.
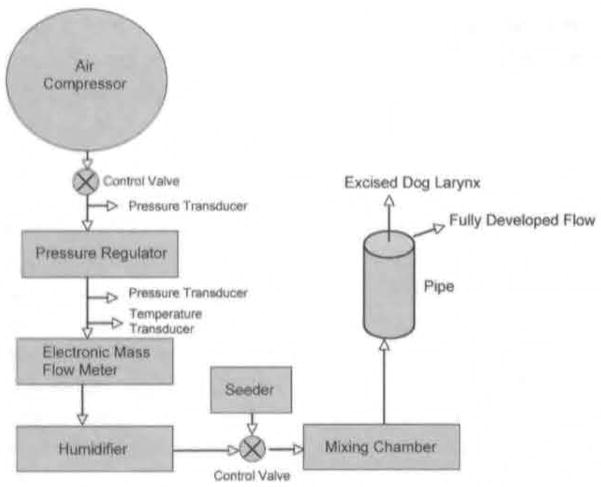
The flow that exited the rigid tube and entered the trachea was supplied by a compressor that could produce a maximum flow rate of 2,500 cm3/s at 35 psi. A schematic of the setup is given in Fig 1. A pressure regulator, a thermocouple, electronic pressure gauges, a mass flow meter, and an electronic control valve were used to regulate the air upstream. The air was moistened by a humidifier with thermostat control (Conchatherm III, Hudson Respiratory Care Inc. Temecula, California). The air was then mixed with seeding aerosolized olive oil particles in a settling chamber. The typical particle diameter of the seed was determined previously to be in the range of 10 to 15 μm. A high-speed video camera (High Speed Phantom Works Version 7.1. Vision Research, Wayne, New Jersey) was placed approximately 1 m above the glottal exit in order to visualize vocal fold vibration.
Fig 1.
Schematic of airflow.
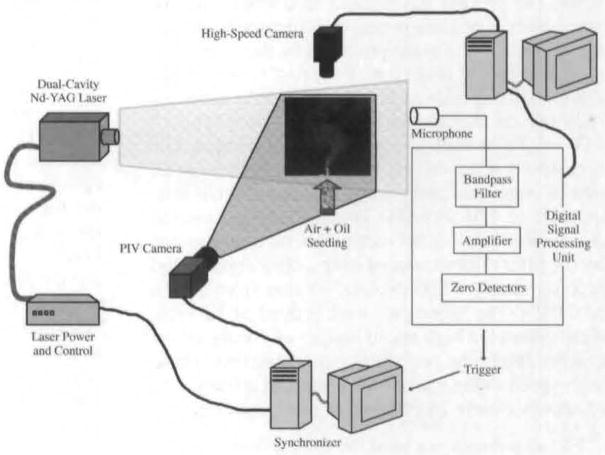
A 2-dimensional PIV system was used, comprising a frequency doubled neodymium:yttrium-aluminum-garnet laser with dual cavity (Solo-PIV, New Wave Research, Fremont, California) integrated with a PIV camera. The PIV camera and laser were placed in perpendicular axes. A schematic is shown in Fig 2. Preliminary acoustic, EGG, and high-speed imaging studies indicated that both the acoustic signal and vocal fold motion were periodic, with a frequency of 130 to 300 Hz. Since both the acoustic and EGG signals showed a dominant frequency component corresponding to the phonation cycle, either of these could be used as a trigger source for obtaining the phase-locked PIV. In the current study, the microphone signal was used as a trigger source. A fourth-order bandpass with lower and upper cutoff frequencies of 60 and 550 Hz was used to filter the microphone signal. This was then sent into a zero crossing detector that generated a pulse waveform) that was 5 V when the signal was above 0 V and was 0 V otherwise. This square waveform was then sent to the PIV hardware as a trigger to obtain images at a particular phase. A total of 30 phases was obtained by varying the delay between the square waveform and the trigger sent to the PIV hardware. Ten images were acquired at every phase to reconstruct the phase-averaged images over the equivalent of 1 period of the acoustic signal. A data acquisition card was used to record the acoustic, trigger, and EGG signals. The data acquisition card receives a trigger from the high-speed camera that initiates image and signal acquisition. This entire process provided a time correlation between the different measurements such as the EGG waveform, the microphone signal, the high-speed image, and the phase-locked PIV vector field.
Fig 2.
Schematic of setup. Nd-YAG – neodymium:yttrium-aluminum-garnet; PIV – particle image velocimetry.
The error associated with determining the phase can be calculated as follows. The sampling rate used is 20,000 per cycle. This means that sampling occurs every 50 μs. The time delay between the microphone or EGG signal and the signal being picked up by the computer is 2 μs. Thus, the largest possible error will be 52 μs. To convert this to degrees, one needs the fundamental frequency. For the first animal, the fundamental frequency was 200 Hz, which results in a period of 5 ms or 5,000 μs. Thus, the maximal error is [52(10−6)/5,000(10−6)J × 360 or 3.7°.
The laser was focused and spread to produce a laser light sheet in the coronal plane at a position halfway between the vocal process and the anterior commissure. The thickness of the laser sheet was 1 mm. Rhodamine G powder was placed on the paraglottic tissue and thyroid cartilage to reduce reflections. The powder never came in contact with the vocal folds. The camera was then focused to visualize the flow in the plane produced by the laser sheet and to give a focused view of the first 12 mm above the glottal exit. For each animal, 10 PIV fields for each one of the 30 phases were recorded. The 10 PIV images at each phase were then averaged. The high-speed imaging and PIV measurements for all phases were obtained during 1 phonation trial lasting 120 to 180 seconds. The vocal fold vibration was periodic during the measurement, as evidenced by the jitter rates measured over a 20-second period (approximately 4,000 cycles), ranging from 0.03% to 0.05%. The vibrations were judged to be symmetric from the high-speed images of vocal fold vibration during the periods of data collection. These high-speed video images were taken at a frame rate of approximately 28,000 frames per second (fps).
For all animals, we used the lowest flow rate that produced stable phonation and reliable EGG and microphone signals. Larger flow rates were required for larger larynges, as will be seen in the next section.
RESULTS
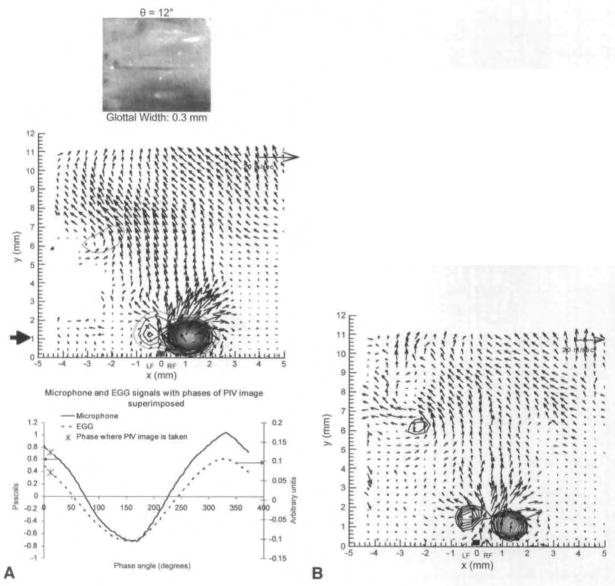
Figure 3A and Figs 4–10 show the phase-averaged velocity fields measured by PIV at different phases for the first animal. Figure 3B shows the instantaneous image that corresponds to Fig 3A. For this animal, the distance between the vocal process and the anterior commissure was 20 mm, so these fields are in the coronal plane at a point 10 mm posterior to the anterior commissure. The volumetric flow rate was 450 cm3/s, and the average subglottal pressure was 7 cm H2O. The fundamental frequency was 200 Hz, so the duration of each cycle was 0.005 second. Degrees are used to describe the location in the phonation cycle. Each cycle is 360° (or 0.005 second), and 0° corresponds to the beginning of opening.
Fig 3.
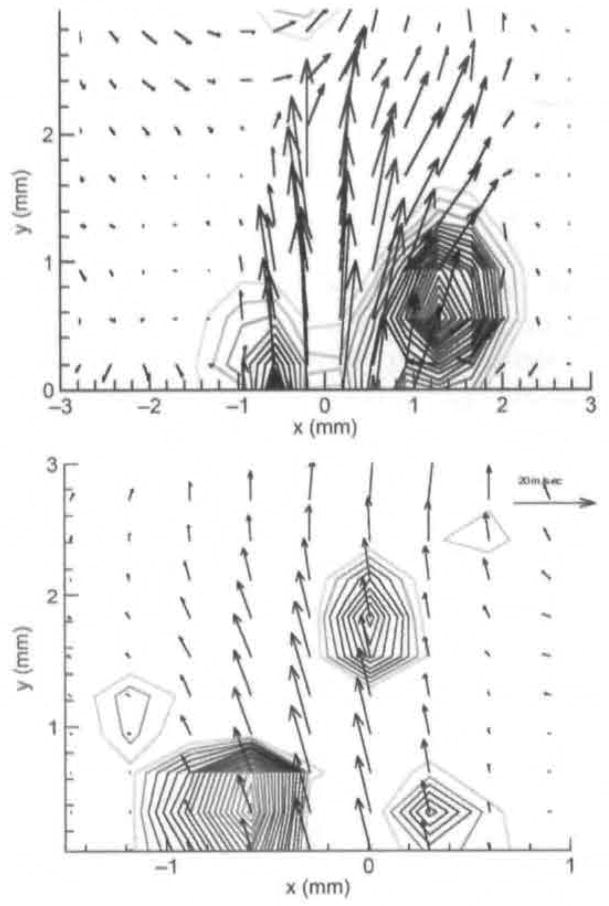
A) Averaged PIV velocity field for phase 12°, which is at beginning of opening. High-speed visualization of vocal folds from above is shown on top. Bold line on x-axis indicates position and width of glottal gap at mid-membranous points at this phase. Time this field was taken is marked on both eleclro-gloltography (EGG) and microphone signals, which are seen on bottom. Strong vortex is seen above right fold (RF), and weaker one above left fold (LF), B) Instantaneous PIV field for 12°. This is 1 of 10 fields that are averaged to produce field seen in A.
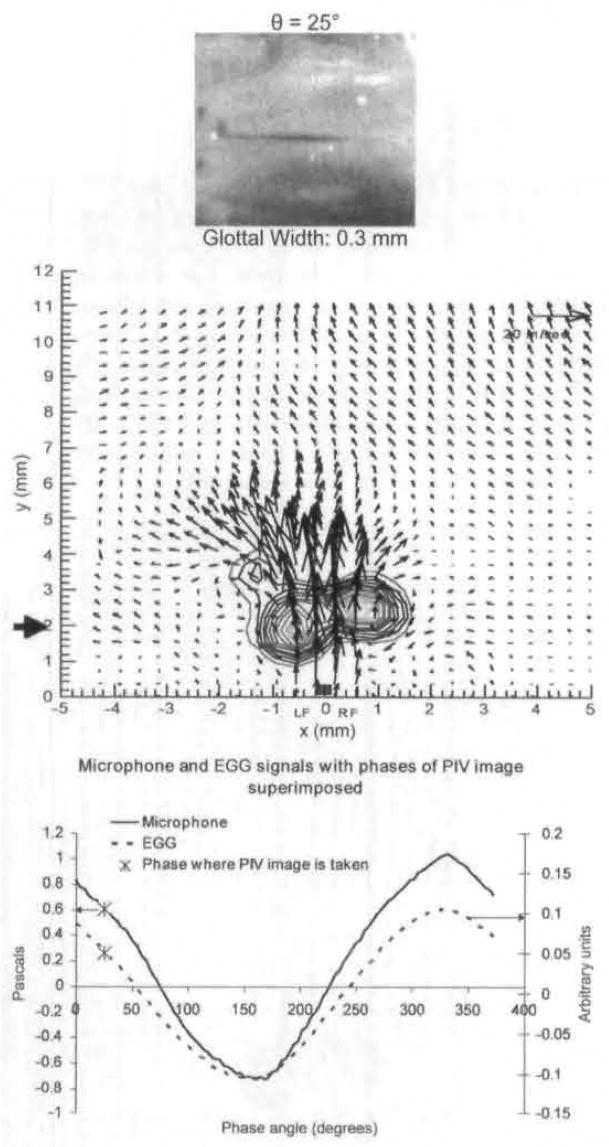
Fig 4.
Average PIV velocity, high-speed image, and EGG and microphone signal location for 25°, which is still in early opening. Vortices are seen near glottal exit on both sides.
Fig 10.
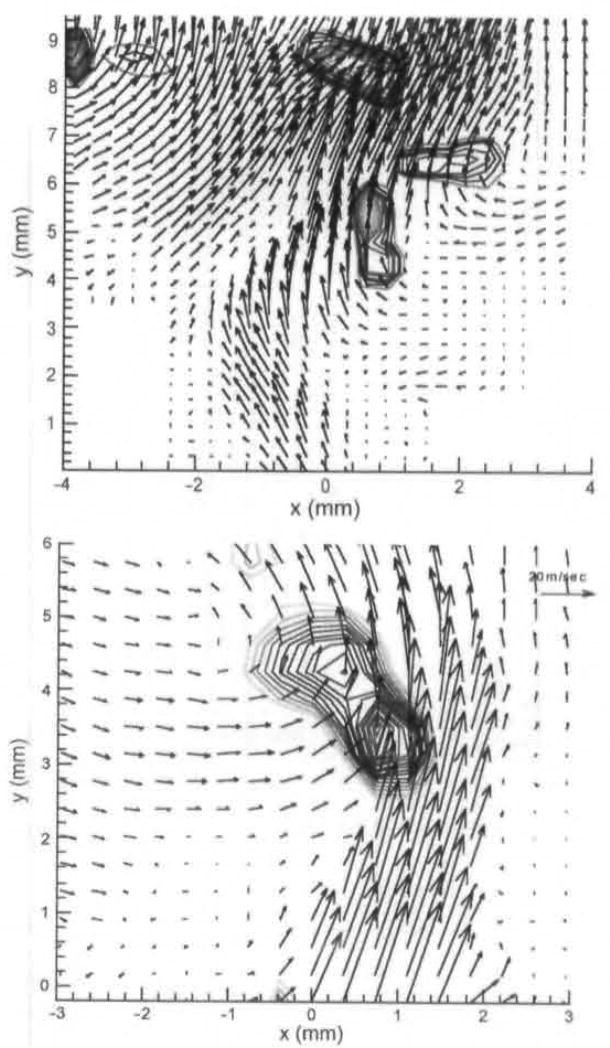
Vortices at mid- to late opening seen in averaged PIV fields. Top is for animal 2 at 272°. Bottom is for animal 3 at 290°
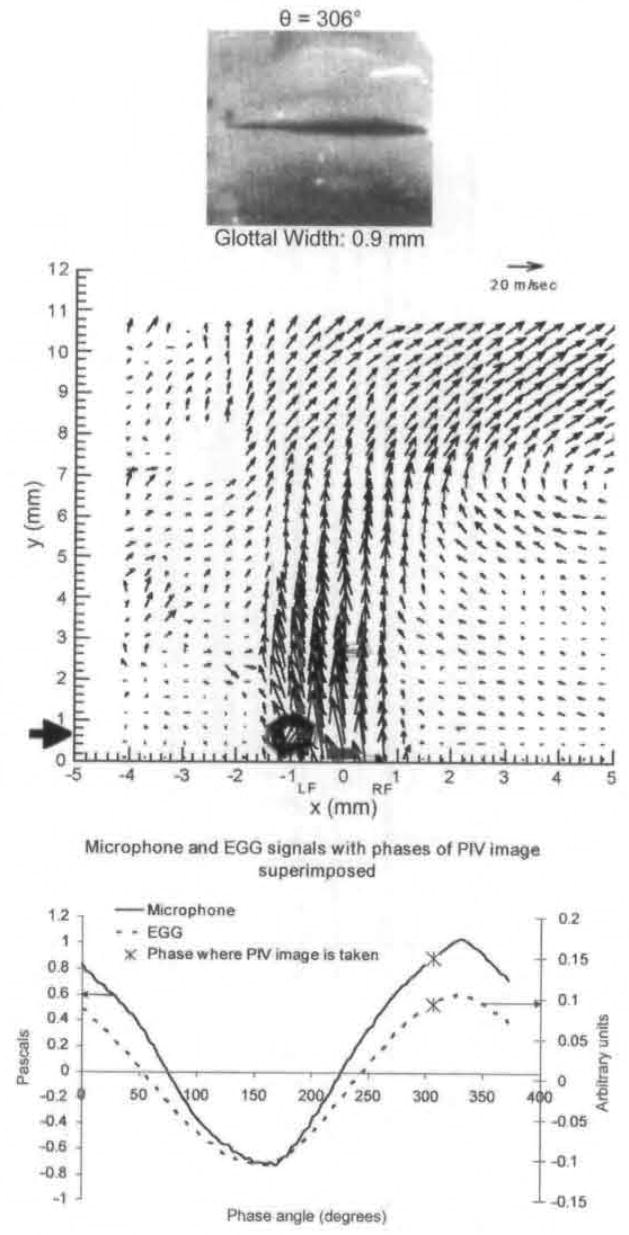
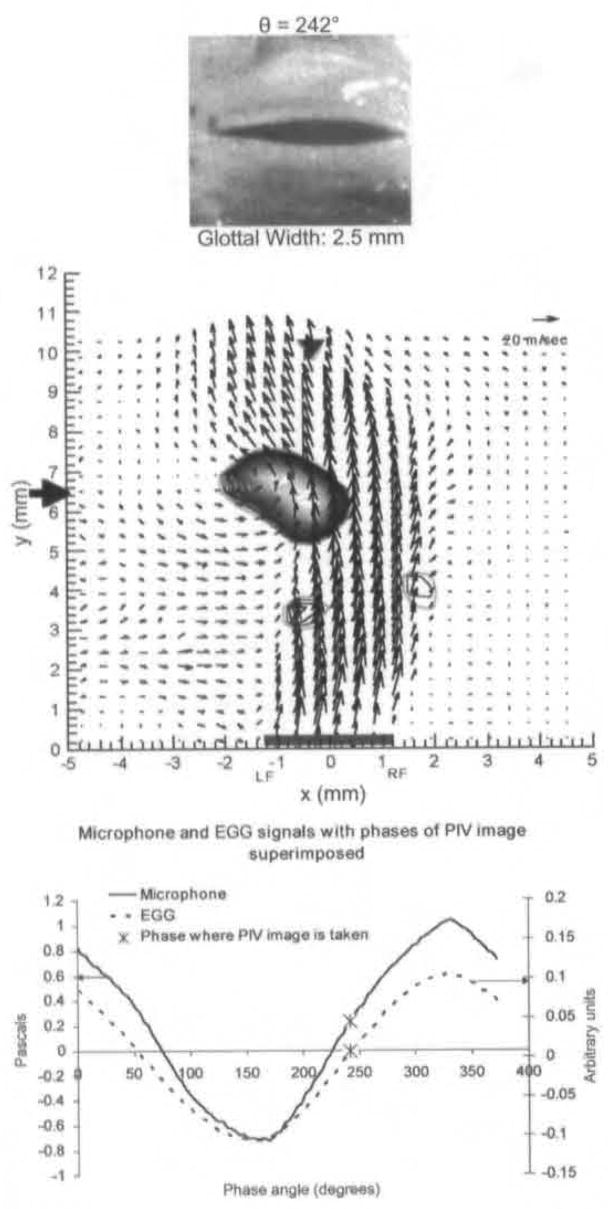
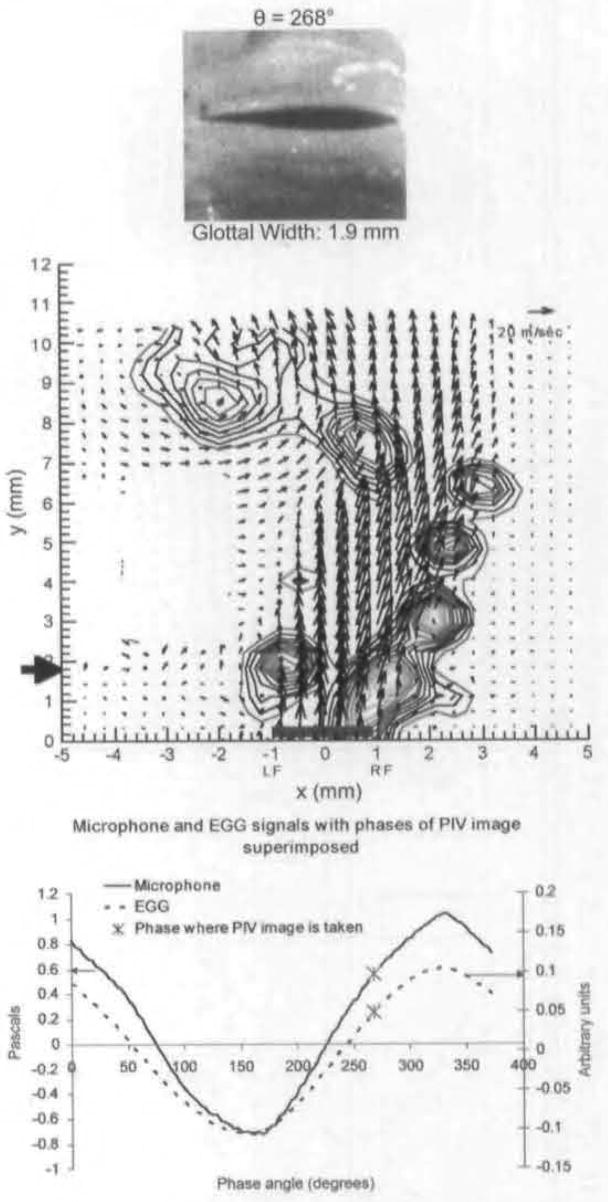
In the velocity fields, the length of the vector is proportional to the velocity magnitude. A reference vector length is shown on the top right of the velocity field. Vortices are represented by circular isocontours that represent rotational motion (see, for example, bottom center in Fig 3A). The denser the isocontours are, the faster the rotational motion. The glottal width is measured at the mid-membranous plane that is illuminated by the laser. For each phase, 10 instantaneous PIV images are taken, and the shown fields are the phase-average of these images. In order for one to see vortices in the averaged images, the vortices have to be consistent in both phase and spatial location. There are small variations, however. A PIV image averaged from 10 instantaneous images is shown in Fig 3A. Figure 3B shows 1 of the 10 instantaneous images. The images are similar, but the vortex above the left fold in Fig 3B is stronger than that in Fig 3A. This is because the vortex over the left fold in other images was even weaker, resulting in a weaker average. The average PIV shows consistent features, whereas features shown in only some of the instantaneous images tend to average out. In Fig 3A and Figs 4–8, the high-speed image of the vocal folds is shown above the velocity vector field. The phase-averaged EGG and microphone time traces are also shown, and the phase during the cycle at which each instantaneous PIV image was taken is marked on both the EGG and acoustic signals. The glottis opening starts at phase 0°. Complete closing (in which the flow velocity is 0) is never seen; there is always some gap between the folds, but that gap is very small, from 331° to 360°. The gap between the superior medial edges is marked by the bold line just above the X-axis, with LF referring to the left fold and RF to the right fold. The point x = 0 marks the midline between the left and right folds.
Fig 8.
Average PIV velocity, high-speed image, and EGG/microphone signal location for 306°. Flow is fairly straight at exit. There is vortex above left fold.
The solid black arrow in the phase-averaged fields shows the y location in which vorticity was measured for Fig 11. It is also important to note that this is not a confined flow, as all tissue above the vocal folds was removed.
Fig 11.
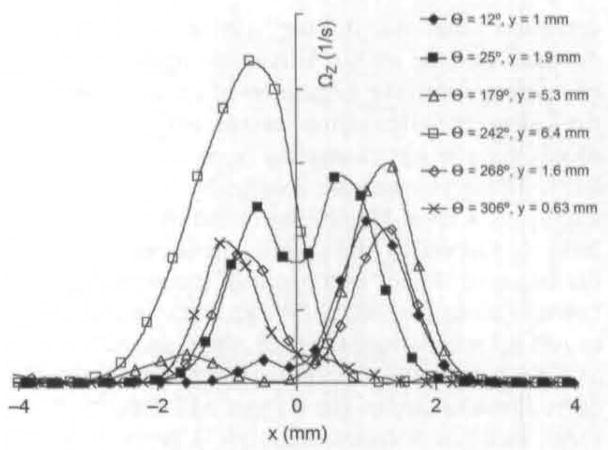
Swirling strength for animal 1 at different phases (12°, 25°, 179°, 242°, 268°, and 306°). Location in which swirling strength is obtained is marked by solid black arrow in Fig 3A and Figs 4–8.
Figure 3A shows the phase-averaged vector field at 12°, at the initiation of opening. A strong vortex is shown above the right fold. There is also weak rotational motion above the left fold. There is minimal rotational motion above the glottal gap. This is in the early opening phase. Figure 3B shows an instantaneous image for 12°. Figure 4 shows the velocity field at 25°. The rotational motion above the left fold has gotten stronger, and both vortices have traveled downstream.
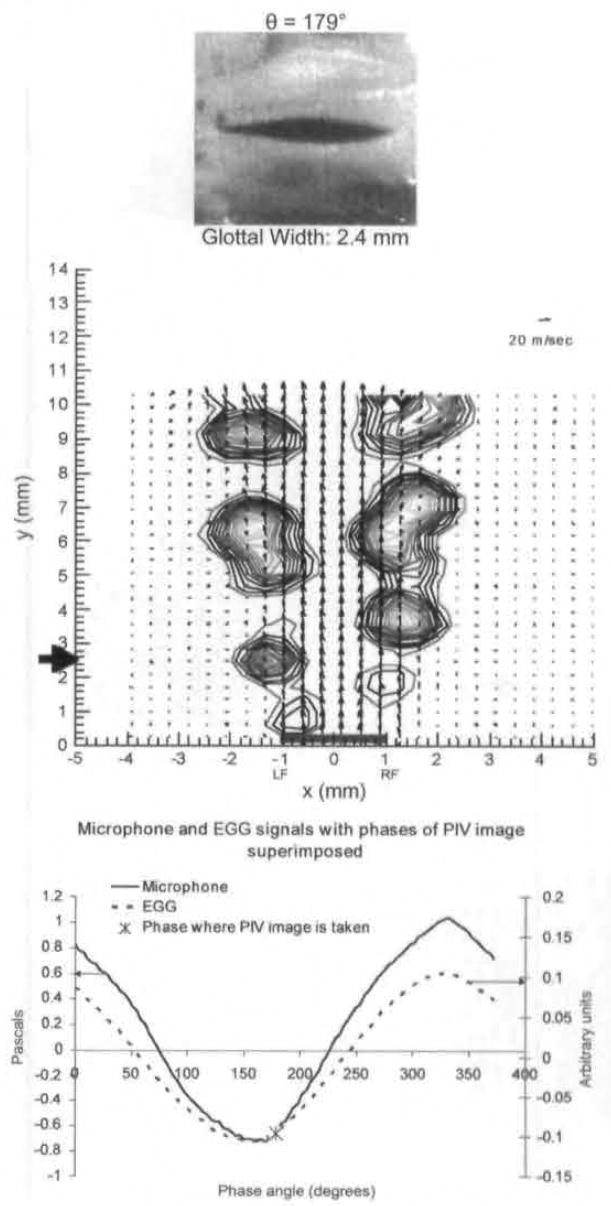
It is not shown, but by approximately 60° the vortices shown in Figs 3A and 4 have traveled downstream and are no longer in the field of view. From roughly 60° to shortly after maximal opening (phase angle of 179°), the jet is straight and parallel to the y-axis direction, with vortices along its 2 edges. Figure 5 shows the velocity field at 179° just after maximal opening. Rotational motion is seen along both edges of the jet. The core of the jet is straight, and the velocities are constant throughout the jet core flow. At the edges of the jet, the velocity magnitude drops off precipitously; the rotational motions observed in these regions result from the strong shear stresses that are produced by the large velocity gradients and are called Kelvin-Helmholtz vortices.
Fig 5.
Average PIV velocity, high-speed image, and EGG/microphone signal location for 179°, which is just after end of opening.
Figure 6 shows the averaged field during mid-closing. The right side of the jet near the glottis is slightly skewed to the right. At about 7 mm above the glottal exit, the flow skews toward the left side, indicating the development of a flapping motion of the jet. This causes a concave portion of the flow at the left edge from approximately 6 to 8 mm above the left fold. Flow outside the jet is entrained into the area of rotational motion, because the direction and strength of the rotational motion engulf air from outside the jet. We refer to this vortex as the entrainment vortex.
Fig 6.
Average PIV velocity, high-speed image, and EGG/microphone signal location for 242°. Strong vortex is seen along concave edge at left side of jet.
Figure 7 shows the velocity field 26° following the data shown in Fig 6. There is strong rotational motion over both folds at the glottal gap, with a stronger rotation at the right. There are vortices along the right edge of the fold as the jet maintains its flapping pattern. At approximately 6 mm, there is weak rotational motion along the left edge of the jet, which is associated with another extended area of entrainment-type rotational motion. Figure 8 shows the averaged field near the end of closing. There is a small area of rotational motion above the left fold, but otherwise there is minimal rotational motion. Although the velocities shown in Fig 8 are much lower than those shown in Fig 5, the jet has returned to the approximately straight shape seen at maximal opening.
Fig 7.
Average PIV velocity, high-speed image, and EGG/microphone signal location for 268°. Strong vortices are seen directly above both folds and glottal gap. Vortices are also seen along right edge of jet. There are also weak vortices at top left.
For the second animal, the length from the anterior commissure to the vocal process was 13 mm, so the laser sheet in the coronal plane was taken at 6.5 mm posterior to the anterior commissure. The fundamental frequency was 230 Hz, the flow rate was 250 cm3/s, and the average subglottal pressure was 6 cm H2O. For the third animal, the length from the anterior commissure to the vocal process was 10 mm. The fundamental frequency was 235 Hz, the flow rate was 185 cm3/s, and the average subglottal pressure was 5 cm H2O. The velocity fields for all 3 animals differed in magnitude, but the vortical structures had many similarities. The vortices at the beginning of opening shown in Figs 3A and 4 were also seen in the other 2 animals during early opening. The vortices along the edges of the jet seen during mid-opening to just after the end of opening (Fig 5) were also seen in the other 2 animals from the middle to just after the end of opening.
The features shown in Figs 6–8 were also seen in the other animals, but there were some differences in the shape of the flow field and the phase in which they occurred. Figure 9 shows the entrainment vortex seen in animals 2 and 3. For animal 2, the phase was at 240° (with the beginning of closing occurring around 185°). The jets of all 3 animals exhibited a strong flapping motion at this phase, with a certain variability in the location and numbers of the associated entrainment vortices. Three entrainment vortices are seen for animal 2. Two are associated with a concavity on the right as the jet at the glottal exit curves toward the left and the more superior portion curves to the right. There is also a strong entrainment vortex associated with the left edge of the jet at approximately 8 mm above the glottal exit. This is similar to the vortices seen on the right edge of the jet in animal 1, as shown in Fig 7. The degree of curving is much greater than the jet shown for animal 1. For animal 3, the velocity field is shown for a phase of 210°. The degree of curving is also greater than that in animal 1, and the entrainment vortex is closer to the glottal exit for animal 3 than for animal 1. However, the velocity field is similar to that shown in Fig 6.
Fig 9.
Entrainment vortices seen in averaged PIV fields for animals 2 and 3. Top is for animal 2 at phase of 240°, and bottom is for animal 3 at phase of 210°.
Figure 10 shows the velocity field for mid-closing for animals 2 and 3. For animal 2, the field is shown for a phase of 272°. A strong vortex is shown directly over the right fold, and a less-strong vortex is shown over the left fold. For the third animal, the field is shown at 290°. A strong vortex is shown directly over the left fold, and a much smaller one is shown over the right fold. A smaller strong vortex is shown at approximately 1.5 to 2 mm, at the right side of the tilted jet. This phase corresponds to the one shown in Fig 8 for animal 1. In all cases, at the mid-closing phase, the vortices that appear immediately over the glottis are a result of flow separation caused by the diverging folds.
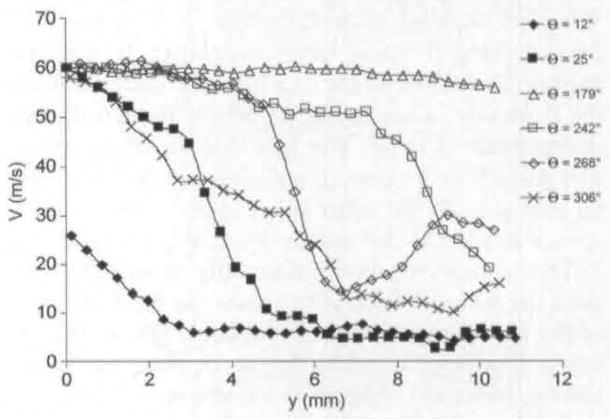
Because of the focus of this article, the results discussed so far have been more qualitative than quantitative, but this technique produces accurate quantitative data. For example. Fig 12 shows maximum jet velocity for animal 1 for different phases, as a function of distance from the glottal exit. These data are obtained from PIV phase-averaged plots. Because the jet skews during closing, the velocity is measured at the center of the jet. This differs from previous anemometry measurements that measure velocity at a fixed location throughout the cycle. From Fig 12, it can be seen that just after maximal opening the velocity is relatively constant at approximately 60 m/s. It can be seen that for phases early and late in the cycle, the velocity drops off rapidly after the first 2 to 6 mm above the glottal exit. In Fig 11, swirling strength is shown at different phases and different distances above the glottal exit.15 The swirling strength, calculated by a method described in the reference, quantifies the amount of rotational motion, with larger magnitudes of swirling strength corresponding to stronger areas of rotational motion. The horizontal axis, x, represents the mediallateral position, as it does on the PIV plots. For each phase, the distance above the glottal exit is chosen to give the highest vorticity; this location is shown by a solid black arrow in the phase-averaged plots (Fig 3A and Figs 4–8). The largest vortex is at 242° and represents the entrainment vortex.
Fig 12.
Centerline velocity (V) for animal 1 at different phases (12°, 25°, 179°, 242°, 268°, and 360°).
DISCUSSION
The 3 larynges had significantly different dimensions and different flow rates used to achieve stable phonation. In all 3 animals, we used the lowest flow rate to produce stable phonation and reliable EGG and microphone signals. Given these variations, variabliity in both the shape and magnitude of the velocity fields is expected. However, there are several important common features that were observed. In this report, we have focused on the similarities in the shape, location, and timing of the vortices, as these structures may be important for both vocal fold vibration and sound production. It is important to note that in each phonation trial, the size, phase, and location of the vortices are remarkably consistent, as is supported by our observation that the vortices we discuss below are seen in the instantaneous images and by the fact that the vortices do not disappear after phase averaging. However, turbulence has a coherent component and a random component. Most of the flow within the first centimeter has a large coherent component and a small random component. By phase averaging, we are showing the coherent components that occur during each cycle. Since we are showing the average velocity field, we also show the averaged microphone and EGG signals, because showing 1 of the instantaneous EGG and microphone signals would only correspond to 1 of the 10 phonation cycles. The EGG and microphone signals are very similar for all 10 phonation cycles, but averaging did make the signals appear more sinusoidal.
The first common observation is that vortices form on both sides of the jet during early opening. They are not necessarily symmetric in location, strength, and size, especially near the glottal exit. At a later phase, as the vortices travel downstream, they tend to be more symmetric. Both the greater asymmetry at the glottal exit and the lesser asymmetry downstream were seen in other phonation trials and in all 3 animals of the present tests. This observation is not fully substantiated, because we are capturing the velocity fields only at discrete phases, and not capturing the flow characteristics between phases. However, the formation of these vortices is consistently observed, and this phenomenon is consistent with impulsively started jets in mechanical systems; Cossali et al16 describe these structures as “starting vortices” and note that they will strongly entrain surrounding ambient fluid. This entrainment may explain the growth of the vortex over the left fold seen in Fig 3 and the eventual recovery of the vortex symmetry.
The shape of the jet and the nature of the vortices can be partially understood by relating these findings to the shape of the vocal folds. Because of the nature of the vertical medial mucosal wave, the folds are convergent during opening and divergent during closing. When a jet emanates from a convergent, symmetric orifice, it tends to be stable and straight. This helps explain the second common observation: after the starting vortices have traveled downstream, the jet is relatively straight for the rest of opening, until the beginning of closing. The vortices along the edge of the jet seen in Fig 4 are commonly seen in jets emanating from mechanical systems. These vortices are formed by a phenomenon known as Kelvin-Helmholtz instability. This instability is caused by the significant shear stresses at the edges of the jet as a result of the rapid velocity changes along the sides of the jet that cause the flow t o roll up into vortices. These, then, are referred to as Kelvin-Heimholtz vortices. Only at a certain distance downstream of the jet exit will these vortices form, and this distance is inversely proportional to the velocity of the jet.17 In Fig 5, the strong vortices start to form 2 mm above the glottal exit. There is some rotational motion closer to the exit, but it is weak. In Fig 5, the jet velocity is at its maximum value for the phonation cycle (approximately 60 m/s). Therefore, any strong vortices seen less than 2 mm above the exit are most likely not caused by the Kelvin-Helmholtz instability. This assumption becomes even more valid when the jet velocity is less than its maximum, such as during the early opening or middle to late closing. Thus, the mechanism for the strong starting vortex seen in Fig 3A is not the Kelvin-Helmhoitz instability. Rather, the suggested mechanism is due to the sudden buildup of momentum near the glottal exit as the jet starts to form and has large acceleration.
The fact that the folds are divergent during closing helps explain the formation of the flow structures during closing. In experimental fluid mechanics, it is well known that flow can be unstable in a diverging duct because of the adverse pressure gradient, and that small irregularities can cause the jet to skew toward one side or the other. An adverse pressure gradient describes areas of increasing pressure; this occurs when flow travels from a smaller area to a larger area, such as a diverging duct. When jet skewing occurs, the flow outside the duct may develop flapping mode instability. In the first animal, flow close to the exit initially veered toward the right side, whereas the jet bent to the left further downstream (Fig 6). The fact that the more proximal part of the jet goes to one side and the more distal part goes to the other side causes a concavity. A vortex is seen at this concavity in Fig 6 and in Fig 7. This vortex entrains significantly more fluid than does the Kelvin-Helmholtz vortex, so the formation of the entrainment vortex is probably due to the rotational motion caused by the jet flapping and the resulting concavity. Strong entrainment is associated with a very strong vortex.
In Fig 7, the majority of the flow is now skewing toward the right. The vortices seen along the right side of the jet in this Figure and the vortex seen along the left edge of the jet for animal 2 in Fig 9 may be due to the Kelvin-Helmholtz instability or to a curvature in the flow. Near the end of closing, the majority of the flow returned to midline (Fig 8), and the vorticity and velocities were significantly reduced. During each phonation trial, there was no change in the side of concavity or the side to which the majority of the flow skewed. However, these sides would change between different phonation trials. Typically, when there is an unstable jet in a diffuser, small changes will result in skewing toward one side. Small changes between the phonation trials would result in changing the side to which the jet skews. This idea suggests that the skewing behavior and the subsequent entrainment vortices are due to an unstable jet in a divergent glottis, rather than to glottal shape asymmetries.
The unstable nature of a jet in a diverging duct may also affect the nature of flow separation in the duct. Thus, if flow separation does occur in the duct, it may occur on only one side or alternately on both sides. As is true for the side of skewing, the side of separation did sometimes change between phonation trials, but never during a phonation trial. Strong vortices are seen directly above the glottal exit during mid-closing in Fig 7 and over the left fold in Fig 8. In Fig 10, 2 vortices are seen at the glottal exit for animal 2 (top picture), the right being much larger and more formed than the one on the left. The vector fields for animal 3 in Fig 10 (bottom picture) show 2 asymmetric vortices at the glottal exit, with the stronger one on the left. Therefore, for all 3 animals, during the middle to late closing phase, there were 2 types of vortices above the fold. The first appears to be completely formed above the glottal exit; this corresponds to the vortices over the left side in Figs 7 and 8, and the right side for both animals in Fig 10. The second type of vortices are those that appear to have rotational motion in the glottis, because the vortex above the glottis is only partially formed; this corresponds to the vortex on the right in Fig 7 and the vortices on the left for both animals in Fig 10. We think that the second type is formed in the glottis by flow separation for 2 reasons. First, the lines of these vortices suggest that part of the rotational motion is inside the glottis. Second, similar to the discussion on the formation mechanism of the starting vortex, these vortices are too close to the exit and too strong to be caused by the Kelvin-Helmholtz instability. This does not prove flow separation in the glottis, as we did not measure flow in this location; however, the flow fields at the glottal exit seen for all 3 animals in middle to late closing strongly suggest flow separation. Our findings are also consistent with findings in other models; as mentioned in the Introduction, asymmetric flow separation has been demonstrated in both computational and mechanical models. The presence of flow separation may have clinical significance. These vortices can be associated with negative pressure; because the flow is subsonic, this pressure would be instantaneously propagated upstream. This negative pressure could be a factor in the production of rapid closing velocity seen near the end of closing. The rapid closing is associated with the generation of higher-frequency harmonics and improved speech recognition in listeners.18 On the basis of an elegant theoretical analysis. Lucero7 also predicts that flow separation causes a decrease in phonation threshold pressure, enabling production of phonation with less effort.
The importance of flow separation depends on the magnitude of negative pressure generated. An approximation of the magnitude of this negative pressure can be calculated from the velocities obtained at the phase of 268° (Fig 7) by means of the steady-state Bernoulli’s law.19 According to this calculation, the pressure between the superior edges of the vocal folds is −11 cm H2O. Because the average driving (subglottal) pressure is +7 cm H2O, this negative pressure causes a very strong closing force. There is no calculated negative pressure between the folds for the velocity field in Fig 8. It is also interesting to note that this negative pressure is consistent with the rapid reduction in glottal width seen from 242° to 306°. The rapid flow shutoff has other mechanisms; however, flow separation may play an important role. The negative pressures for animals 2 and 3 are 6 cm H2O and 5.9 cm H2O, but the flow rates are also decreased. Because the negative pressure is very transient, it is also possible that for animals 2 and 3, we did not sample a phase with a higher value of negative pressure.
Given the impact that flow separation may have on voice quality during normal phonation, the lack of a vortex produced by flow separation may also have some impact on voice disorders. In fluid mechanics, flow separation can produce drag, as is the case of flow past a smooth sphere. However, the random component of turbulence is well known to delay flow separation and therefore to reduce drag on a moving sphere when the surface is roughened,19 which is the main reason for dimples on golf balls. As postulated above, flow separation may be beneficial in voice production. In the larynx, turbulence may be caused by any mucosal irregularities, such as those seen in laryngopharyngeal reflux and in viral laryngitis. Turbulent airflow could also be generated upstream of the glottis because of conditions such as tracheal or subglottic stenosis. The irregular or raspy voice seen in these conditions may be due to such turbulence, which reduces or eliminates flow separation in the glottis. In addition, voice irregularities may result from any disease or operation that prevents the glottis from diverging during closing.
The fully formed vortices directly above the folds are probably not due to flow separation. Since both the vortices and the flow above the exit are asymmetric, flow separation will be asymmetric if it occurs. This means that vortices in the glottis will be formed on only one side. Therefore, the fully formed vortices on the non-separated side must have a different cause of formation. This is because asymmetric flow separation usually cannot produce vortices in a diverging duct on both sides. Entrainment, induced by the right vortex for animal 1, is the most likely mechanism of the fully formed vortices; this entrainment at the exit of a jet is commonly seen in mechanical jets when there is asymmetric flow separation.
The vortices described in this report may also have acoustic significance. This significance will be changed with the addition of the vocal tract, since the tract may alter the vortices, especially those downstream, and the interaction between the vortices and the vocal tract will produce an additional source of sound.
The acoustic significance of these vortices in the canine model is not known. Future work is planned to measure the velocity fields with a vocal tract and to determine the acoustic significance of different flow structures, including vortices. We are also looking at flow in the anterior-posterior direction, since vortices are highly 3-dimensional and additional vortical structures in the axial and sagittal planes may also be acoustic sources.
The PIV method we presented resulted in reliable quantitative velocity fields during phonation. This method demonstrated vortices that would he difficult to characterize by hot-wire anemometry. This method also allowed us to look at the entire velocity field in the region covering merely 10 mm above the glottal exit at any particular phase; this information has not previously been reported in the literature. This method, however, can only measure velocity fields at discrete points in time. As is true for stroboscopy, this method requires fairly regular phonation cycles. There is also limited time in a phonation trial to obtain information about a larger number of phases. A possible alternative is to use a high-speed PIV system presently available.
However, the cameras currently used in high-speed PIV have a significantly lower resolution than those used in a low-speed PIV system. Since large velocity gradients arise in the shear layer, sufficient pixels need to be present to resolve them. Also, in the current system, we use an elliptic interrogation window that enables the correlation algorithm to obtain the high-fidelity flow vectors in large gradient regions. The high-speed lasers have significantly lower power per pulse than the lasers used in a low-speed system. This provides a higher signal-to-noise ratio that helps in precisely identifying the seed particles in the flow. The sensitivity of the high-speed camera has 30% quantum efficiency at 527 nm, whereas the low-speed system has a 65% quantum efficiency at 532 nm; this difference further reduces the signal-to-noise ratio in high-speed cameras. Therefore, the high-speed system would not allow us to resolve the vortices as accurately as the current system, especially when the velocities are high. Less resolution is better for qualitative visualization, so high-speed visualization coupled with hot-wire anemometry may be an option for obtaining a larger number of phases or to use if the vibrations are irregular.
In summary, 4 different types of vortices are seen during a single cycle of phonation. During early opening, starting vortices are observed, consistent with the impulsively starting jets described in the classical fluid mechanics literature. During mid-opening and late opening. Keivin-Helmholtz vortices appear because of shear flow instability. During early closing, jet flapping and associated entrainment vortices are detected. During mid-closing, strong vortices are seen above the glottal exit, which are probably associated with asymmetric flow separation in the superior diverging section of the glottis. Although only 3 dogs were used, the timing and location of the vortices were very similar for all 3 animals. This outcome is especially interesting, given the variety of laryngeal sizes. Further study of these flow patterns in more realistic biological models will result in a better understanding of vocal fold vibration and sound production.
Acknowledgments
The authors thank the following people for their advice and assistance on this project: Fariborz Alipour, PhD, Gerald Berke, MD, Randal Paniello, MD, and Marshall Smith, MD.
This work was funded by National Institutes of Health grants K08DCC005421 and R01DC003577. This study was performed in accordance with the PHS Policy on Humane Care and Use of Laboratory Animals, the NIH Guide for the Care and Use of Laboratory Animals, and the Animal Welfare Act (7 U.S.C. et seq.); the animal use protocol was approved by the Institutional Animal Care and Use Committee (IACUC) of the University of Cincinnati.
Footnotes
Presented at the meeting of the American Laryngological Association. Chicago. Illinois. May 19–20, 2006.
References
- 1.Alipour F, Titze IR. Combined simulation of two-dimensional airflow and vocal told vibration. In: Davis PJ, Fletcher NH, editors. Vocal fold physiology: controlling complexity and chaos. San Diego, Calif: Singular; 1996. pp. 17–30. [Google Scholar]
- 2.Zhang C, Zhao W, Frankel SH, Mongeau L. Computational aeroacoustics of phonation, part II: Effects of flow parameters and ventricular folds. J Acoust Soc Am. 2002;112:2147–54. doi: 10.1121/1.1506694. [DOI] [PubMed] [Google Scholar]
- 3.McGowan RS. An aeroacoustic approach to phonation. J Acoust Soc Am. 1988;83:696–704. doi: 10.1121/1.396165. [DOI] [PubMed] [Google Scholar]
- 4.Pelorson X, Hirschberg A, Van Hassel RR, Wijnands APJ. Theoretical and experimental study of quasisteady-flow separation within the glottis during phonation. Application to a modified two-mass model. J Acoust Soc Am. 1994;96:3416–31. [Google Scholar]
- 5.Zhao W, Zhang C, Frankel SH, Mongeau L. Computational aeroacoustics of phonation, part I: Computational methods and sound generation mechanisms. J Acoust Soc Am. 2002;112:2134–46. doi: 10.1121/1.1506693. [DOI] [PubMed] [Google Scholar]
- 6.Shinwari D, Scherer RC, DeWitt K, Afjeh AA. Flow visualization and pressure distributions in a model of the glottis with a symmetric and oblique divergent angle of 10 degrees. J Acoust Soc Am. 2003;113:487–97. doi: 10.1121/1.1526468. [DOI] [PubMed] [Google Scholar]
- 7.Lucero JC. A theoretical study of the hysteresis phenomenon at vocal fold oscillation onset-offset. J Acoust Soc Am. 1999;105:423–31. doi: 10.1121/1.424572. [DOI] [PubMed] [Google Scholar]
- 8.Liljencrants J. Numerical simulations of glottic flow. In: Gauffin J, Hammarberg B, editors. Vocal fold physiology: acoustic, perceptual and physiological aspects of voice mechanics. San Diego, Calif: Singular; 1991. pp. 99–104. [Google Scholar]
- 9.Shadle CH, Barney AM, Thomas DW. An investigation into the acoustics and aerodynamics of the larynx. In: Gauffin J, Hammarberg B, editors. Vocal fold physiology. San Diego, Calif: Singular; 1991. pp. 73–82. [Google Scholar]
- 10.Barney AM, Shadle CH, Davies POAL. Fluid flow in dynamic mechanical model of vocal folds and tract. I. Measurements and theory. J Acoust Soc Am. 1999;105:444–55. [Google Scholar]
- 11.Berke GS, Moore DM, Monkewitz PA, Hanson DG, Geratt BR. A preliminary study of particle velocity during phonation in an in vivo canine model. J Voice. 1989;3:306–13. [Google Scholar]
- 12.Bielamowicz S, Berke GS, Kreiman J, Genatt BR. Exit jet particle velocity in the in vivo canine laryngeal model with variable nerve stimulation. J Voice. 1999;13:153–60. doi: 10.1016/s0892-1997(99)80019-8. [DOI] [PubMed] [Google Scholar]
- 13.Alipour F, Scherer RC. Pulsatile airflow during phonation: an excised larynx model. J Acoust Soc Am. 1995;97:1241–8. doi: 10.1121/1.412233. [DOI] [PubMed] [Google Scholar]
- 14.Mueller TJ. Flow visualization by direct injection. In: Goldstein RJ, editor. Fluid mechanics measurements. Washington, DC: Taylor & Francis; 1996. pp. 367–450. [Google Scholar]
- 15.Christensen KT, Adrian RJ. The velocity and acceleration signatures of small-scale vortices in turbulent channel flow. J Turbulence. 2002;3:1–28. [Google Scholar]
- 16.Cossali GE, Coghe A, Araneo L. Near-field entrainment in an impulsively started turbulent gas jet. Am Inst Aeronaut Astronaut J. 2001;39:1113–22. [Google Scholar]
- 17.Gutmark E, Ho CM. On the preferred modes and spreading rates of jets. Phys Fluids. 1983;26:2932–8. [Google Scholar]
- 18.Stevens KN. Acoustic phonetics. Cambridge, Mass: MIT Press; 1998. pp. 75–126. [Google Scholar]
- 19.Cengel YA, Cimbala JM. Fluid mechanics. New York, NY: McGraw Hill; 2006. pp. 185–201.pp. 584–5. [Google Scholar]


