

Abstract
Background
This study was conducted to corroborate prior evidence of an effect of the BDNF Val66Met polymorphism on measures of N-acetyl aspartate containing compounds (NAA) in healthy subjects.
Methods
The NAA to creatine (Cre) ratio (NAA/Cre), NAA to choline (Cho) ratio (NAA/Cho), and Cho to Cre ratio (Cho/Cre) were measured in the left and right hippocampi, left and right dorsolateral prefrontal cortices, occipital lobe, anterior cingulate and white matter of the centrum semiovale of 69 carefully screened healthy volunteers utilizing proton magnetic resonance spectroscopic imaging (MRSI) at 3T.
Results
Val/Met subjects exhibited significantly reduced levels of left hippocampal NAA/Cre and NAA/Cho compared to Val/Val subjects. This effect was independent of age, IQ, number of voxels, hippocampal volume or gray matter content in the voxels of interest. Analysis of other brain regions showed no effect of BDNF genotype on NAA measures.
Conclusions
We confirmed the association between the Met-BDNF variant and reduced levels of hippocampal NAA found with a similar technique at 1.5T. The consonance of our results with prior findings adds to the evidence that the BDNF Val/Met genotype affects hippocampal biology with implications for a variety of neuropsychiatric disorders.
Introduction
Brain-derived neurotrophic factor (BDNF) has been implicated in hippocampal plasticity and hippocampal-dependent memory in both human and nonhuman species in numerous studies (1-5). The most abundant of the neurotrophins in the brain, BDNF has been hypothesized to play a role in the pathophysiology of substance-related disorders (6), eating disorders (7), schizophrenia (8) and affective disorders (9-11), though some of these associations remain controversial (12-15). Several observations support BDNF as a candidate gene for various mental illnesses. For example, BDNF gives trophic support to cholinergic, dopaminergic, and 5-hydroxytryptamine containing neurons whose neurotransmitter systems are thought to be dysfunctional in numerous psychiatric disorders (16). Moreover, BDNF is widely distributed in the central nervous system, prevalent in key regions that regulate mood and behavior such as the hippocampus, amygdala, cerebellum, hypothalamus and neocortex (17).
A frequent single nucleotide polymorphism in the 5’ pro-region of the human BDNF gene results in a valine to methionine amino acid substitution at codon66 (Val66Met: rs6265). Although the substitution does not affect BDNF protein function per se, it impacts the regulated secretion of the mature peptide by dramatically altering intracellular trafficking and packaging of pro-BDNF, the precursor peptide (2,18). Egan et al. (2) previously found the Met allele to be associated with deficits in episodic memory, abnormal hippocampal activation assayed with functional magnetic resonance imaging (fMRI) and diminished levels of hippocampal N-acetyl aspartate (NAA), a putative marker of neuronal integrity and synaptic abundance (2). The work of our group has been supported by several other studies reporting an association between BDNF genotype and episodic memory (1,3,4,19), hippocampal activation during fMRI (3) and hippocampal volume (20-23). Concentrations of NAA containing compounds (N-acetyl-aspartate and N-acetyl-aspartyl-glutamate, referred to for simplicity as NAA) positively correlate with measures of cognitive function in normal subjects (24-26) and reduced levels of NAA have been found in patients with various mental illnesses including bipolar disorder (27,28), post-traumatic stress disorder (29), anorexia nervosa (30), social phobia (31) and schizophrenia (32-34).
The present study aimed to directly assay the impact of the BDNF Val/Met polymorphism on in vivo measures of NAA using MRSI in a new cohort of healthy subjects studied on a 3T scanner, offering improved signal-to-noise and spatial resolution as compared to widely used 1.5T systems. In consideration of the findings documented earlier by our group at 1.5T (2), we hypothesized that Met allele carriers would exhibit reduced levels of hippocampal NAA compared to non-Met allele carriers.
Methods and Materials
We studied 87 Caucasian American healthy volunteers recruited as part of the National Institute of Mental Health Genetic Study of Schizophrenia (NCT00001486: the Clinical Brain Disorders Branch “Sibling Study”), a study of neurobiological abnormalities related to genetic risk (35). Demographic information is presented in Table 1. Participants underwent a neuropsychological evaluation and structured clinical diagnostic interview (SCID) by a psychiatrist or PhD psychologist with decades of clinical experience. The SCID included a questionnaire derived from the SCID for Axis II disorders and particular attention was devoted to ruling out cluster A personality disorders. Those with any current medical illness, past or current psychiatric or neurological diagnosis, or history of psychosis in first degree relatives were excluded. Written informed consent was obtained from all participants. As outlined by Egan et al. (2), subjects were genotyped at rs6265 of the 5’ pro-region of the BDNF gene using the Taqman 5’-exonuclease assay. MRSI was performed on a 3T GE NMR imaging system as described in earlier reports (36,37). The 1H-MRSI pulse sequence acquired four spectroscopic slices positioned parallel to the main axis of the hippocampi with a spin-echo slice selection, water suppression, and octagonal outer volume suppression to suppress lipid signal from the skull and scalp (TR = 2300 msec, TE = 280 msec). Each volume element (“voxel”) had nominal dimensions of 7.5 × 7.5 × 7.5 mm. Regions of interest (ROIs), including the left and right hippocampi, left and right dorsolateral prefrontal cortices, occipital lobe, anterior cingulate and white matter of the centrum semiovale were drawn on 1.5 mm-thick T1-weighted structural MRI images acquired during the same session as the MRSI using a three-dimensional spoiled gradient recalled (SPGR) pulse sequence (TR = 24 ms, TE = 3.2 ms, flip angle = 17 degrees, in-plane resolution = 0.9 mm2).
Table 1.
Demographic and Brain Volume Data of Study Subjects
| Variable | Val/Val Group | Val/Met Group | Statistic | P |
|---|---|---|---|---|
| All Subjects | ||||
| N | 50 | 19 | ||
| Gender | 22 F, 28 M | 9 F, 10 M | χ2(1)=0.06 | p=0.80 |
| Age (±SD) | 31.1(±10.4) | 33.9(±10.6) | t(67)=-1.00 | p=0.32 |
| IQ (±SD) | 107(±9.2) | t(67)=-1.00 | t(67)=-0.28 | p=0.78 |
| #Ever Smoked | 11 Y, 39 N | 3 Y, 15N | χ2(1)=0.23 | p=0.63ˆ |
| #Vox Occ Cortex | 14.9(±4.8) | 15.7(±4.0) | t(58)=-0.61 | p=0.55 |
| #Vox Left DLPFC | 15.6(±4.7) | 14.8(±4.5) | t(58)=0.60 | p=0.55 |
| #Vox Right DLPFC | 16.1(±3.4) | 14.8(±3.2) | t(59)=1.32 | p=0.19 |
| #Vox Acc | 19.3(±6.2) | 19.7(±5.8) | t(58)=-0.22 | p=0.83 |
| #Vox White Matter | 18.9(±7.2) | 19.6(±6.5) | t(57)=-0.32 | p=0.75 |
| Subjects with Left Hippocampal Data | ||||
| N | 38 | 12 | ||
| Gender | 11 F, 27 M | 6 F, 6 M | χ2(1)=0.14 | p=0.71 |
| Age (±SD) | 29.8(±9.82) | 32.8(±10.1) | t(48)=-0.94 | p=0.35 |
| IQ (±SD) | 106(±9.08) | 112(±7.19) | t(48)=-2.37 | p=0.02† |
| #Ever Smoked | 8 Y, 30 N | 1 Y, 10 N | χ2(1)=0.81 | p=0.37ˆ |
| #Vox Left Hippo | 7.68(±2.49) | 6.67(±1.87) | t(48)=1.30 | p=0.20 |
| Left Hippo % GM in MRSI Voxels | 0.634(±0.07) | 0.624(±0.09) | t(48)=0.40 | p=0.69 |
| Left Hippo Volume (Unscaled in mm3) | 4194(±457) | 4374(±436) | t(48)=-1.20 | p=0.24 |
| Left Hippo Volume (Scaled)* | 0.374(±0.03) | 0.370(±0.03) | t(48)=0.40 | p=0.70 |
| Subjects with Right Hippocampal Data | ||||
| N | 39 | 12 | ||
| Gender | 15 F, 24 M | 5 F, 7 M | χ2(1)=0.04 | p=0.84 |
| Age (±SD) | 30.7(±10.3) | 34.8(±10.8) | t(49)=-1.20 | p=0.23 |
| IQ (±SD) | 106(±9.92) | 113(±7.37) | t(49)=-2.12 | p=0.04† |
| #Ever Smoked | 6 Y, 33 N | 2 Y, 9 N | χ2(1)=0.05 | p=0.82ˆ |
| #Vox Right Hippo | 6.77(±3.12) | 6.36(±2.29) | t(49)=0.40 | p=0.69 |
| Right Hippo % GM in MRSI Voxels | 0.635(±0.06) | 0.636(±0.05) | t(49)=-0.03 | p=0.98 |
| Right Hippo Volume (Unscaled in mm3) | 4352(±471) | 4473(±474) | t(48)=-0.78 | p=0.44 |
| Right Hippo Volume (Scaled)* | 0.386(±0.02) | 0.385(±0.03) | t(49)=0.09 | p=0.92 |
Abbreviations: Occ, occipital; DLPFC, dorsolateral prefrontal cortex; Acc, anterior cingulate cortex; Hippo, hippocampus
Data are presented as mean±SD unless otherwise indicated
Values are expressed as χ2 statistics for categorical measures and t statistics for continuous measures.
IQ used as a covariate in ANOVA for comparison of metabolite ratios by genotype group
Scaled volume is expressed as a ratio of absolute hippocampal volume to total brain volume minus the cerebellum.
Results include only those subjects with available smoking history data
Metabolite values were calculated as the integral of the area under the peaks for NAA, Creatine (Cre) and Choline (Cho) and were reported as NAA/Cre, NAA/Cho and Cho/Cre ratios, as outlined in earlier reports (34). We eliminated voxels that were judged to be of poor quality, especially in the hippocampal regions, usually due to effects of susceptibility (see Supplementary Methods). Since susceptibility artifacts are a disadvantage of working at higher fields, single voxel techniques have demonstrated a precision of ~ 13% at 4T for NAA in the hippocampus (38). In addition, an insufficient number of voxels in a ROI, defined as less than 3 in the hippocampi and less than 5 in all other ROIs, resulted in the discarding of a subject’s data for that particular ROI in statistical analyses. This procedure was performed blind to genotype status and served as a strict quality control mechanism. It resulted in the rejection of 12 scans because of poor quality spectra in all ROIs. Moreover, we omitted three outlier subjects, defined by any metabolite ratio greater/lesser than three standard deviations above/below the mean for the entire group, from analysis of all metabolite ratios within the particular ROI. Three subjects with Met/Met genotype were excluded to avoid large variability associated with such a small sample size, resulting in a final sample of 69 carefully screened subjects with usable data in the top MRSI slice (Val/Val: n=50 and Val/Met: n=19). The individuals with at least 3 usable voxels in either hippocampal ROI were a further subset of these: 38 and 39 of the 50 Val/Val subjects had quality left and right hippocampal data, respectively, whereas 12 of the 19 Val/Met subjects had quality left and right hippocampal data.
Given that several studies have found an association between the Val66Met polymorphism and hippocampal volume (20-23), we attempted to control for the amount of gray matter contributing to the particular voxels that were examined and for hippocampal volume as a whole. For those subjects with available hippocampal data as defined by MRSI, we calculated the average percent gray matter (GM), white matter (WM), and cerebrospinal fluid (CSF) over total tissue in these voxels. In order to do this, T1-weighted MRI scans acquired for MRSI localization and judged visually to be in spatial alignment with the spectroscopic slices were segmented into GM, WM and CSF using FLIRT (39), an application in the FSL software suite (http://www.fmrib.ox.ac.uk/fsl/). A program developed by one of the authors (ASB) was used to simulate the effects of the MRSI point spread function on the various compartments, providing a measure of the relative contribution of GM, WM and CSF to the voxels entering the analysis. In addition, volumes of the entire left and right hippocampal formation were calculated from the T1-weighted structural MRI scans acquired during the same session as the MRSI using Freesurfer (version 3.0.2) as previously described (40,41). Freesurfer automatically classified the brain into a series of structures based on a template, individual intensity properties and relative known positions of structures and allowed for the determination of the total volume of each structure and of total brain GM. It has been shown that this method yields regional volumes with accuracy comparable to manual ROI tracing (40). Both absolute and relative (scaled to the whole forebrain GM) volumes were obtained for the hippocampus bilaterally.
Differences in metabolite ratios between Val/Val and Val/Met genotype groups were analyzed separately for each ROI using analysis of variance (ANOVA). Independent t-tests were used to assess differences between genotype groups in absolute and relative hippocampal volumes, average percent GM, WM and CSF of the voxels examined in the hippocampus, number of voxels in each ROI, and demographic variables including age, gender, and IQ (assessed by the Wechsler Adult Intelligence Scale), as seen in Table 1. We also tested whether these variables had an effect on metabolite ratios using regression models. When either of these conditions was met, the variable was included as a covariate in the ANCOVA model. Smoking was considered as potential covariate due to its reported association with BDNF genotype (42,43) and its effects on NAA (44). Given the lack of differential distribution of smoking across genotype groups (see Table 1) and the lack of an association with metabolite ratios (data not shown), smoking was not considered in our models. Alcohol consumption was not investigated since our participants were free of history of alcohol abuse or dependence, only 8 individuals drank 1-3 drinks/day and data on current alcohol consumption was missing for approximately 20% of participants. One-tailed statistics were used for the hippocampal regions, given the prior hypothesis generated by the 1.5T studies, while two-tailed statistics were used for all other ROIs. The significance level of analyses was set at p<0.05. No correction for multiple comparisons was performed as we were testing a specific hypothesis based on prior results. Post-hoc regression models were used to assess the amount of variance accounted for by the variables used in the model.
Results
Consistent with the earlier report by Egan et al. (2), we found that normal subjects who are Val/Met heterozygotes exhibited significantly reduced levels of left hippocampal NAA/Cre and NAA/Cho compared to Val homozygotes, as shown in Figure 1. The effect of genotype on left hippocampal NAA/Cre and NAA/Cho was significant after adjustments for the effect of age on these ratios and for significant differences in IQ between genotypes (see Table 2 for results of the full ANCOVA model). Post-hoc analyses revealed that BDNF genotype accounted for 9% and 13% of the variance in left hippocampal NAA/Cre and NAA/Cho, respectively. Two way interactions of BDNF with age and IQ accounted for less than 1-3% of the variance and were dropped from the model (see Supplementary Table 1). Three way interactions between BDNF, age and IQ could not be tested due to the sample size. Analysis of other brain regions showed no effect of BDNF genotype on NAA measures (see Table 2). In addition, there was no effect of BDNF genotype on bilateral absolute and relative volumes of the hippocampal formation or average percent GM of hippocampal voxels entering the MRSI analysis (see Table 1).
Figure 1.
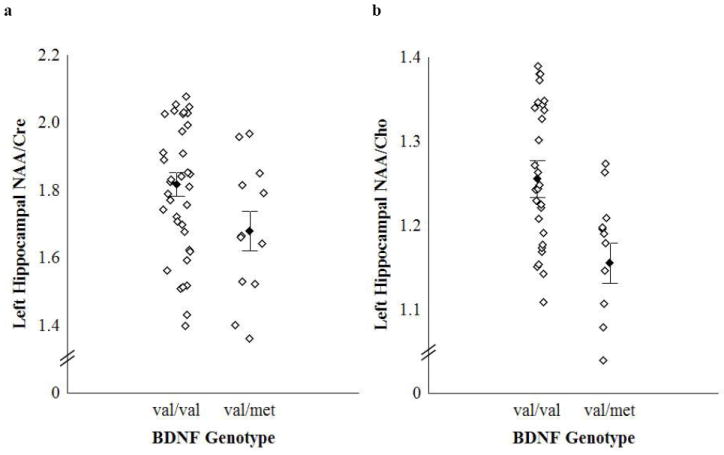
a. Effect of BDNF val66met genotype on in vivo left hippocampal NAA/Cre. *F(1,46) = 5.01, p = 0.03. Effect size (Cohen’s d) = 0.68 (medium-large). Vertical bars denote mean ± standard error.
b. Effect of BDNF val66met genotype on in vivo left hippocampal NAA/Cho. *F(1,46) = 7.40, p = 0.009. Effect size (Cohen’s d) = 0.85 (large). Vertical bars denote mean ± standard error.
Table 2.
Comparison of Metabolite Ratios by Genotype in all ROIs
| Region | Val/Val | Val/Met | Statistic | P |
|---|---|---|---|---|
| Left Hippocampus | n=38 | n=12 | ||
| NAA/Cre | 1.82(±0.21) | 1.68(±0.20) | F(1,46)=5.01 | p=0.03† |
| Effect of Age | 28.9(±9.17) | 34.3(±11.5) | F(1,46)=7.71 | p=0.007 |
| Effect of IQ | 107(±9.9) | 113(±7.1) | F(1,46)= 1.40 | p=0.24 |
| NAA/Cho | 1.25(±0.14) | 1.15(±0.09) | F(1,46)=7.40 | p=0.009† |
| Effect of Age | 28.9(±9.17) | 34.3(±11.5) | F(1,46)=4.64 | p=0.04 |
| Effect of IQ | 107(±9.9) | 113(±7.1) | F(1,46)=0.02 | p=0.89 |
| Cho/Cre | 1.46(±0.16) | 1.46(±0.19) | F(1,47)=0.002 | p=0.78ˆ |
| Right Hippocampus | n=39 | n=12 | ||
| NAA/Cre | 1.80(±0.22) | 1.80(±0.23) | F(1,48)=0.17 | p=0.69ˆ |
| NAA/Cho | 1.28(±0.18) | 1.24(±0.15) | F(1,48)=1.40 | p=0.24ˆ |
| Cho/Cre | 1.41(±0.16) | 1.46(±0.15) | F(1,48)=2.72 | p=0.11ˆ |
| Occipital Cortex | n=44 | n=15 | ||
| NAA/Cre | 2.19(±0.19) | 2.17(±0.16) | F(57)=0.13 | p=0.72 |
| NAA/Cho | 2.21(±0.29) | 2.26(±0.26) | F(57)=0.36 | p=0.55 |
| Cho/Cre | 1.00(±0.12) | 0.97(±0.14) | F(57)=0.64 | p=0.43 |
| Left dlPFC | n=45 | n=15 | ||
| NAA/Cre | 2.22(±0.20) | 2.11(±0.22) | F(1,57)=1.53 | p=0.22* |
| NAA/Cho | 2.12(±0.20) | 2.07(±0.24) | F(1,57)=0.001 | p=0.97* |
| Cho/Cre | 1.05(±0.11) | 1.03(±0.11) | F(58)=0.70 | p=0.41 |
| Right dlPFC | n=45 | n=16 | ||
| NAA/Cre | 2.23(±0.18) | 2.24(±0.20) | F(58)=0.86 | p=0.36* |
| NAA/Cho | 2.14(±0.22) | 2.11(±0.23) | F(58)=0.21 | p=0.65* |
| Cho/Cre | 1.05(±0.09) | 1.07(±0.14) | F(59)=0.57 | p=0.45 |
| Anterior Cingulate | n=44 | n=15 | ||
| NAA/Cre | 2.02(±0.15) | 1.97(±0.13) | F(1,56)=1.16 | p=0.69* |
| NAA/Cho | 1.49(±0.20) | 1.45(±0.17) | F(1,56)=0.01 | p=0.92* |
| Cho/Cre | 1.37(±0.14) | 1.38(±0.18) | F(57)=0.55 | p=0.46 |
| White Matter | n=45 | n=14 | ||
| NAA/Cre | 2.57(±0.22) | 2.46(±0.20) | F(1,56)=1.43 | p=0.24* |
| NAA/Cho | 1.98(±0.24) | 1.92(±0.17) | F(1,56)=0.51 | p=0.48* |
| Cho/Cre | 1.31(±0.14) | 1.29(±0.11) | F(57)=0.42 | p=0.52 |
Abreviations: dlPFC, dorsolateral prefrontal cortex
Data are presented as mean±SD in parentheses
Age and IQ used as covariates in the ANCOVA
IQ used as a covariate in the ANCOVA
Age used as a covariate in the ANCOVA
Discussion
We report an association between the functional BDNF Val66Met polymorphism and reduced hippocampal NAA. Specifically, BDNF Met allele carriers have reduced left hippocampal NAA/Cre and NAA/Cho, consistent with findings documented earlier by our group at 1.5T (2). The results of the present study have several important implications. First, it is remarkable that genetic variation at a single BDNF locus would result in detectable differences within the range of normal human values in a relatively small sample of healthy individuals, thereby highlighting the importance of BDNF in regulating hippocampal function and possibly, hippocampal-dependent learning and memory. Results of a post-hoc regression analysis indicated that BNDF genotype accounted for 9% of the variance in NAA/Cre and 13% of the variance in NAA/Cho, suggesting that BDNF genetic variation considerably impacts hippocampal function in healthy individuals. Second, the current findings, obtained with higher resolution on a 3T scanner in a new sample of healthy comparison subjects, strengthen existing evidence that Met-BDNF alters hippocampal function and thus, may impact susceptibility to or expression of psychiatric disorders where hippocampal integrity is disrupted. The effect size for left hippocampal NAA/Cre in the current study (d=0.68) was larger than that in the earlier investigation by our group at 1.5T (d=0.51 when including the Met/Met group and d=0.30 when including only the genotypes considered here) (2), which may be the consequence of a more ethnically homogeneous sample in the present investigation. Genotype groups were either well-matched on demographic variables and number of voxels in each ROI (see Table 1) or effects of age and IQ were accounted for statistically, thus minimizing the potential for these confounding factors to have obscured the contribution of BDNF genetic variation to hippocampal NAA measures. Moreover, the observation that hippocampal volume and partial voluming of hippocampal GM did not differ between genotype groups suggests that these variables did not account for the reduced metabolite ratios in Met allele carriers in this sample. As only Caucasians of European ancestry were studied to avoid stratification artifacts, we are not able to comment on the impact of ethnicity on the frequency of the BDNF polymorphism or on hippocampal metabolite values. However, the genotype frequencies in our dataset are similar to those reported by the Hapmap project for Caucasian populations (http://www.ncbi.nlm.nih.gov/SNP/snp_ref.cgi?rs=6265).
We did not detect an effect of genotype on hippocampal volume, which contrasts with the reports of several others including our group (20-23). Nevertheless, other studies have failed to detect differences in hippocampal volume (19,45), while some found differences exclusively in the parahippocampal gyrus (5,46,47), which was not measured in our Freesurfer based determination. In our sample, absolute hippocampal volumes tended to be slightly larger in the Val/Met group, therefore excluding this as a possible cause for our spectroscopic findings. The lack of difference between genotypes in relative hippocampal volume could be a consequence of reduced power, since we studied a relatively small sample of twelve Val/Met subjects. In prior investigations, mean volume differences between genotype groups ranged between 2% (46) and 14% (22). Based on the literature where means and standard deviations were reported (19,20,22,23,46), power analysis indicates that >1000 individuals would be needed to detect a 2% volumetric difference, whereas only 62 individuals to detect a 6-8% difference with a power of 0.8 (assuming a 0.4 ratio for the frequency of Val/Met to Val/Val, as is typical for Caucasian populations). Thus, although our sample is slightly underpowered to demonstrate a biologically meaningful difference between genotype groups, the main reason for our lack of significance appears to be a small effect size of 0.13 (see also (45,47), where no finding was present in sample sizes of ~100 subjects).
Alternatively, differences in methodology in determining the volume of the hippocampus or in the MRI acquisition may explain discrepancies with the literature. The method employed here is completely automatic and has been demonstrated comparable in accuracy to manual labeling (40). This method is largely disparate from voxel based morphometry used by (5,22,47), however should yield similar results to other ROI based methods (19-21,23,45,46). An additional major distinction is that our data were acquired on a 3T rather than a 1.5T system with a sequence optimized for speed of acquisition rather than gray-white contrast. No efforts were made to correct inhomogeneities and distortions, which are more prominent at higher fields. While this acquisition was adequate to rule out an effect of hippocampal volume on the MRSI measures (obtained with much coarser resolution), it may not have been sufficiently sensitive to identify volumetric differences between genotype groups.
The combination of reduced NAA and intact volume in the left hippocampus might also suggest that NAA reductions are more sensitive than volumetric measures to BDNF genetic variation, perhaps resulting from greater biological proximity to the effects of the gene. NAA production is dependent on energy metabolism (48), reflecting the synthetic function of mitochondria, and is potentially correlated with glutamatergic transmission (49). Differences in glutamate content may account for greater than 80% of the variability in cellular NAA whereas differences in hippocampal neuron loss may account for only 5% of cellular NAA variability (49). Since impaired synaptic plasticity of glutamatergic synapses has been observed in diseases involving compromised BDNF function such as Huntington’s disease, depression and anxiety, BDNF may impact NAA via its influence on the glutamate system (50). Though the mechanism linking BDNF expression and NAA metabolism remains obscure, volumetric reduction may occur only in those people with more marked and advanced NAA deficits.
Converging evidence suggests that BDNF is involved in the promotion of neurogenesis, particularly in the hippocampus, which might be an important link in explaining how antidepressants exert their action (51-54). Animal studies modeling depression have shown that stress reduces neurogenesis (55,56), antidepressant treatments reverse this effect (57-59) and concomitant changes in metabolites, including NAA, occur (60-63). Some studies in humans have also demonstrated alterations in metabolites accompanying treatments known to affect neuronal plasticity (64-67). Although none of these studies is fully consistent with the pattern of changes in ratios observed in the present investigation, most studies have investigated acute changes, while genetic variants in BDNF are presumed to operate throughout the course of development. Thus, the “protective” Val allele might result in NAA increases, which may well be associated with heightened neurogenesis and/or neuronal survival in the hippocampus. Recently, novel spectroscopic methodology became available to study neurogenesis through identification of a new metabolite that indexes neural stem and progenitor cells in the hippocampus (68). We predict that BDNF genotypes would differ in the content of this metabolite in the hippocampus and that this difference could potentially correlate with NAA and Cho levels. Future studies utilizing this novel technique may aid in elucidating the potential association between neurogenesis, BDNF and metabolites such as NAA.
Our finding of a unilateral reduction in left hippocampal NAA is unexpected, though consistent with the earlier report by Egan et al. (2). To our knowledge, the present study and the earlier investigation by our group are the only reports to have explored the relationship between BDNF genotype and hippocampal NAA. The findings of these two studies are consistent with volumetric analyses reporting BDNF genotype to have a greater impact on left than right hippocampal volume (20,21), while evidence from functional MRI studies appears consistent with a bilateral reduction of hippocampal or parahippocampal activation in Met-allele carriers (2,3). We specifically tested the effect of hemisphere by conducting a repeated-measures ANOVA with left and right hippocampal NAA/Cre or NAA/Cho as the dependent variable and BDNF genotype as the categorical predictor, but found no significant interaction between genotype and hemisphere (data not shown). We conclude that there is no evidence for a specific effect of BDNF genotype on the left hemisphere hippocampal function, but this topic deserves further systematic investigation.
Limitations of the present study include the need to reject most voxels belonging to the anterior portion of the hippocampal formation due to susceptibility artifacts at 3T. Another limitation is the use of ratios as the primary outcome measures rather than absolute values. While ratios make data interpretation less certain because changes in either the numerator, denominator or both may be invoked to explain the results, they also present some technical advantages. For example, they do not require adjustment for CSF content in the voxel and they are immune to changes in the B1 field. Thus, the use of ratios may be better suited at higher fields where the B1 field is more inhomogeneous. A final limitation, which likely stems from power issues, is that had we applied a rigorous multiple comparison testing for two ratios and two hemispheres, our results for NAA/Cre would not have survived correction. It has been shown that up to 200 individuals would be needed to detect differences in NAA in the order of 5% (38) for studies performed with single voxels and a short TE in the hippocampus. Despite this bleak scenario, our data appears to be quite sensitive to genetic modifications and suggests a biologically meaningful effect exists regardless of formal (and arbitrary) statistical thresholds (69). Given the prior results of an effect of BDNF on hippocampal NAA measures that we sought specifically to test, justification for such statistical correction is dubious.
In conclusion, we confirm the importance of BDNF in maintaining hippocampal levels of NAA in a separate cohort of volunteers studied with high spectroscopic imaging resolution. The results of the present analysis substantiate the formerly described role of BDNF in regulating human hippocampal function.
Supplementary Material
Acknowledgments
This work was presented in part at the annual meeting of the Society of Biological Psychiatry, May 18, 2007, San Diego, CA. The funding for this work was provided entirely by the NIMH Intramural Research Program (IRP).
Footnotes
The authors reported no biomedical financial interests or potential conflicts of interest.
Publisher's Disclaimer: This is a PDF file of an unedited manuscript that has been accepted for publication. As a service to our customers we are providing this early version of the manuscript. The manuscript will undergo copyediting, typesetting, and review of the resulting proof before it is published in its final citable form. Please note that during the production process errors may be discovered which could affect the content, and all legal disclaimers that apply to the journal pertain.
References
- 1.Dempster E, Toulopoulou T, McDonald C, Bramon E, Walshe M, Filbey F, et al. Association between BDNF val66 met genotype and episodic memory. Am J Med Genet B Neuropsychiatr Genet. 2005;134:73–75. doi: 10.1002/ajmg.b.30150. [DOI] [PubMed] [Google Scholar]
- 2.Egan MF, Kojima M, Callicott JH, Goldberg TE, Kolachana BS, Bertolino A, et al. The BDNF val66met polymorphism affects activity-dependent secretion of BDNF and human memory and hippocampal function. Cell. 2003;112:257–269. doi: 10.1016/s0092-8674(03)00035-7. [DOI] [PubMed] [Google Scholar]
- 3.Hariri AR, Goldberg TE, Mattay VS, Kolachana BS, Callicott JH, Egan MF, et al. Brain-derived neurotrophic factor val66met polymorphism affects human memory-related hippocampal activity and predicts memory performance. J Neurosci. 2003;23:6690–6694. doi: 10.1523/JNEUROSCI.23-17-06690.2003. [DOI] [PMC free article] [PubMed] [Google Scholar]
- 4.Tan YL, Zhou DF, Cao LY, Zou YZ, Wu GY, Zhang XY. Effect of the BDNF Val66Met genotype on episodic memory in schizophrenia. Schizophr Res. 2005;77:355–356. doi: 10.1016/j.schres.2005.03.012. [DOI] [PubMed] [Google Scholar]
- 5.Ho BC, Milev P, O’Leary DS, Librant A, Andreasen NC, Wassink TH. Cognitive and magnetic resonance imaging brain morphometric correlates of brain-derived neurotrophic factor Val66Met gene polymorphism in patients with schizophrenia and healthy volunteers. Arch Gen Psychiatry. 2006;63:731–740. doi: 10.1001/archpsyc.63.7.731. [DOI] [PMC free article] [PubMed] [Google Scholar]
- 6.Cheng CY, Hong CJ, Yu YW, Chen TJ, Wu HC, Tsai SJ. Brain-derived neurotrophic factor (Val66Met) genetic polymorphism is associated with substance abuse in males. Brain Res Mol Brain Res. 2005;140:86–90. doi: 10.1016/j.molbrainres.2005.07.008. [DOI] [PubMed] [Google Scholar]
- 7.Ribases M, Gratacos M, Fernandez-Aranda F, Bellodi L, Boni C, Anderluh M, et al. Association of BDNF with anorexia, bulimia and age of onset of weight loss in six European populations. Hum Mol Genet. 2004;13:1205–1212. doi: 10.1093/hmg/ddh137. [DOI] [PubMed] [Google Scholar]
- 8.Krebs MO, Guillin O, Bourdell MC, Schwartz JC, Olie JP, Poirier MF, et al. Brain derived neurotrophic factor (BDNF) gene variants association with age at onset and therapeutic response in schizophrenia. Mol Psychiatry. 2000;5:558–562. doi: 10.1038/sj.mp.4000749. [DOI] [PubMed] [Google Scholar]
- 9.Sklar P, Gabriel SB, McInnis MG, Bennett P, Lim YM, Tsan G, et al. Family-based association study of 76 candidate genes in bipolar disorder: BDNF is a potential risk locus. Brain-derived neutrophic factor. Mol Psychiatry. 2002;7:579–593. doi: 10.1038/sj.mp.4001058. [DOI] [PubMed] [Google Scholar]
- 10.Strauss J, Barr CL, George CJ, Devlin B, Vetro A, Kiss E, et al. Brain-derived neurotrophic factor variants are associated with childhood-onset mood disorder: confirmation in a Hungarian sample. Mol Psychiatry. 2005;10:861–867. doi: 10.1038/sj.mp.4001685. [DOI] [PubMed] [Google Scholar]
- 11.Schumacher J, Jamra RA, Becker T, Ohlraun S, Klopp N, Binder EB, et al. Evidence for a relationship between genetic variants at the brain-derived neurotrophic factor (BDNF) locus and major depression. Biol Psychiatry. 2005;58:307–314. doi: 10.1016/j.biopsych.2005.04.006. [DOI] [PubMed] [Google Scholar]
- 12.Hong CJ, Huo SJ, Yen FC, Tung CL, Pan GM, Tsai SJ. Association study of a brain-derived neurotrophic-factor genetic polymorphism and mood disorders, age of onset and suicidal behavior. Neuropsychobiology. 2003;48:186–189. doi: 10.1159/000074636. [DOI] [PubMed] [Google Scholar]
- 13.Wassink TH, Nelson JJ, Crowe RR, Andreasen NC. Heritability of BDNF alleles and their effect on brain morphology in schizophrenia. Am J Med Genet. 1999;88:724–728. doi: 10.1002/(sici)1096-8628(19991215)88:6<724::aid-ajmg25>3.0.co;2-7. [DOI] [PubMed] [Google Scholar]
- 14.Itoh K, Hashimoto K, Shimizu E, Sekine Y, Ozaki N, Inada T, et al. Association study between brain-derived neurotrophic factor gene polymorphisms and methamphetamine abusers in Japan. Am J Med Genet B Neuropsychiatr Genet. 2005;132B:70–73. doi: 10.1002/ajmg.b.30097. [DOI] [PubMed] [Google Scholar]
- 15.Zhang H, Ozbay F, Lappalainen J, Kranzler HR, van Dyck CH, Charney DS, et al. Brain derived neurotrophic factor (BDNF) gene variants and Alzheimer’s disease, affective disorders, posttraumatic stress disorder, schizophrenia, and substance dependence. Am J Med Genet B Neuropsychiatr Genet. 2006;141B:387–393. doi: 10.1002/ajmg.b.30332. [DOI] [PMC free article] [PubMed] [Google Scholar]
- 16.Poo MM. Neurotrophins as synaptic modulators. Nat Rev Neurosci. 2001;2:24–32. doi: 10.1038/35049004. [DOI] [PubMed] [Google Scholar]
- 17.Altar CA, Siuciak JA, Wright P, Ip NY, Lindsay RM, Wiegand SJ. In situ hybridization of trkB and trkC receptor mRNA in rat forebrain and association with high-affinity binding of [125I]BDNF, [125I]NT-4/5 and [125I]NT-3. Eur J Neurosci. 1994;6:1389–1405. doi: 10.1111/j.1460-9568.1994.tb01001.x. [DOI] [PubMed] [Google Scholar]
- 18.Chen ZY, Patel PD, Sant G, Meng CX, Teng KK, Hempstead BL, et al. Variant brain-derived neurotrophic factor (BDNF) (Met66) alters the intracellular trafficking and activity-dependent secretion of wild-type BDNF in neurosecretory cells and cortical neurons. J Neurosci. 2004;24:4401–4411. doi: 10.1523/JNEUROSCI.0348-04.2004. [DOI] [PMC free article] [PubMed] [Google Scholar]
- 19.Miyajima F, Ollier W, Mayes A, Jackson A, Thacker N, Rabbitt P, et al. Brain-derived neurotrophic factor polymorphism Val66Met influences cognitive abilities in the elderly. Genes Brain Behav. 2007 doi: 10.1111/j.1601-183X.2007.00363.x. [DOI] [PubMed] [Google Scholar]
- 20.Bueller JA, Aftab M, Sen S, Gomez-Hassan D, Burmeister M, Zubieta JK. BDNF Val66Met allele is associated with reduced hippocampal volume in healthy subjects. Biol Psychiatry. 2006;59:812–815. doi: 10.1016/j.biopsych.2005.09.022. [DOI] [PubMed] [Google Scholar]
- 21.Frodl T, Schule C, Schmitt G, Born C, Baghai T, Zill P, et al. Association of the brain-derived neurotrophic factor Val66Met polymorphism with reduced hippocampal volumes in major depression. Arch Gen Psychiatry. 2007;64:410–416. doi: 10.1001/archpsyc.64.4.410. [DOI] [PubMed] [Google Scholar]
- 22.Pezawas L, Verchinski BA, Mattay VS, Callicott JH, Kolachana BS, Straub RE, et al. The brain-derived neurotrophic factor val66met polymorphism and variation in human cortical morphology. J Neurosci. 2004;24:10099–10102. doi: 10.1523/JNEUROSCI.2680-04.2004. [DOI] [PMC free article] [PubMed] [Google Scholar]
- 23.Szeszko PR, Lipsky R, Mentschel C, Robinson D, Gunduz-Bruce H, Sevy S, et al. Brain-derived neurotrophic factor val66met polymorphism and volume of the hippocampal formation. Mol Psychiatry. 2005;10:631–636. doi: 10.1038/sj.mp.4001656. [DOI] [PubMed] [Google Scholar]
- 24.Jung RE, Brooks WM, Yeo RA, Chiulli SJ, Weers DC, Sibbitt WL., Jr Biochemical markers of intelligence: a proton MR spectroscopy study of normal human brain. Proc Biol Sci. 1999;266:1375–1379. doi: 10.1098/rspb.1999.0790. [DOI] [PMC free article] [PubMed] [Google Scholar]
- 25.Jung RE, Yeo RA, Chiulli SJ, Sibbitt WL, Jr, Weers DC, Hart BL, et al. Biochemical markers of cognition: a proton MR spectroscopy study of normal human brain. Neuroreport. 1999;10:3327–3331. doi: 10.1097/00001756-199911080-00014. [DOI] [PubMed] [Google Scholar]
- 26.Valenzuela MJ, Sachdev PS, Wen W, Shnier R, Brodaty H, Gillies D. Dual voxel proton magnetic resonance spectroscopy in the healthy elderly: subcortical-frontal axonal N-acetylaspartate levels are correlated with fluid cognitive abilities independent of structural brain changes. Neuroimage. 2000;12:747–756. doi: 10.1006/nimg.2000.0629. [DOI] [PubMed] [Google Scholar]
- 27.Atmaca M, Yildirim H, Ozdemir H, Poyraz AK, Tezcan E, Ogur E. Hippocampal 1H MRS in first-episode bipolar I patients. Prog Neuropsychopharmacol Biol Psychiatry. 2006;30:1235–1239. doi: 10.1016/j.pnpbp.2006.03.032. [DOI] [PubMed] [Google Scholar]
- 28.Winsberg ME, Sachs N, Tate DL, Adalsteinsson E, Spielman D, Ketter TA. Decreased dorsolateral prefrontal N-acetyl aspartate in bipolar disorder. Biol Psychiatry. 2000;47:475–481. doi: 10.1016/s0006-3223(99)00183-3. [DOI] [PubMed] [Google Scholar]
- 29.Ham BJ, Chey J, Yoon SJ, Sung Y, Jeong DU, Ju Kim S, et al. Decreased N-acetyl-aspartate levels in anterior cingulate and hippocampus in subjects with post-traumatic stress disorder: a proton magnetic resonance spectroscopy study. Eur J Neurosci. 2007;25:324–329. doi: 10.1111/j.1460-9568.2006.05253.x. [DOI] [PubMed] [Google Scholar]
- 30.Castro-Fornieles J, Bargallo N, Lazaro L, Andres S, Falcon C, Plana MT, et al. Adolescent anorexia nervosa: Cross-sectional and follow-up frontal gray matter disturbances detected with proton magnetic resonance spectroscopy. J Psychiatr Res. 2007;41:952–958. doi: 10.1016/j.jpsychires.2006.09.013. [DOI] [PubMed] [Google Scholar]
- 31.Davidson JR, Krishnan KR, Charles HC, Boyko O, Potts NL, Ford SM, et al. Magnetic resonance spectroscopy in social phobia: preliminary findings. J Clin Psychiatry. 1993;54(Suppl):19–25. [PubMed] [Google Scholar]
- 32.Callicott JH, Egan MF, Bertolino A, Mattay VS, Langheim FJ, Frank JA, et al. Hippocampal N-acetyl aspartate in unaffected siblings of patients with schizophrenia: a possible intermediate neurobiological phenotype. Biol Psychiatry. 1998;44:941–950. doi: 10.1016/s0006-3223(98)00264-9. [DOI] [PubMed] [Google Scholar]
- 33.Marenco S, Bertolino A, Weinberger DR. In vivo NMR measures of NAA and the neurobiology of schizophrenia. Adv Exp Med Biol. 2006;576:227–240. doi: 10.1007/0-387-30172-0_16. discussion 361-223. [DOI] [PubMed] [Google Scholar]
- 34.Bertolino A, Nawroz S, Mattay VS, Barnett AS, Duyn JH, Moonen CT, et al. Regionally specific pattern of neurochemical pathology in schizophrenia as assessed by multislice proton magnetic resonance spectroscopic imaging. Am J Psychiatry. 1996;153:1554–1563. doi: 10.1176/ajp.153.12.1554. [DOI] [PubMed] [Google Scholar]
- 35.Egan MF, Goldberg TE, Gscheidle T, Weirich M, Bigelow LB, Weinberger DR. Relative risk of attention deficits in siblings of patients with schizophrenia. Am J Psychiatry. 2000;157:1309–1316. doi: 10.1176/appi.ajp.157.8.1309. [DOI] [PubMed] [Google Scholar]
- 36.Tedeschi G, Bertolino A, Campbell G, Barnett AS, Duyn JH, Jacob PK, et al. Reproducibility of proton MR spectroscopic imaging findings. AJNR Am J Neuroradiol. 1996;17:1871–1879. [PMC free article] [PubMed] [Google Scholar]
- 37.van Der Veen JW, Weinberger DR, Tedeschi G, Frank JA, Duyn JH. Proton MR spectroscopic imaging without water suppression. Radiology. 2000;217:296–300. doi: 10.1148/radiology.217.1.r00oc36296. [DOI] [PubMed] [Google Scholar]
- 38.Venkatraman TN, Hamer RM, Perkins DO, Song AW, Lieberman JA, Steen RG. Single-voxel 1H PRESS at 4.0 T: precision and variability of measurements in anterior cingulate and hippocampus. NMR Biomed. 2006;19:484–491. doi: 10.1002/nbm.1055. [DOI] [PubMed] [Google Scholar]
- 39.Jenkinson M, Smith S. A global optimisation method for robust affine registration of brain images. Med Image Anal. 2001;5:143–156. doi: 10.1016/s1361-8415(01)00036-6. [DOI] [PubMed] [Google Scholar]
- 40.Fischl B, Salat DH, Busa E, Albert M, Dieterich M, Haselgrove C, et al. Whole brain segmentation: automated labeling of neuroanatomical structures in the human brain. Neuron. 2002;33:341–355. doi: 10.1016/s0896-6273(02)00569-x. [DOI] [PubMed] [Google Scholar]
- 41.Goldman AL, Pezawas L, Mattay VS, Fischl B, Verchinski BA, Zoltick B, et al. Heritability of Brain Morphology Related to Schizophrenia: A Large-Scale Automated Magnetic Resonance Imaging Segmentation Study. Biol Psychiatry. 2007 doi: 10.1016/j.biopsych.2007.06.006. [DOI] [PubMed] [Google Scholar]
- 42.Lang UE, Sander T, Lohoff FW, Hellweg R, Bajbouj M, Winterer G, et al. Association of the met66 allele of brain-derived neurotrophic factor (BDNF) with smoking. Psychopharmacology (Berl) 2007;190:433–439. doi: 10.1007/s00213-006-0647-1. [DOI] [PubMed] [Google Scholar]
- 43.Beuten J, Ma JZ, Payne TJ, Dupont RT, Quezada P, Huang W, et al. Significant association of BDNF haplotypes in European-American male smokers but not in European-American female or African-American smokers. Am J Med Genet B Neuropsychiatr Genet. 2005;139B:73–80. doi: 10.1002/ajmg.b.30231. [DOI] [PubMed] [Google Scholar]
- 44.Gallinat J, Lang UE, Jacobsen LK, Bajbouj M, Kalus P, von Haebler D, et al. Abnormal hippocampal neurochemistry in smokers: evidence from proton magnetic resonance spectroscopy at 3 T. J Clin Psychopharmacol. 2007;27:80–84. doi: 10.1097/JCP.0b013e31802dffde. [DOI] [PubMed] [Google Scholar]
- 45.Agartz I, Sedvall GC, Terenius L, Kulle B, Frigessi A, Hall H, et al. BDNF gene variants and brain morphology in schizophrenia. Am J Med Genet B Neuropsychiatr Genet. 2006;141:513–523. doi: 10.1002/ajmg.b.30338. [DOI] [PubMed] [Google Scholar]
- 46.Takahashi T, Suzuki M, Tsunoda M, Kawamura Y, Takahashi N, Tsuneki H, et al. Association between the brain-derived neurotrophic factor Val66Met polymorphism and brain morphology in a Japanese sample of schizophrenia and healthy comparisons. Neurosci Lett. 2008;435:34–39. doi: 10.1016/j.neulet.2008.02.004. [DOI] [PubMed] [Google Scholar]
- 47.Nemoto K, Ohnishi T, Mori T, Moriguchi Y, Hashimoto R, Asada T, et al. The Val66Met polymorphism of the brain-derived neurotrophic factor gene affects age-related brain morphology. Neurosci Lett. 2006;397:25–29. doi: 10.1016/j.neulet.2005.11.067. [DOI] [PubMed] [Google Scholar]
- 48.Bates TE, Strangward M, Keelan J, Davey GP, Munro PM, Clark JB. Inhibition of N-acetylaspartate production: implications for 1H MRS studies in vivo. Neuroreport. 1996;7:1397–1400. [PubMed] [Google Scholar]
- 49.Petroff OA, Errante LD, Rothman DL, Kim JH, Spencer DD. Neuronal and glial metabolite content of the epileptogenic human hippocampus. Ann Neurol. 2002;52:635–642. doi: 10.1002/ana.10360. [DOI] [PubMed] [Google Scholar]
- 50.Carvalho AL, Caldeira MV, Santos SD, Duarte CB. Role of the brain-derived neurotrophic factor at glutamatergic synapses. Br J Pharmacol. 2007 doi: 10.1038/sj.bjp.0707509. [DOI] [PMC free article] [PubMed] [Google Scholar]
- 51.Katoh-Semba R, Asano T, Ueda H, Morishita R, Takeuchi IK, Inaguma Y, et al. Riluzole enhances expression of brain-derived neurotrophic factor with consequent proliferation of granule precursor cells in the rat hippocampus. Faseb J. 2002;16:1328–1330. doi: 10.1096/fj.02-0143fje. [DOI] [PubMed] [Google Scholar]
- 52.Pencea V, Bingaman KD, Wiegand SJ, Luskin MB. Infusion of brain-derived neurotrophic factor into the lateral ventricle of the adult rat leads to new neurons in the parenchyma of the striatum, septum, thalamus, and hypothalamus. J Neurosci. 2001;21:6706–6717. doi: 10.1523/JNEUROSCI.21-17-06706.2001. [DOI] [PMC free article] [PubMed] [Google Scholar]
- 53.Schmidt HD, Duman RS. The role of neurotrophic factors in adult hippocampal neurogenesis, antidepressant treatments and animal models of depressive-like behavior. Behav Pharmacol. 2007;18:391–418. doi: 10.1097/FBP.0b013e3282ee2aa8. [DOI] [PubMed] [Google Scholar]
- 54.Duman RS, Monteggia LM. A neurotrophic model for stress-related mood disorders. Biol Psychiatry. 2006;59:1116–1127. doi: 10.1016/j.biopsych.2006.02.013. [DOI] [PubMed] [Google Scholar]
- 55.Gould E, Tanapat P. Stress and hippocampal neurogenesis. Biol Psychiatry. 1999;46:1472–1479. doi: 10.1016/s0006-3223(99)00247-4. [DOI] [PubMed] [Google Scholar]
- 56.Gould E, McEwen BS, Tanapat P, Galea LA, Fuchs E. Neurogenesis in the dentate gyrus of the adult tree shrew is regulated by psychosocial stress and NMDA receptor activation. J Neurosci. 1997;17:2492–2498. doi: 10.1523/JNEUROSCI.17-07-02492.1997. [DOI] [PMC free article] [PubMed] [Google Scholar]
- 57.Duman RS, Heninger GR, Nestler EJ. A molecular and cellular theory of depression. Arch Gen Psychiatry. 1997;54:597–606. doi: 10.1001/archpsyc.1997.01830190015002. [DOI] [PubMed] [Google Scholar]
- 58.McEwen BS, Magarinos AM, Reagan LP. Structural plasticity and tianeptine: cellular and molecular targets. Eur Psychiatry. 2002;17(Suppl 3):318–330. doi: 10.1016/s0924-9338(02)00650-8. [DOI] [PubMed] [Google Scholar]
- 59.Malberg JE, Eisch AJ, Nestler EJ, Duman RS. Chronic antidepressant treatment increases neurogenesis in adult rat hippocampus. J Neurosci. 2000;20:9104–9110. doi: 10.1523/JNEUROSCI.20-24-09104.2000. [DOI] [PMC free article] [PubMed] [Google Scholar]
- 60.Czeh B, Michaelis T, Watanabe T, Frahm J, de Biurrun G, van Kampen M, et al. Stress-induced changes in cerebral metabolites, hippocampal volume, and cell proliferation are prevented by antidepressant treatment with tianeptine. Proc Natl Acad Sci U S A. 2001;98:12796–12801. doi: 10.1073/pnas.211427898. [DOI] [PMC free article] [PubMed] [Google Scholar]
- 61.Czeh B, Pudovkina O, van der Hart MG, Simon M, Heilbronner U, Michaelis T, et al. Examining SLV-323, a novel NK1 receptor antagonist, in a chronic psychosocial stress model for depression. Psychopharmacology (Berl) 2005;180:548–557. doi: 10.1007/s00213-005-2184-8. [DOI] [PubMed] [Google Scholar]
- 62.van der Hart MG, Czeh B, de Biurrun G, Michaelis T, Watanabe T, Natt O, et al. Substance P receptor antagonist and clomipramine prevent stress-induced alterations in cerebral metabolites, cytogenesis in the dentate gyrus and hippocampal volume. Mol Psychiatry. 2002;7:933–941. doi: 10.1038/sj.mp.4001130. [DOI] [PubMed] [Google Scholar]
- 63.Sartorius A, Neumann-Haefelin C, Vollmayr B, Hoehn M, Henn FA. Choline rise in the rat hippocampus induced by electroconvulsive shock treatment. Biol Psychiatry. 2003;53:620–623. doi: 10.1016/s0006-3223(02)01600-1. [DOI] [PubMed] [Google Scholar]
- 64.Moore GJ, Bebchuk JM, Hasanat K, Chen G, Seraji-Bozorgzad N, Wilds IB, et al. Lithium increases N-acetyl-aspartate in the human brain: in vivo evidence in support of bcl-2’s neurotrophic effects? Biol Psychiatry. 2000;48:1–8. doi: 10.1016/s0006-3223(00)00252-3. [DOI] [PubMed] [Google Scholar]
- 65.Mathew SJ, Price RB, Mao X, Smith EL, Coplan JD, Charney DS, et al. Hippocampal N-acetylaspartate concentration and response to riluzole in generalized anxiety disorder. Biol Psychiatry. 2008;63:891–898. doi: 10.1016/j.biopsych.2007.09.012. [DOI] [PMC free article] [PubMed] [Google Scholar]
- 66.Obergriesser T, Ende G, Braus DF, Henn FA. Long-term follow-up of magnetic resonance-detectable choline signal changes in the hippocampus of patients treated with electroconvulsive therapy. J Clin Psychiatry. 2003;64:775–780. doi: 10.4088/jcp.v64n0706. [DOI] [PubMed] [Google Scholar]
- 67.Ende G, Braus DF, Walter S, Weber-Fahr W, Henn FA. The hippocampus in patients treated with electroconvulsive therapy: a proton magnetic resonance spectroscopic imaging study. Arch Gen Psychiatry. 2000;57:937–943. doi: 10.1001/archpsyc.57.10.937. [DOI] [PubMed] [Google Scholar]
- 68.Manganas LN, Zhang X, Li Y, Hazel RD, Smith SD, Wagshul ME, et al. Magnetic resonance spectroscopy identifies neural progenitor cells in the live human brain. Science. 2007;318:980–985. doi: 10.1126/science.1147851. [DOI] [PMC free article] [PubMed] [Google Scholar]
- 69.Rothman KJ. No adjustments are needed for multiple comparisons. Epidemiology. 1990;1:43–46. [PubMed] [Google Scholar]
Associated Data
This section collects any data citations, data availability statements, or supplementary materials included in this article.