

Abstract
Among the pro-inflammatory mediators, platelet-activating factor (PAF, 1-O-alkyl-2-acetyl-sn-glycero-3-phosphorylcholine) is a major primary and secondary messenger involved in intra and extra cellular communication. Evidence suggests that PAF plays a significant role in oncogenic transformation, tumor growth, angiogenesis and metastasis. However, PAF, with its receptor (PAFR) and their downstream signaling targets have not been thoroughly studied in cancer. Here, we characterized the PAFR expression pattern in 4 normal human ovarian surface epithelial cell lines (HOSE), 13 ovarian cancer cell lines, paraffin blocks (n=84) and tissue microarrays (n=230) from ovarian cancer patients. Overexpression of PAFR was found in most non-mucinous types of ovarian cancer but not in HOSE and mucinous cancer cells. Correspondingly, PAF significantly induced cell proliferation and invasion only in PAFR-positive cells (i.e. OVCA429 and OVCA432), but not in PAFR-negative ovarian cells (HOSE and mucinous RMUG-L). Dependency of cell proliferation and invasion on PAFR was further confirmed using PAFR specific siRNA gene silencing probes, antibodies against PAFR and PAFR antagonist, ginkgolide B. Using quantitative multiplex phospho-antibody array technology, we found that tyrosine phosphorylation of EGFR/Src/FAK/Paxilin were coordinately activated by PAF treatment, which was correlated with activation of PI3K and cyclin D1, as markers for cell proliferation, and MMP2 and MMP9 for invasion. Specific tyrosine Src inhibitor (PP2) reversibly blocked PAF-activated cancer cell proliferation and invasion. We suggest that PAFR is an essential upstream target of Src and other signal pathways to control the PAF-mediated cancer progression.
Keywords: Platelet Activating Factor Receptor, Ginkgolide B, Tyrosine Phosphorylation, EGFR, Src, FAK, Paxillin
Introduction
Platelet activating factor (PAF), prostaglandins (PGs) and lysophosphatidic acid (LPA) are three major phospholipid mediators shown to be involved in many different biological pathways in inflammatory diseases and cancer (1-5). Molecular pathways regulated by prostaglandins and lysophosphatidic acid have been extensively studied in many cancers (6-9) including ovarian cancer (10). Their importance is underscored by the emergence of COX inhibitors and non-steroidal anti-inflammatory drugs (NSAIDs) as potent anti-cancer agents targeting PGs and LPA (11). Like PGs and LPA, PAF is an important proinflammatory activator of platelets, neutrophils, macrophages, lymphocytes and endothelial cells, which are often essential micro-environmental components interacting with the cancer cells (12-14).
PAF induces its multiple cellular effects through its specific receptor, PAFR, which belongs to the G-protein coupled receptor (GPCR) family and transduces cell signals via the G-proteins and associated protein phosphorylation cascades (15, 16). PAF also plays a significant role in oncogenic transformation (17), anti-apoptosis (18), metastasis (19) and angiogenesis in several types of cancers (20). Transgenic mice overexpressing PAFR displayed proliferative disorders and melanocytic tumors (21). In normal rat fibroblasts overexpressing PAFR, PAF induced immediate early oncogene expression and mitogenic responses (17). In addition, many types of cells, when challenged with PAF, displayed activation of tyrosine kinase (22) and protein phosphorylation (23). PAF induces early tyrosine phosphorylation signals through focal adhesion kinase (FAK) and paxillin in human endothelial cells (24), and induces cell proliferation through EGFR activation in keratinocytes (25). However, the significance of these tyrosine phosphorylation signaling pathways associated with PAF/PAFR has not been characterized in human cancers including ovarian cancer, the most lethal gynecological malignancy associated with abnormal lipid and hormonal metabolism (26, 27).
Ginkgolide B, a specific antagonist of PAFR, is found exclusively in the herbal Ginkgo biloba. Our previous studies showed that Ginkgolide B specifically inhibits non-mucinous ovarian cancer proliferation via cell cycle blockage (28). This suggests that different subtypes of ovarian cancer cells might have different PAFR expression profiles that mediate the ginkgolide B response. We hypothesize that ovarian cancer cell lines and tissue specimens with different PAFR gene expression would be a valuable model system to investigate the regulatory mechanisms of PAF-PAFR with its associated signal pathways in ovarian cancer progression.
In this study, we have characterized the PAFR gene and protein expression in different subtypes of ovarian cancer cell lines and tissue specimens collected from different histological subtypes of ovarian cancers. Potential PAFR-dependent biological functions including cell proliferation and invasion, were examined by blockage using PAFR specific antibody, antagonist ginkgolide B and siRNAs gene silencing probes. Using the phospho-antibody microarray technology, phosphorylation of a set of oncoprotein targets (EGFR/Src/FAK/Paxillin) induced by PAF was evaluated in OVCA429 ovarian cancer cells and further validated in OVCA432 and RMUG-L cells with positive and negative PAFR expression, respectively.
Materials and Methods
Chemical Reagents
Dimethyl sulphoxide (DMSO), Platelet Activating Factor and Ginkgolide B (>90% HPLC grade), cell culture mediums of MCDB-105 and medium 199 were purchased from Sigma-Aldrich (St. Louis, MO) and F12 from Invitrogen (Carlsbad, CA). Mercator Array Phospho-8-Plex and the relevant phospho-antibodies were purchased from Biosource, Invitrogen (Hopkinton, MA). Kinase inhibitor PP2 was purchased from Sigma-Aldrich (St. Louis, MO), A25 and LY294002 from Calbiochem (San Diego, CA) and erlotinib from LC laboratories® (Woburn, MA), respectively.
Tissue Samples
Paraffin-embedded tissue was assembled from specimens collected and archived from patients who had undergone primary surgery at Brigham and Women’s Hospital (Boston, MA). All patient-derived specimens were collected under protocol approved by the Institutional Review Board (IRB) at Brigham and Women’s Hospital. Clinical stage and histological subtype were defined by the International Federation of Gynecology and Obstetrics system.
Cell Lines
Ovarian cancer cell lines derived from serous (DOV13, OVCA3, OVCA429, OVCA432, OVCA433, SKOV3), mucinous (MCAS, RMUG-L, RMUG-S), clear cell (ES2, TOV21G, RMG1), and endometrioid (TOV112D) adenocarcinomas were used in this study. Cell lines SKOV3, RMG1, ES2, OVCAR3, MCAS, RMUG-L, RMUG-S, and TOV112D were purchased from American Type Culture Collection (Rockville, MD) and Japanese Collection of Research Bioresources (Tokyo, Japan). Other cell lines were established in the Laboratory of Gynecologic Oncology at Brigham and Women’s Hospital. Normal human ovarian surface epithelium (HOSE) cells were obtained from fresh ovarian scrapings at the time of surgery for benign conditions. Immortalized HOSE cells were obtained by transfecton of primary HOSE cells with a retroviral vector expressing HPV-E6E7 oncogenes (29).
Cell Culture and Treatment
Cells were cultured in sterile 75-cm2 cell culture flasks in MCDB 105 and medium 199 supplemented with 10% Fetal Bovine Serum (Gemini Bioproducts Woodland, CA) and 1% antibiotic (200mM L- Glutamine, 10,000 U Penicillin and 10mg Streptomycin per milliliter). RMUG-S cells were cultured in F-12 medium with 10% Fetal Bovine Serum and 1% antibiotic as above. Cells were maintained at 37°C under 5% CO2/95% air in a high humidity chamber. Monolayer cells at 60-80% confluence were enzymatically removed using trypsin/EDTA and plated in 96 well flat-bottom plates at concentration of 1×10³ per well for OVCA429 and OVCA432, 5×10³ per well for HOSE-E6E7 cells and RMUG-L. After overnight plating and 24 hours free-serum starving, cells were treated with different concentrations of PAF, ranging from 1 pM to 1 μM, tyrosine kinase inhibitor PP2 (10 μM), A25 (10 μM) and ginkgolide B (100 μM). An equal volume of DMSO (<1% concentration) was used as control. A polyclonal antibody against PAFR (1μg/mL) was diluted in 1: 2000 to 1:50 in serum-free medium and calibrated with equal volume of non-specific pure IgG as negative control.
Cell Proliferation and Invasion Assay
Cell proliferation was assessed using an MTT [3-(4,5-dimethylthiazol-2-yl)-2,5-diphenyltetrazolium bromide] assay (30) (Promega, Madison, WI). After 72 hours of treatment, 10μl of the MTT dye solution was added to each well and the plates were incubated at 37°C for 4 hours in a humidified chamber. After incubation, 100μl of the solubilization/stop solution was added to each well. One hour after the addition of the solubilization solution, the content of the wells were mixed and read by the 96-well plate scanning spectrophotometer (μQuant) and quantitative software (KC-junior, Bio-Tek Instruments, Inc.) at an absorbance of 630 nm for quantitative analysis. Ginkgolide B, PAFR antibody and inhibitors were pretreated with serum-free condition for 0.5 h in OVCA429 and OVCA432 cancer cells (104 per well coating) before addition of PAF, followed by 72 hours treatment and MTT assay. Data was collected from at least two separate experiments and 8 repeats were performed for each treatment. Cell proliferation activity was presented as percentage of the control with an equivalent volume of DMSO (as 100%).
Cell invasion activity assay for OVCA429 and OVCA432 cells were conducted with an 8 μm matrigel invasion chamber (Corning, NY). Experiments were carried out according to the manufacture’s protocol. Briefly, each well insert was coated with 100 μl of 1:10 mixture matrigel:serum-free medium, followed by incubation at 37°C for 4 hours. After 0.5 h pretreatment with inhibitor in serum-free condition, cells were then trypsin digested and transferred into top matrigel wells (105 cancer cells per well) with addition of 0.1% BSA, inhibitor, and 100nM of PAF. 600 μl of 10% FBS media was added to the bottom of the chamber and incubated at 37°C for 36 hours. Ginkgolide B, PAFR antibody and inhibitors (PP2 and A25) were pre-treated the OVCA432 and OVCA429 cells for 1 hour before addition of PAF for 36 hours in the invasion assay. Invasion activity was assessed by the number of cells that crossed the matrigel and filter membrane. Filter membranes were fixed in 95% ethanol and stained with 0.1% crystal solution. Cell numbers were counted under a light microscope and presented as percentage compared to the controls. Experiments were performed twice, at least three repeats for each treatment.
RNA Extraction and Quantitative Real Time-PCR
Total RNA was isolated from 2 primary HOSE cell culture, 2 immortalized HOSE cell lines, 13 ovarian cancer cell lines, and 84 ovarian cancer specimens including 8 mucinous, 9 serous high grade/early stage (Fig. 1B), 45 serous late stages invasive, 11 endometrioid and 11 clear cell subtype. The extraction of RNA was performed according to the manufacturer’s protocol (Qiagen, Valencia, CA) and amplified using the Superscript First-Strand Synthesis System for RT-PCR (Invitrogen, Carlsbad, CA). Laser captured microdissected tissue was processed for RNA extraction and cDNA amplification using the published method (31). RT-PCR primers (assay ID: HS00265399_s1) for PAFR and cyclophylin A, as the housekeeping gene, were purchased from Applied Biosystems (Foster City, CA). Each qRT-PCR reaction started with a 10-minute hold at 95 °C, followed by 40 cycles of denaturation at 95 °C for 125 seconds, followed by annealing/extending at 60 °C for one minute. All experiments were run in duplicate and repeated twice. The 7300-Real-Time PCR System software was used to monitor the amplification process and determine the threshold cycle (Ct) for each reaction. Quantification was performed using methods described previously (32).
Figure 1.
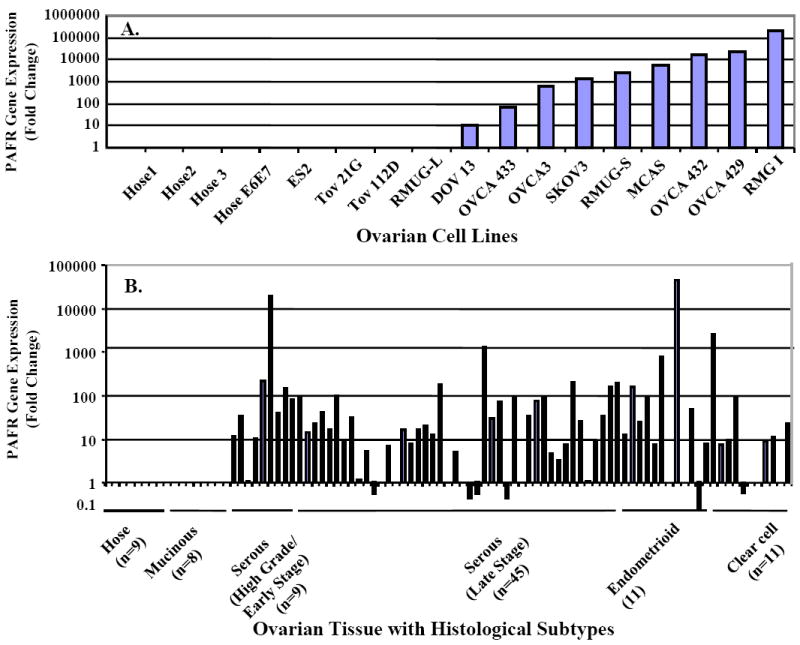
PAFR gene expression of in ovarian cancer cell lines and ovarian cancer tissue specimens. Quantitative real-time PCR was performed using isolated total RNA extracts. Amplified cDNA was calibrated with the housekeeping gene cyclophylin A. Relative PAFR gene expression level in ovarian cancer cell lines were normalized with normal HOSE (A). The relative PAFR gene expression of ovarian cancer cells isolated from the LCM micro-dissected cancerous cells from the slides of individual cancer patients was present as fold-of-increase compared to the PAFR expression in the normal HOSE cells (B).
Tissue Micro-Array and Immunohistochemistry
Five-micrometer sections of tissue microarrays were obtained from the Gynecologic Oncology Group tissue bank containing a tissue from 27 benign patients, 62 with mucinous, 30 with serous borderline, 43 with serous invasive, 28 with endometrioid, and 42 with clear cell tumors. Immunohistochemical analysis was carried out for PAFR protein expression. Human pancreatic tissue sections were used as a positive control. Immunohistochemistry (IHC) was performed using the EnVision/AP system (DakoCytomation, Carpinteria, CA). This system used an anti-rabbit immunoglobulin conjugated to an alkaline phosphotase polymer (Labeled polymer-AP), which is revealed as a red stain after the addition of the Substrate-Chromogen solution. Slides were washed with deionized water and counterstained with hematoxylin and 5% ammonium hydroxide, and mounted in Accergel (Accurate Chemical and Scientific Corp., Westbury, NY). The photomicrograph image was recorded by a digital camera (Optronic, Goleta, CA). Each subject had 3 independent readings by two investigators using a semi-quantitative scoring system: 0, absent or trace staining; 1, minimal staining; 2, moderate staining; or 3, strong staining.
Western Blot and antibodies
Cells were washed twice with 1X phosphate buffered saline (PBS) and then lysed by protein lysis buffer containing PMSF and Protease Inhibitor Cocktail I and II (Sigma-Aldrich, St. Louis, MO). After a brief vortexing and centrifuging at 4°C, the Bradford Protein Assay Kit (Bio-Rad) was used for protein quantification of the cell lysates. Total cell protein lysates were separated by 7% or 16% SDS-PAGE gel (10 μg per well) based on the size of protein detected. Proteins were transferred to PVDF membrane (Perkin Elmer, Boston, MA) using the SEMI-DRY Transfer Cell (Bio-Rad Laboratories, Hercules, CA), and blocked with 5% fat-free dry milk at 4 °C overnight. The membrane was subsequently washed and incubated with anti-PAFR antibody (Cayman Chemical, Ann Arbor, MI) in blocking solution at 1:125 dilution for two hours. Following three washes, secondary anti-rabbit IgG antibody (1:2,000) with peroxidase conjugate was used to reveal the protein expression signals with chemiluminescent kit (Pierce Chemical Co. Rockford, IL). Similar approach was used to detect phospho- EGFR, FAK, Paxillin, Src, and protein PI3K, cyclin D1, MMP2 and MMP9 (Cell Signaling Tech. Danvers, MA), with 1:1000 dilution for the primary antibodies.
Small interfering RNA (siRNA) treatment
Three pre-designed PAFR siRNA probes and a silencer negative control siRNA were purchased from Ambion (Austin, TX). The PAFR siRNAs were targeted to exon 2 (P1 sense: GGGAUAUCUACUGUGGUCUtt antisense AGACCACAGUAGAUAUCCCtt; P2 sense: CCCUGUUAUCUACUACUGUUUCtt antisense: GAAACAGUAGAUAACAGGGtc; P3 sense: GGCCAUUAAUGAUGCACAUtt antisense: AUGUGCAUCAUUAAUGGCCtg). Reverse transfection was carried out using the siPORT amine (Ambion, Austin, Tx) with a final concentration of 30 nM siRNA. After 24 hours incubation, media was replaced to decrease toxicity. Knockdown of PAFR gene expression was verified by qRT-PCR and further confirmed by western blot after 72h of initial transfection. Specific silencing of targeted genes was confirmed by three independent experiments.
Phosphoarray Analysis
We analyzed differential phosphorylation activation of multiple signaling phospho-proteins of EGFR [pY1068], MAPK p38 [pTpY180/182], Akt/PKB [pS473], FAK [pY397], Src [pY418], Paxillin [pY118], HSP27 [pS82] and ATF2 [pTpT69/71] using an Invitrogen Mercator Cell Adhesion 8-plex phoshoarray. Briefly, 16 pad-slides were first blocked with 70 μl polymer-based blocking buffer for 15 minutes prior to adding the protein samples, purified calibration standards or lysates prepared from OVCA429 cells of untreated control, treated with PAF alone (100 nM) or PAF (100 nM) and Ginkgolide B (100μM) at different time points. 70μl of each of the eight diluted samples was added to determine the standard curve for each of the 8-plex markers. Additionally, control and treated lysates were also evaluated for the phosphorylation level of the 8-Plex markers, where 70 μg of protein lysates were added per well and incubated with mild shaking for 3 hours at room temperature. The unbound materials were subsequently removed from the wells by washing steps. Next, 125 μl (1mg/mL) of the “array-detector-antibody” containing a mixture of all eight polyclonal phospho-antibodies was added to each pad and incubated for 1 hour at room temperature. Following three washing steps with 90μL of TBST, the wells were incubated with 70 μl (1μg/mL) of the fluorescently conjugated secondary antibody for 45 minutes at room temperature. At the completion of incubation, the slides were washed three times with 90 μl of TBST buffer and then quickly rinsed in distilled water. The slides were then allowed to dry for 5 minutes by incubating at 37°C. The phospho-array slides were scanned with an Axon Genepix scanner (Molecular Devices Co, Downingtown, PA) for image acquisition and the data was analyzed using the ArrayVision™ software.
Statistical Analysis
For the immune staining intensity and quantification, the average was derived from the individual intensity score for each subject and the mean value per subject was used to calculate the mean value for each group. Analysis of variance was used to test for differences in PAFR protein expression between case groups using a Bonferroni correction for multiple comparisons. A t-test analysis was used to compare the protein expression level between early and late stage cases. ANOVA tests were used for analysis of the data derived from the cell proliferation and invasion assays to show the significance between the treated and untreated cells in different experiments.
Results
PAFR gene expression pattern in ovarian cancer cell lines and tissue specimens
PAFR expression levels were significantly higher in 9 of the 13 cancer cell lines and exhibited up to 10,000-fold increase. PAFR gene expression was not detected in RMUG-L, TOV-21G, TOV112D and ES2 cells, when compared to the levels found in immortalized HOSE cells (Fig. 1A). To investigate the mRNA expression pattern in ovarian cancer tissue samples, total RNA was isolated from cultured ovarian cancer cell lines and the micro-dissected ovarian surface epithelial cancer cells from 84 ovarian cancer patients. As shown in Fig. 1B, PAFR gene expression was undetectable in 9 HOSE cell lines and 8 mucinous samples. PAFR was overexpressed in ovarian cancer tissues but varied across different histological subtypes of ovarian cancers. PAFR expression was significantly increased in 8 of 9 high-grade early stage serous (88.8%), 34 of 45 late stage serous invasive (75.5%), 8 of 11 endometrioid (72.7%) and 7 of 11 clear cell type cancers (63.6%) compared to normal ovarian cells and ranged from 10 to 10000-fold greater.
We then examined PAFR protein expression by western blot using the specific polyclonal antibody against human PAFR in a series of ovarian cancer cell lines. Immune blot analysis revealed that two specific PAFR protein bands at 48 kDa and 59 kDa were absent in the HOSE cell lines and two of three mucinous type cancer cells (RMUG-L, MCAS, RMUG-S) and showed the upper positive band in endometrioid ovarian cancer cell line (TOV112D), 3 clear cell types (ES-2, TOV21G, RMG-1) and 6 serous type ovarian cancer cell lines (OVCA3, OVCA432, OVCA433, OVCA429, DOV13 SKOV3, Fig. 2A). Molecular weight difference of PAFR proteins shown in Fig. 2A may be due to a splice variant of PAFR or post-translational modification (33).
Figure 2.
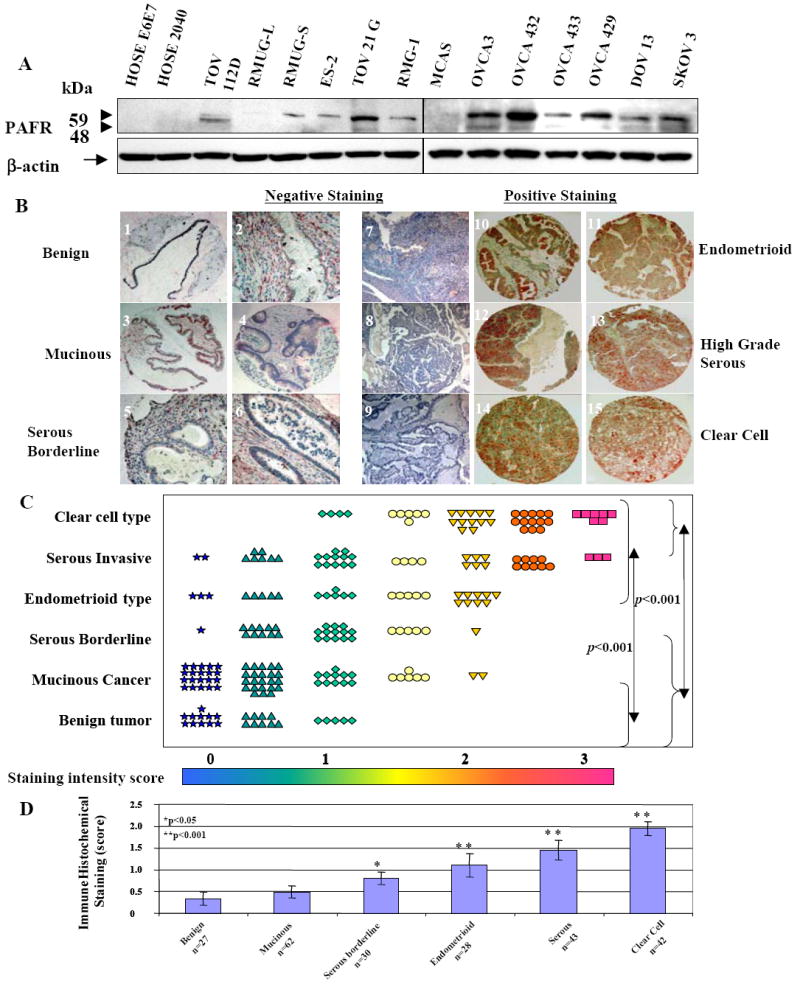
PAFR protein expression patterns in ovarian cancer cell lines and ovarian cancer tissue specimens. A. PAFR protein expression was revealed by western blot with a specific polyclonal antibody against human PAFR. B. Tissue micro-array based immunohistochemical staining with specific PAFR antibody showed that PAFR is negative or less detectable in benign, mucinous and serous borderline tumor (slide 1-6), but over-expression in clear cell type, endometrioid and high-grade serous ovarian tumors (slides 10-15), negative control staining of the slides without primary antibody were present (slides 7-9) for endometrioid, high-grade serous and clear cell type respectively. C. Summary of the immune staining intensity scale (mean value of duplicates) for PAFR expression of the individual patient in different histological subtypes. D. Summary of immune staining intensity of PAFR expression in each subtype of patient groups. Significant difference between groups was statistically analyzed by using one-way analysis of variance and Bonferroni multiple comparison tests (*: p<0.05, **: p<0.001).
Immunohistochemical staining on the tissue micro-arrays containing different histological types of pre-operative tissue specimens revealed that PAFR protein expression was significantly higher in ovarian cancer patients (n=205) compared to that of benign ovarian tissue specimens (n=35). There was a barely detectable staining in benign and mucinous cancers (Fig. 2B). PAFR expression was significantly (p<0.001) higher in clear cell, serous invasive and endometrioid types compared to mucinous and benign ovarian tumors. PAFR expression in non-mucinous malignant ovarian cancers was significantly (p<0.001) higher when compared to the benign counterparts (Fig.2D).
PAF-induced ovarian cancer cell proliferation is PAFR-dependant
To determine the biological function of PAFR on ovarian cancer cell growth, the PAFR-negative normal (HOSE-E6E7) cell line and mucinous cell line (RMUG-L), and two PAFR-positive serous type of ovarian cancer cell lines (OVCA429/OVCA432) were selected for the proliferation assay. PAF and a natural antagonist ginkgolide B were exogenously administered to the cultured cells under serum-free conditions. After 72 hours incubation with different concentrations of PAF, both PAFR-negative normal HOSE and mucinous RMUG-L cells showed no significant response (Fig. 3AB). Cell proliferation was significantly increased by PAF treatment (10 nM) in OVCA429 and OVCA432 cells (Fig.3CD). In addition, PAF-induced cell proliferation in these cancer cells was almost completely inhibited by the administration of 100 μM ginkgolide B and 1:50 dilution of PAFR antibody, compared to the treatment with PAF alone, or PAF plus IgG control.
Figure 3.
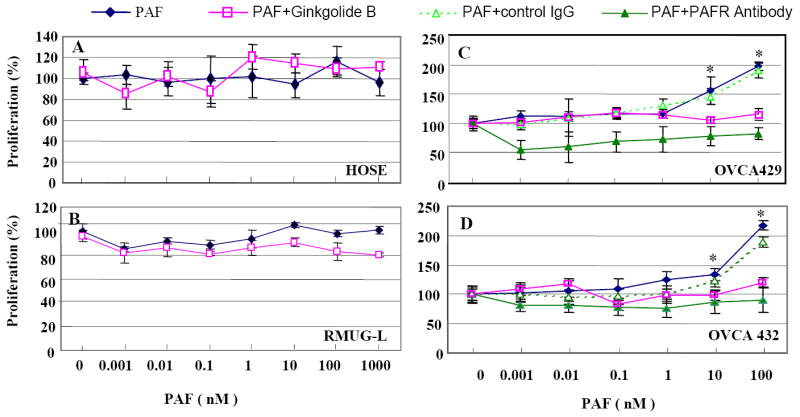
Ovarian cancer cell proliferation response to PAF treatment is PAFR-dependent. A. Normal HOSE cells (without PAFR expression) showed no response with different concentrations of PAF treatment. Treatment of PAF with ginkgolide B showed no-response in HOSE cell proliferation. B. Mucinous type ovarian cancer cells RMUG-L (negative PAFR expression) showed no response to PAF treatment in cell proliferation and a little effect on cell proliferation when treated together with 100 μM ginkgolide B. C-D. Ovarian cancer cell lines OVCA429 and OVCA432 showed a strong and dose-dependent response to PAF treatment and significantly increases in cell proliferation. Both PAFR antagonist, ginkgolide B ( ) and specific antibody against PAFR (▲) have significantly blocked the PAF-induced cell proliferation, compared with treatment of PAF alone (◆) or PAF with IgG control (Δ) (p<0.001).
PAFR gene knockdown and cell proliferation
To confirm that up-regulated PAFR significantly contributes to cancer cell proliferation, we conducted a functional analysis by reducing PAFR expression via siRNA interference in OVCA429 cells. Three specific siRNA probes significantly reduced PAFR gene expression more than 90% compared to the negative control probe (Fig. 4A). Using immune blot analysis, we found that the siRNA-probe treated cells significantly decreased PAFR protein expression (Fig. 4B). Furthermore, we also found that transient PAFR gene-knockdown significantly decreased cell proliferation up to 60% (p<0.001), compared to the cancer cells treated with the negative siRNA probe (Fig. 4C).
Figure 4.
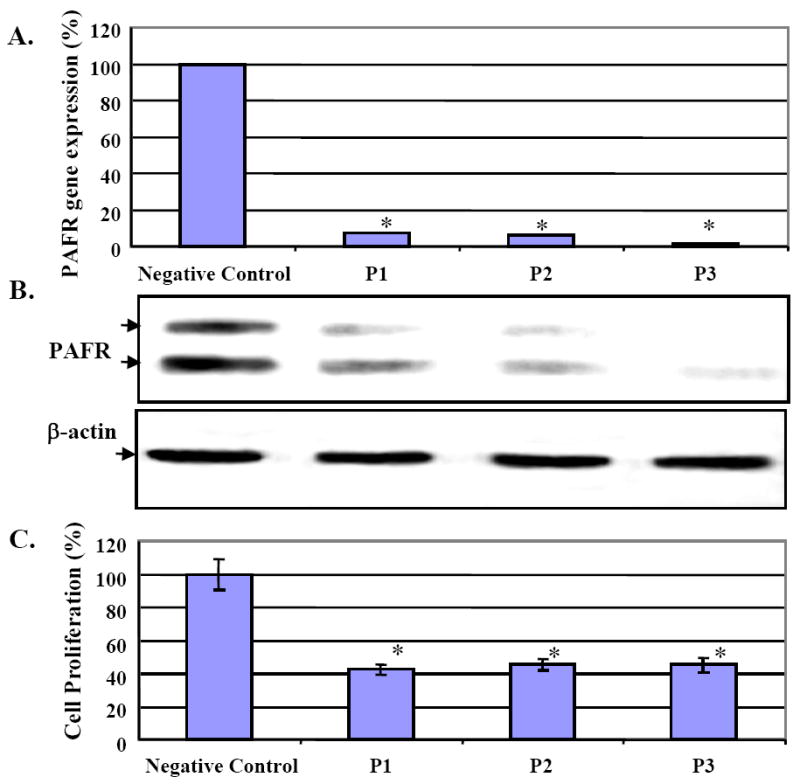
siRNA induced PAFR gene knockdown and decreased cell proliferation in OVCA429 ovarian cancer cells. A. OVCA429 cells were treated with three siRNA probes and showed near complete deletion of PAFR gene expression compared to the negative control probe. B. After siRNA induced PAFR gene knockdown, PAFR protein expression was depleted in the treated OVCA429 cancer cells, compared with the negative control. C. OVCA429 cells with siRNA treatment showed significant decreases in cell proliferation up to 60% (*: p<0.0001).
PAF-PAFR activated protein phosphorylation pattern in ovarian cancer cells
To further investigate the possible molecular mechanisms associated with the regulatory functions of PAF-PAFR in ovarian cancer, we examined a set of phosphorylation signals of the cancer-associated protein targets with their site-specific phospho-antibodies. OVCA429 cells were treated with PAFR agonist PAF alone or with PAF plus the antagonist ginkgolide B, respectively at different time points. Site-specific phosphorylation intensity of eight protein targets simultaneously increased after 100 nM PAF treatment compared to the controls, and reached the plateau after 24 hours of treatment (Fig. 5). At 4 hours PAF treatment, tyrosine phospho-activation of protein targets (EGFR, FAK, Src) was significantly increased 2-fold, and 1.8-fold at 6 hours for EGFR, FAK, Src, Paxillin and AKT. Furthermore, it appeared that only EGFR, Src, FAK and Paxillin showed the maximum blockage or inhibition of the phosphorylation by ginkgolide B treatment at 4 and 6 hours (Fig.5A). Coordinated phosphorylation of EGFR, Src, FAK and Paxillin by PAF was further validated by western blot analysis on both OVCA429 and OVCA432 cells (Fig.5BC). Phosphorylation of these proteins, however, was not observed in RMUG-L cancer cells, as expected, based on its negative PAFR expression (Fig. 5D).
Figure 5.
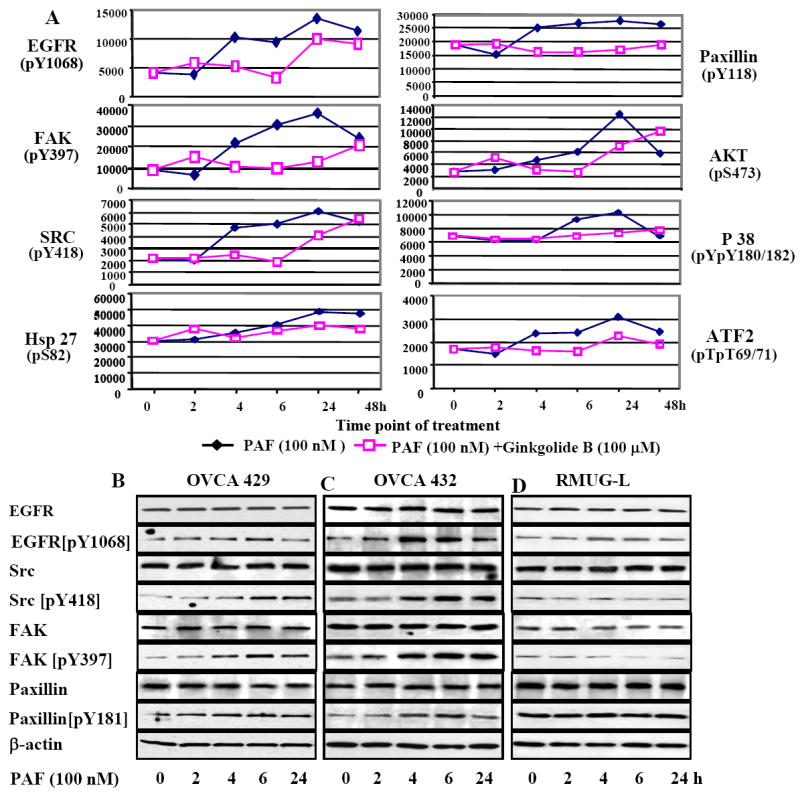
PAF-PAFR pathways associated with multiple protein targets and signal pathways. A. Profiling and quantitative analysis of eight phospho-proteins using multiplex of Mercator™ phosphor-array (Biosource, Invitrogen Inc.). OVCA429 cells were cultured in the serum-free medium. At 50%-70% confluence, cells were treated with PAF and ginkgolide B dissolved in DMSO. Cell lysates of the untreated (0 hr), treated with PAF (100nM) (◆) alone or combination of PAF (100 nM) & Ginkgolide B (100 μM) (□) at different time points, were subjected to Mercator phosphor-array analysis. All measurements were performed in triplicates and showed high signal uniformity and reproducibility (standard errors were not able to shown). B. Western blots revealed the protein phosphorylation pattern of EGFR, Src, FAK and paxillin after treatment with PAF (100nM) in OVCA429, OCVA432 and RMUG-L cells, respectively, at different time points. Equal loading of protein was calibrated with the β-actin. EGFR protein was not detectable in RMUG-L cells using the EGFR (pY1068) antibody, and a fragment of phospho-EGFR (64 kDa) was shown in Fig. 5D.
PAF-induced ovarian cancer cell proliferation and invasion are mediated by PAFR and tyrosine phosphorylation EGFR, Src, FAK, Paxillin
After 6 hours treatment of PAF (100nM) on OVCA429 cells, the phospho-signals of EGFR (pY1068), Src (pY418), FAK (pY397) and Paxillin (pY118) were increased in western blot and consistent with the data in phospho-antibody array (Fig. 5AB). However, when cells were treated with ginkgolide B plus PAF, EGFR was less affected. Phosphorylation signals of Src, FAK and Paxillin were decreased and reversed back to the constitutive level (Fig. 6A). The specific Src inhibitor PP2 showed the expected strong inhibition on Src and as well as on FAK, but had less effect on EGFR and Paxillin. The nonspecific inhibitor A25 showed medium inhibition on all these targets, except for EGFR where a strong inhibitory effect was observed. Combined treatment of PP2 and A25 showed similar inhibition pattern as PP2 alone. After 24 hours treatment with PAF, the downstream protein targets PI3K and cyclin D1 associated with cell proliferation, MMP2/MMP9 associated with cancer cell invasion, were significantly increased. The increased protein expression was decreased when treated with PAF and ginkgolide B and the inhibitors (Fig. 6A). To define how PAF-PAFR and tyrosine phosphorylation of EGFR and Src are involved in ovarian cancer proliferation, we measured the inhibitory effects of ginkgolide B, EGFR and Src inhibitors (erlotinib and PP2 respectively) on OVCA429 and OVCA432 cell proliferation. After 72h treatment with PAF (100 nM), cell proliferation rate was increased up to 2-fold in both cell lines. The specific PAFR antagonist ginkgolide B (100 μM) and the PAFR polyclonal antibody showed significant and similar intensity of inhibition, compared to the IgG controls (Fig.6BC). Specific Src inhibitor PP2 either used alone or combined with A25 was the strongest inhibitor in cell proliferation, compared to the non-specific inhibitor A25. Interestingly, the PI3K inhibitor LY294002 showed a similar effect on cell proliferation compared to PP2. The EGFR inhibitor (erlotinib) was less potent, but still significant in cell proliferation inhibition compared to the non-specific inhibitor A25. Similarly, PAF-induced ovarian cancer cell invasion was also investigated in OVCA429 and OVCA 432 cell lines. We demonstrated that blocking PAFR by using ginkgolide B and specific antibody significantly (p<001) reduced the cancer cell invasion, which was induced by PAF treatment (Fig.6DE). Not surprisingly, PP2 and Src inhibitor has shown a stronger inhibitory effect on OVCA429 cell invasion, compared to the nonspecific tyrosine kinase inhibitor A25.
Figure 6.

PAF-PAFR and Src pathways in ovarian cancer cell proliferation and invasion. A. After 6h treatment with PAF (100 nM) alone (lane 2) and combination of PAF with ginkgolide B (100 μM, lane 3), tyrosine-Src kinase inhibitors PP2 (10 μM, lane 4) and A25 (10 μM, lane 5) and combined PP2+A25, protein phosphorylation pattern of EGFR, Src, FAK and Paxillin of OVCA429 cells was revealed by using the same set of specific antibodies in Fig. 5. Phosphorylation of c-met protein not related to PAF-PAFR was used as non-specific control. After 24 h treatment, OVCA429 cells were harvested for protein expression analysis of PI3K, cyclin D1, MMP2 and MMP9 by western blots. B-C. PAF induced ovarian cancer cell proliferation in OVCA429 and OVCA432 cells. After 72h treatment with ginkgolide B, PAFR specific antibody, inhibitors of PP2, A25, PP2+A25, LY294002 (10 μM) and erlotinib (5 μM) inhibit the PAF-induced cell proliferation in both cancer cell lines (p<0.001). D-E. PAF activated ovarian cancer cell invasion in OVCA429 and OVCA432 cells were significantly (p<0.001) and completely blocked by ginkgolide B, PAFR antibody and PP2 treatment within 36 hours. Mean values with standard deviation for cell proliferation and invasion were derived from at least eight repeats for proliferation, five repeats for invasion from two experiments. A Polyclonal antibody against PAFR (0.5 mg/mL) was diluted 1:50 in serum-free medium and calibrated with equal volume of non-specific pure IgG as negative control.
Discussion
PAF is a well-known potent phospholipid mediator involved in diverse physiological regulations such as cell proliferation, invasion, anti-apoptosis, differentiation and oncogenic transformation (17, 18). PAF is involved in the metastatic spread of melanoma (34) and functions through MMP and cAMP-response element binding protein (19). Intra-peritoneal injection of PAF promoted lung cancer metastasis (35). Inactivation of PAF by over-expression of PAF acetylhydrolase strongly inhibited the tumor growth and vascularization of B16F10 murine melanomas and Kaposi sarcomas (36). However, the regulatory functions of PAF receptor and its associated signaling pathways have not been characterized in human cancer. Here, we demonstrated that over expression of PAFR gene (10 to 10000-fold) was found in 8 of 11 (73%) non-mucinous types of ovarian cancer cell lines and 57 of 76 (75%) non-mucinous types of ovarian tissue specimens (Fig. 1). We also found that PAFR protein was over expressed in ovarian cancer cell lines and cancer patients, but varied across different histological types (Fig. 2). Over expression of PAFR was often found in non-mucinous types of ovarian cancer cells. It is not clear why the mucinous ovarian tumor expressed significantly lower level of PAFR. Surrounding carbohydrates may significantly block the active biological factors such as PAF and TNF-α from entering the mucinous tumor cells to stimulate PAFR gene expression(37, 38), which only partially explains the decreased level of PAFR expression in mucinous ovarian tumor patients.
Both PAF and PAFR significantly promoted cancer cell proliferation and invasion (39, 40). Our data showed that only the PAFR-positive cells respond to PAF and stimulate cancer cell growth and invasion (Figs.3, 6), while no effect was found in the PAFR-negative cells such as immortalized HOSE cells, mucinous cancer cells and PAFR-knockdown cells (Fig. 3, 4). This suggests that PAF-induced ovarian cancer cell proliferation is dependent on PAFR expression. Yet, it is still unclear how PAF interacts with its receptor PAFR and stimulates the biological signal networking during the process of cancer transformation and progression. Here we explored multiple signaling targets using the fluorescent phospho-array of 8-plex Mercator™ technology to simultaneously quantify EGFR [pY1068], p38 [pTpY180/182], Akt/PKB [pS473], FAK [pY397], Src [pY418], Paxillin [pY118], HSP27 [pS82] and ATF2 [pTpT69/71], as the most common phosphorylation of protein targets associated with cancer. Interestingly, all eight molecular targets were activated by PAF treatment and inactivated by ginkgolide B treatment (Fig.5A). Previous study suggested that phospholipid-mediated protein phosphorylation cascades are often important early responses to mitogenic induction (41). For example, PAFR activated MAP kinase and induced epidermal cell proliferation via EGFR (25) and PAF induced activation of tyrosine phosphorylation of FAK and Paxillin in human endothelial cells (24). Here we provide additional evidence that PAF simultaneously induced multiple protein phosphorylation including EGFR, Src, FAK and Paxillin and the activation is dependent on PAFR gene expression in ovarian cancer cells.
PAF-PAFR mediated stimulation of downstream phosphorylation of multiple proteins was reported in other non-cancerous types of cells such as neutrophils (42), eosinophils (43) and involved many types of protein kinases including mitogen-activated protein kinase (MAPK), protein kinase C (PKC), phosphatidylinositol 3-kinase (PI3K), protein tyrosine kinase and G-protein receptor kinase (21). However, it is still not clear how the downstream targets and the signal cascades are associated with PAF-PAFR stimulation in cancer cells. In this study, we found that specific Src inhibitor PP2 showed the strongest inhibition on protein phosphorylation, cell proliferation and invasion among the tested inhibitors (Fig. 6BC), suggesting that Src is a key downstream target of PAFR in ovarian cancer. The similar inhibition intensity on cell proliferation induced by PI3K-α inhibitor (LY294002) and Src inhibitor (PP2) in OVCA432 and OVCA429 may suggest that Src is the upstream target of PI3K in ovarian cancer as shown in many other cancers (44). Ginkgolide B blocked PAF-PAFR induced EGFR phosphorylation (Fig.5A) and EGFR inhibitor erlotinib showed significant inhibition on cell proliferation, but less potent than Src inhibitor PP2, in OVCA429 and OVCA432. This would suggest that Src is the primary downstream target of PAFR (PAFR-Src), but not PAFR-EGFR, to be involved in PAF-mediated cell proliferation. Although the PI3K phosphorylation was not included in the array platform and our western blots, we found that PI3K protein expression (α-subunit) was significantly inhibited by ginkgolide B, antagonist of PAFR, and PI3K inhibitor had strong inhibition on cell proliferation as PP2 (Fig. 6BC). Further studies are required to confirm the regulatory signal pathways of PAFR-Src and PI3K in PAF-mediated ovarian cancer cell proliferation. In this study, we measured the protein expression of PI3K and cyclin D1 as markers for cell proliferation and MMP2/MMP9 for call invasion to confirm these cellular functions were induced by PAF and reversibly inhibited by PAFR antagonist ginkgolide B, PAFR antibody and Src inhibitor PP2. In addition, the specific Src inhibitor PP2 strongly and almost equally inhibited phosphorylation of both Src and FAK, which might demonstrate as evidence of activation of protein-protein interaction between these two protein kinases in ovarian cancer, which was often found in many other cancers (45).
Our study demonstrated direct evidence that PAF-PAFR is commonly activated in non-mucinous ovarian cancer cells. Phospholipids mediator PAF can activate PAFR and initiate multiple downstream signal pathways, specifically through Src/FAK and the downstream targets such as PI3K, in cancer cell proliferation and MMP2/MMP9 in cancer invasion. We believe that further studies are warranted for the understanding of the precise mechanisms and the downstream signal networking pathways regulated by PAF-PAFR, which might include Src, FAK, EGFR, Paxillin, PI3K/AKT and MAPK pathways during the ovarian cancer progression.
Acknowledgments
We thank Dr. Ross S. Berkowitz for his encouragement and Dr. Michael J. Birrer for providing us the ovarian cancer tissue arrays to support this project.
Grant Support: This research is supported by R21 (CA111949-01) from the National Cancer Institute, Dana-Farber Starr Foundation, ovarian cancer case-control study R01 (CA054419-13) and ovarian cancer SPORE (1P50-CA105009-01).
References
- 1.Zhu T, Gobeil F, Vazquez-Tello A, et al. Intracrine signaling through lipid mediators and their cognate nuclear G-protein-coupled receptors: a paradigm based on PGE2, PAF, and LPA1 receptors. Can J Physiol Pharmacol. 2006;84:377–91. doi: 10.1139/y05-147. [DOI] [PubMed] [Google Scholar]
- 2.Stafforini DM, McIntyre TM, Zimmerman GA, Prescott SM. Platelet-activating factor, a pleiotrophic mediator of physiological and pathological processes. Crit Rev Clin Lab Sci. 2003;40:643–72. doi: 10.1080/714037693. [DOI] [PubMed] [Google Scholar]
- 3.Boccellino M, Camussi G, Giovane A, et al. Platelet-activating factor regulates cadherin-catenin adhesion system expression and beta-catenin phosphorylation during Kaposi’s sarcoma cell motility. Am J Pathol. 2005;166:1515–22. doi: 10.1016/s0002-9440(10)62367-x. [DOI] [PMC free article] [PubMed] [Google Scholar]
- 4.Hikiji H, Ishii S, Shindou H, Takato T, Shimizu T. Absence of platelet-activating factor receptor protects mice from osteoporosis following ovariectomy. J Clin Invest. 2004;114:85–93. doi: 10.1172/JCI20504. [DOI] [PMC free article] [PubMed] [Google Scholar]
- 5.Prescott SM, Zimmerman GA, Stafforini DM, McIntyre TM. Platelet-activating factor and related lipid mediators. Annu Rev Biochem. 2000;69:419–45. doi: 10.1146/annurev.biochem.69.1.419. [DOI] [PubMed] [Google Scholar]
- 6.Eisinger AL, Prescott SM, Jones DA, Stafforini DM. The role of cyclooxygenase-2 and prostaglandins in colon cancer. Prostaglandins Other Lipid Mediat. 2007;82:147–54. doi: 10.1016/j.prostaglandins.2006.05.026. [DOI] [PubMed] [Google Scholar]
- 7.Sheng H, Shao J, Washington MK, DuBois RN. Prostaglandin E2 increases growth and motility of colorectal carcinoma cells. J Biol Chem. 2001;276:18075–81. doi: 10.1074/jbc.M009689200. [DOI] [PubMed] [Google Scholar]
- 8.Tsujii M, DuBois RN. Alterations in cellular adhesion and apoptosis in epithelial cells overexpressing prostaglandin endoperoxide synthase 2. Cell. 1995;83:493–501. doi: 10.1016/0092-8674(95)90127-2. [DOI] [PubMed] [Google Scholar]
- 9.Mills GB, Moolenaar WH. The emerging role of lysophosphatidic acid in cancer. Nat Rev Cancer. 2003;3:582–91. doi: 10.1038/nrc1143. [DOI] [PubMed] [Google Scholar]
- 10.Symowicz J, Adley BP, Woo MM, et al. Cyclooxygenase-2 functions as a downstream mediator of lysophosphatidic acid to promote aggressive behavior in ovarian carcinoma cells. Cancer Res. 2005;65:2234–42. doi: 10.1158/0008.5472.CAN-04-2781. [DOI] [PubMed] [Google Scholar]
- 11.Ulrich CM, Bigler J, Potter JD. Non-steroidal anti-inflammatory drugs for cancer prevention: promise, perils and pharmacogenetics. Nat Rev Cancer. 2006;6:130–40. doi: 10.1038/nrc1801. [DOI] [PubMed] [Google Scholar]
- 12.Boucharaba A, Serre CM, Gres S, et al. Platelet-derived lysophosphatidic acid supports the progression of osteolytic bone metastases in breast cancer. J Clin Invest. 2004;114:1714–25. doi: 10.1172/JCI22123. [DOI] [PMC free article] [PubMed] [Google Scholar]
- 13.Walterscheid JP, Ullrich SE, Nghiem DX. Platelet-activating factor, a molecular sensor for cellular damage, activates systemic immune suppression. J Exp Med. 2002;195:171–9. doi: 10.1084/jem.20011450. [DOI] [PMC free article] [PubMed] [Google Scholar]
- 14.Albini A, Sporn MB. The tumour microenvironment as a target for chemoprevention. Nat Rev Cancer. 2007;7:139–47. doi: 10.1038/nrc2067. [DOI] [PubMed] [Google Scholar]
- 15.Liebmann C. G protein-coupled receptors and their signaling pathways: classical therapeutical targets susceptible to novel therapeutic concepts. Curr Pharm Des. 2004;10:1937–58. doi: 10.2174/1381612043384367. [DOI] [PubMed] [Google Scholar]
- 16.Dorsam RT, Gutkind JS. G-protein-coupled receptors and cancer. Nat Rev Cancer. 2007;7:79–94. doi: 10.1038/nrc2069. [DOI] [PubMed] [Google Scholar]
- 17.Kume K, Shimizu T. Platelet-activating factor (PAF) induces growth stimulation, inhibition, and suppression of oncogenic transformation in NRK cells overexpressing the PAF receptor. J Biol Chem. 1997;272:22898–904. doi: 10.1074/jbc.272.36.22898. [DOI] [PubMed] [Google Scholar]
- 18.Heon Seo K, Ko HM, Kim HA, et al. Platelet-activating factor induces up-regulation of antiapoptotic factors in a melanoma cell line through nuclear factor-kappaB activation. Cancer Res. 2006;66:4681–6. doi: 10.1158/0008-5472.CAN-05-3186. [DOI] [PubMed] [Google Scholar]
- 19.Melnikova VO, Mourad-Zeidan AA, Lev DC, Bar-Eli M. Platelet-activating factor mediates MMP-2 expression and activation via phosphorylation of cAMP-response element-binding protein and contributes to melanoma metastasis. J Biol Chem. 2006;281:2911–22. doi: 10.1074/jbc.M508683200. [DOI] [PubMed] [Google Scholar]
- 20.Denizot Y, Descottes B, Truffinet V, et al. Platelet-activating factor and liver metastasis of colorectal cancer. Int J Cancer. 2005;113:503–5. doi: 10.1002/ijc.20585. [DOI] [PubMed] [Google Scholar]
- 21.Ishii S, Shimizu T. Platelet-activating factor (PAF) receptor and genetically engineered PAF receptor mutant mice. Prog Lipid Res. 2000;39:41–82. doi: 10.1016/s0163-7827(99)00016-8. [DOI] [PubMed] [Google Scholar]
- 22.Lukashova V, Asselin C, Krolewski JJ, Rola-Pleszczynski M, Stankova J. G-protein-independent activation of Tyk2 by the platelet-activating factor receptor. J Biol Chem. 2001;276:24113–21. doi: 10.1074/jbc.M100720200. [DOI] [PubMed] [Google Scholar]
- 23.Deo DD, Axelrad TW, Robert EG, et al. Phosphorylation of STAT-3 in response to basic fibroblast growth factor occurs through a mechanism involving platelet-activating factor, JAK-2, and Src in human umbilical vein endothelial cells. Evidence for a dual kinase mechanism. J Biol Chem. 2002;277:21237–45. doi: 10.1074/jbc.M110955200. [DOI] [PubMed] [Google Scholar]
- 24.Soldi R, Sanavio F, Aglietta M, et al. Platelet-activating factor (PAF) induces the early tyrosine phosphorylation of focal adhesion kinase (p125FAK) in human endothelial cells. Oncogene. 1996;13:515–25. [PubMed] [Google Scholar]
- 25.Marques SA, Dy LC, Southall MD, et al. The platelet-activating factor receptor activates the extracellular signal-regulated kinase mitogen-activated protein kinase and induces proliferation of epidermal cells through an epidermal growth factor-receptor-dependent pathway. J Pharmacol Exp Ther. 2002;300:1026–35. doi: 10.1124/jpet.300.3.1026. [DOI] [PubMed] [Google Scholar]
- 26.Fang X, Schummer M, Mao M, et al. Lysophosphatidic acid is a bioactive mediator in ovarian cancer. Biochim Biophys Acta. 2002;1582:257–64. doi: 10.1016/s1388-1981(02)00179-8. [DOI] [PubMed] [Google Scholar]
- 27.Gupta GP, Massague J. Platelets and metastasis revisited: a novel fatty link. J Clin Invest. 2004;114:1691–3. doi: 10.1172/JCI23823. [DOI] [PMC free article] [PubMed] [Google Scholar]
- 28.Ye B, Aponte M, Dai Y, et al. Ginkgo biloba and ovarian cancer prevention: Epidemiological and biological evidence. Cancer Lett. 2007;251:43–52. doi: 10.1016/j.canlet.2006.10.025. [DOI] [PubMed] [Google Scholar]
- 29.Tsao SW, Mok SC, Fey EG, et al. Characterization of human ovarian surface epithelial cells immortalized by human papilloma viral oncogenes (HPV-E6E7 ORFs) Exp Cell Res. 1995;218:499–507. doi: 10.1006/excr.1995.1184. [DOI] [PubMed] [Google Scholar]
- 30.Mosmann T. Rapid colorimetric assay for cellular growth and survival: application to proliferation and cytotoxicity assays. J Immunol Methods. 1983;65:55–63. doi: 10.1016/0022-1759(83)90303-4. [DOI] [PubMed] [Google Scholar]
- 31.Tsuda H, Ito YM, Ohashi Y, et al. Identification of overexpression and amplification of ABCF2 in clear cell ovarian adenocarcinomas by cDNA microarray analyses. Clin Cancer Res. 2005;11:6880–8. doi: 10.1158/1078-0432.CCR-05-0751. [DOI] [PubMed] [Google Scholar]
- 32.Livak KJ, Schmittgen TD. Analysis of relative gene expression data using real-time quantitative PCR and the 2(-Delta Delta C(T)) Method. Methods. 2001;25:402–8. doi: 10.1006/meth.2001.1262. [DOI] [PubMed] [Google Scholar]
- 33.Garcia Rodriguez C, Cundell DR, Tuomanen EI, et al. The role of N-glycosylation for functional expression of the human platelet-activating factor receptor. Glycosylation is required for efficient membrane trafficking. J Biol Chem. 1995;270:25178–84. doi: 10.1074/jbc.270.42.25178. [DOI] [PubMed] [Google Scholar]
- 34.Melnikova V, Bar-Eli M. Inflammation and melanoma growth and metastasis: the role of platelet-activating factor (PAF) and its receptor. Cancer Metastasis Rev. 2007;26:359–71. doi: 10.1007/s10555-007-9092-9. [DOI] [PubMed] [Google Scholar]
- 35.Im SY, Ko HM, Kim JW, et al. Augmentation of tumor metastasis by platelet-activating factor. Cancer Res. 1996;56:2662–5. [PubMed] [Google Scholar]
- 36.Biancone L, Cantaluppi V, Del Sorbo L, et al. Platelet-activating factor inactivation by local expression of platelet-activating factor acetyl-hydrolase modifies tumor vascularization and growth. Clin Cancer Res. 2003;9:4214–20. [PubMed] [Google Scholar]
- 37.Mutoh H, Ishii S, Izumi T, Kato S, Shimizu T. Platelet-activating factor (PAF) positively auto-regulates the expression of human PAF receptor transcript 1 (leukocyte-type) through NF-kappa B. Biochem Biophys Res Commun. 1994;205:1137–42. doi: 10.1006/bbrc.1994.2784. [DOI] [PubMed] [Google Scholar]
- 38.Dagenais P, Thivierge M, Parent JL, Stankova J, Rola-Pleszczynski M. Augmented expression of platelet-activating factor receptor gene by TNF-alpha through transcriptional activation in human monocytes. J Leukoc Biol. 1997;61:106–12. doi: 10.1002/jlb.61.1.106. [DOI] [PubMed] [Google Scholar]
- 39.Bussolati B, Biancone L, Cassoni P, et al. PAF produced by human breast cancer cells promotes migration and proliferation of tumor cells and neo-angiogenesis. Am J Pathol. 2000;157:1713–25. doi: 10.1016/S0002-9440(10)64808-0. [DOI] [PMC free article] [PubMed] [Google Scholar]
- 40.Cellai C, Laurenzana A, Vannucchi AM, et al. Growth inhibition and differentiation of human breast cancer cells by the PAFR antagonist WEB-2086. Br J Cancer. 2006;94:1637–42. doi: 10.1038/sj.bjc.6603156. [DOI] [PMC free article] [PubMed] [Google Scholar]
- 41.Rozengurt E. Mitogenic signaling pathways induced by G protein-coupled receptors. J Cell Physiol. 2007;213:589–602. doi: 10.1002/jcp.21246. [DOI] [PubMed] [Google Scholar]
- 42.Mollapour E, Linch DC, Roberts PJ. Activation and priming of neutrophil nicotinamide adenine dinucleotide phosphate oxidase and phospholipase A(2) are dissociated by inhibitors of the kinases p42(ERK2) and p38(SAPK) and by methyl arachidonyl fluorophosphonate, the dual inhibitor of cytosolic and calcium-independent phospholipase A(2) Blood. 2001;97:2469–77. doi: 10.1182/blood.v97.8.2469. [DOI] [PubMed] [Google Scholar]
- 43.Sotsios Y, Ward SG. Phosphoinositide 3-kinase: a key biochemical signal for cell migration in response to chemokines. Immunol Rev. 2000;177:217–35. doi: 10.1034/j.1600-065x.2000.17712.x. [DOI] [PubMed] [Google Scholar]
- 44.Tanaka Y, Kobayashi H, Suzuki M, Kanayama N, Terao T. Transforming growth factor-beta1-dependent urokinase up-regulation and promotion of invasion are involved in Src-MAPK-dependent signaling in human ovarian cancer cells. J Biol Chem. 2004;279:8567–76. doi: 10.1074/jbc.M309131200. [DOI] [PubMed] [Google Scholar]
- 45.McLean GW, Carragher NO, Avizienyte E, et al. The role of focal-adhesion kinase in cancer - a new therapeutic opportunity. Nat Rev Cancer. 2005;5:505–15. doi: 10.1038/nrc1647. [DOI] [PubMed] [Google Scholar]