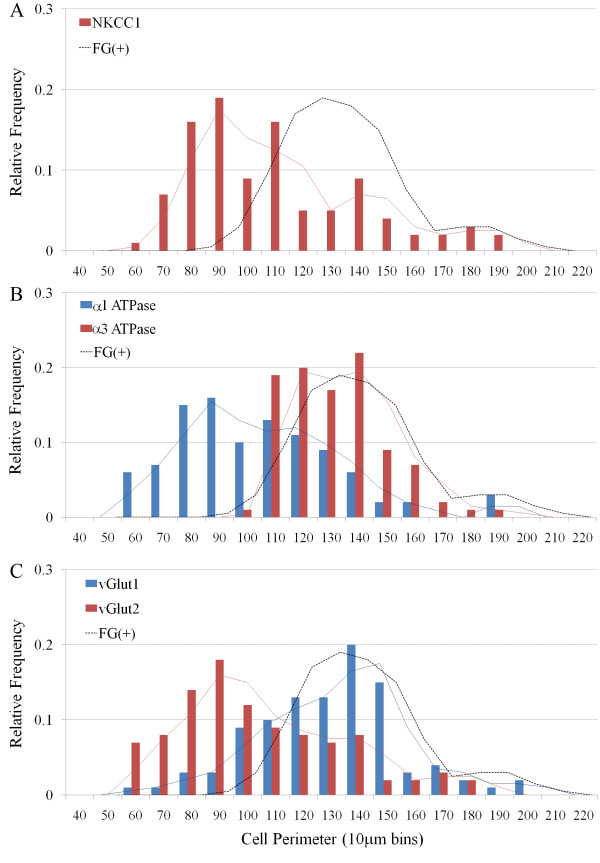
Figure 4.
Histograms showing the size distribution of all nodose neurons (irrespective of fluorogold tracing) that express (A) NKCC1, (B) α1 Na+/K+ ATPase or α3 Na+/K+ ATPase, and (C) vGlut1 or vGlut2. The superimposed solid lines show the moving averages associated with each histogram and the dashed line references the size distribution of fluorogold (FG) traced neurons shown in figure 2.

