Abstract
Spatial orientation depends critically on the brain's ability to segregate linear acceleration signals arising from otolith afferents into estimates of self-motion and orientation relative to gravity. In the absence of visual information, this ability is known to deteriorate at low frequencies. The cerebellar nodulus/uvula (NU) has been shown to participate in this computation, although its exact role remains unclear. Here, we show that NU simple spike (SS) responses also exhibit a frequency dependent selectivity to self-motion (translation) and spatial orientation (tilt). At 0.5 Hz, Purkinje cells encode three-dimensional translation and only weakly modulate during pitch and roll tilt (0.4 ± 0.05 spikes/s/°/s). But this ability to selectively signal translation over tilt is compromised at lower frequencies, such that at 0.05 Hz tilt response gains average 2.0 ± 0.3 spikes/s/°/s. We show that such frequency-dependent properties are attributable to an incomplete cancellation of otolith-driven SS responses during tilt by a canal-driven signal coding angular position with a sensitivity of 3.9 ± 0.3 spikes/s/°. This incomplete cancellation is brought about because otolith-driven SS responses are also partially integrated, thus encoding combinations of linear velocity and acceleration. These results are consistent with the notion that NU SS modulation represents an internal neural representation of similar frequency dependencies seen in behavior.
Keywords: cerebellum, vestibular, Purkinje cell, vermis, linear acceleration, rotation, tilt-translation, simple spikes, vestibulo-cerebellum
Introduction
The nodulus and uvula (NU), the two most posterior lobules of the cerebellar vermis, constitute an important component of the vestibulo-cerebellum. They receive >70% of vestibular primary afferents (including otolith organs and semicircular canals), which terminate ipsilaterally as mossy fibers (Carpenter et al., 1972; Korte and Mugnaini, 1979; Kevetter and Perachio, 1986; Gerrits et al., 1989; Barmack et al., 1993; Newlands et al., 2002, 2003; Maklad and Fritzsch, 2003; Kevetter et al., 2004). Additional vestibular information arrives as mossy fibers from the vestibular nuclei (VN) and as climbing fibers from the contralateral inferior olive (β-nucleus and dorsomedial cell column) (Brodal, 1976; Bigaré and Voogd, 1977; Groenewegen and Voogd, 1977; Hoddevik and Brodal, 1977; Groenewegen et al., 1979; Brodal and Brodal, 1985; Bernard, 1987; Sato et al., 1989; Epema et al., 1990; Akaogi et al., 1994; Barmack, 1996; Kaufman et al., 1996; Ono et al., 2000; Ruigrok, 2003).
The functional role of the NU has remained elusive. Because NU lesions result in balance problems and eliminate the ability of the velocity storage network to align with gravity (Angelaki and Hess, 1995; Wearne et al., 1998), its function has been globally linked to spatial orientation. Previous studies in anesthetized animals showed that NU Purkinje cells respond during earth-horizontal axis rotations (e.g., pitch and roll), likely reflecting vertical canal and otolith system activation (Marini et al., 1975, 1976; Precht et al., 1976; Fushiki and Barmack, 1997; Barmack and Yakhnitsa, 2002, 2003; Yakhnitsa and Barmack, 2006). But these studies only examined neuronal responses during rotation and static tilt. Using combinations of rotation and translation stimuli in alert macaque monkeys, Yakusheva et al. (2007) have recently verified that NU Purkinje cells indeed receive convergent inputs from the otolith organs and the semicircular canals. However, they concluded that this convergence is used to compute translation.
Results in alert macaque monkeys appear at odds with those in anesthetized animals (Barmack and Shojaku, 1995; Fushiki and Barmack, 1997; Barmack and Yakhnitsa, 2002, 2003; Yakhnitsa and Barmack, 2006). To solve this puzzle and further address the functional properties of the NU, here we have characterized simple spike (SS) responses during three-dimensional stimuli that span a range of frequencies. We show that the NU output selectively encodes three-dimensional translation, although in a frequency-dependent manner. At frequencies of 0.16 Hz and below, canal-driven angular position signals appear insufficient to cancel out the partially integrated otolith drive during tilt movements relative to gravity. Thus, SS firing rates during tilt increase at low frequencies, such that they become gradually unselective for translation and likely respond to net linear acceleration.
Materials and Methods
Recordings and setup
Single-unit recordings were obtained from the nodulus and uvula (vermal lobules 10 and 9) of one juvenile fascicularis monkeys (Maccaca fascicularis) and two rhesus monkey (Maccaca mulatta). In a sterile surgical procedure, a circular delrin ring was chronically implanted to restrain and stabilize the head during experiments. Stainless-steel inverted T-bolts and dental acrylic were used to hold and attach the implant to the skull. Each animal was also chronically implanted with scleral search coils to measure eye movements during fixation and pursuit tasks. In addition, for single-unit recordings, a delrin platform was stereotaxically secured inside the head ring such that staggered arrays of holes (spaced 0.8 mm apart) covered the lobules 9 and 10 of the cerebellum bilaterally. To provide better coverage of the NU close to the midline, in two of the animals the platform was slanted in the horizontal plane by 10° from anterior to posterior and 10° from left to right. The experiments and surgical operations were conducted according to the National Institutes of Health Guidelines and were approved by the Animal Care and Use Committee at Washington University.
We used two recording setups, called here “sled” and “motion platform.” Most experiments were performed in the sled system in which animals were seated upright in a primate chair that was secured rigidly inside a vestibular turntable consisting of a three-axis rotator mounted on top of a 2 m linear sled (Acutronics). The monkey was placed such that the horizontal stereotaxic plane was aligned with the gravitational horizontal and all three rotational axes (yaw, pitch, and roll) were lined up with the center of the head. This system could provide pitch and roll rotations about an earth-horizontal axis, yaw rotations about an earth-vertical axis, and translational motion along any direction in the horizontal plane. The motion platform system was used to test a subpopulation of NU Purkinje cells during three-dimensional translation using a motion platform (Moog 6DOF2000E; Moog). Linear accelerations were monitored using a three-dimensional linear accelerometer (NeuwGhent Technology) mounted close to the animal's head. The eye-coil output, as well as linear acceleration and rotation signals were filtered (200 Hz; six pole Bessel) and digitized at a rate of 833.33 Hz (model 1401; CED; 16 bit resolution; Cambridge Electronics Design).
Extracellular single-unit activity was recorded from Purkinje cells using epoxy-coated tungsten microelectrodes (4–6 MΩ impedance; FHC). A 26 gauge guide tube was used to advance a microelectrode into the brain through the predrilled hole, while the depth of the electrode was controlled by a hydraulic microdrive. Action potentials were amplified, filtered (300 Hz to 6 kHz) and discriminated using an oscilloscope window-slope trigger (BAK window discriminator). Times of occurrence of action potentials and behavioral events were recorded with 1 ms resolution using the event channel of the 1401 and analyzed off-line by Spike 2 software (Cambridge Electronics Design). Raw signals from the electrodes were also digitized at 25 kHz and stored to disk for off-line spike sorting.
The location of cerebellar lobules 9 and 10 was determined based on knowledge of stereotaxic coordinates as well as the location of the abducens nucleus, VN, and fastigial nucleus (FN) in each animal. In one of the animals, recording location has been verified histologically (Yakusheva et al., 2007). To ensure that recordings were made from the Purkinje cell layer, we searched for complex spikes (CSs), identified based on their characteristic waveforms: positive, long-duration, 2–5 ms, multipeaked action potentials, as opposed to the short-duration, 0.75–1.25 ms, typically, single-peaked simple spikes. We only recorded from the Purkinje cell layer in which clear CSs could be identified either simultaneously as the SSs or just before the particular SS was isolated. For more than one-half of our recordings, a CS was simultaneously recorded and off-line analysis verified a characteristic ∼15 ms silencing of CS-triggered SS histograms.
For the experiments in the sled, our search stimulus consisted of combinations of 0.5 Hz translations and rotations about the cardinal axes (lateral and fore–aft for translation; yaw, pitch, and roll for rotation). We only recorded from a cell when there was an audible modulation during either lateral/fore–aft translation or yaw/pitch/roll tilt. Thus, we cannot describe the percentage of responsive cells, although two observations were striking: First, all responsive cells modulated during horizontal plane translation. Second, there were no cells that lacked a modulation during translation but responded during yaw/pitch/roll rotation. In short, we never encountered any Purkinje cell that was only responsive during rotation. For the experiments in the motion platform we recorded from all SSs isolated in the Purkinje cell layer (i.e., we did not prescreen our neurons before recording). This allowed us to calculate a percentage of cells responding to each cardinal direction during translation (vertical, lateral, fore–aft). Nearly all Purkinje cells (74 of 77) modulated significantly during at least one translation direction (see Results).
Experimental protocol
We recorded SS responses in complete darkness during the following experimental protocols.
Translational motion (activating exclusively otolith afferents).
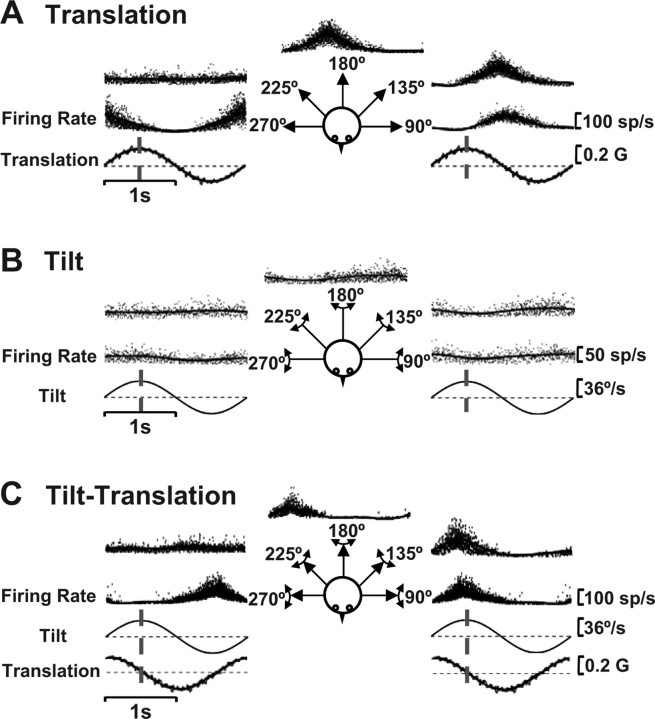
All cells were first tested during 0.5 Hz sinusoidal motion (±20 cm, corresponding to 0.2 G peak acceleration). Motion directions were typically lateral and fore–aft, but several cells were also tested during in between directions (see Fig. 1A). A few cells were also tested during lateral and fore–aft translation at different frequencies: 0.16 Hz (±95.6 cm; 0.1 G), 0.3 Hz (±27.5 cm; 0.1 G), 1 Hz (±5 cm; 0.2 G), 2 Hz (±1.9 cm; 0.3 G), and 5 Hz (±0.2 cm; 0.3 G). For each frequency, we used the maximum stimulus amplitude that could be physically delivered.
Figure 1.
SS responses of a typical NU Purkinje cell during translation (otolith afferent activation alone) (A), tilt (activation of both otolith and semicircular canal afferents) (B), and tilt-translation (semicircular canal activation alone) (C), for different motion directions (see diagram insets). Notice how small the cell modulation is during 0.5 Hz tilt (earth-horizontal axis rotation), compared with 0.5 Hz translation and tilt-translation. Also, the otolith-driven (A) and canal-driven (C) responses are of similar spatial tuning, both peaking at the 45° stimulus direction and having minimal modulation at the 135° stimulus direction. The vertical dashed lines illustrate the stimulus timing relative to which response phase was calculated: peak acceleration (translation) or peak angular velocity (tilt and tilt-translation).
Earth-horizontal axis rotations (e.g., pitch/roll, activating both otolith and vertical semicircular canals simultaneously).
Here we also refer to these stimuli as “tilt.” The majority of cells were tested at 0.5 Hz (±11.3°). For a subpopulation of cells, tilt responses were also recorded at different frequencies: 1 Hz (±5°), 0.25 Hz (±22.6°), 0.1 Hz (±30°), 0.05 Hz (±30°), and 0.02 Hz (±30°). Here, the goal was to keep angular position constant (±30°), although this was impossible at higher frequencies because of the acceleration limits of the turntable. Cells were typically tested during pitch and roll tilt, although a few neurons were also tested at 45 and 135° orientations (see Fig. 1B).
Combinations of translation and tilt (“tilt-translation,” activating exclusively vertical semicircular canal afferents).
During combined tilt-translation stimuli, net linear acceleration in the horizontal plane was zero, thus resulting in no sinusoidal modulation of otolith afferents (Angelaki et al., 2004). This latter stimulus was used to isolate and characterize the properties of the vertical semicircular canal contribution to Purkinje cell firing (Angelaki et al., 2004; Yakusheva et al., 2007). Data were first recorded at 0.5 Hz (11.3° and 20 cm). Subsequently cell responses were also tested at two additional frequencies: 0.16 Hz (5.7° and 95.6 cm) and 1 Hz (5° and 2.16 cm). Note that this was the largest frequency and amplitude range that the equipment would allow (at high frequencies, constraints were attributable to the acceleration limits of the tilt axis; at low frequencies, constraints were posed by the length of the sled). As a result, canal-driven responses could not be characterized <0.16 Hz. SS responses during tilt-translation were obtained along several directions in the horizontal plane, including 0° (corresponding to fore–aft motion and pitch tilt), 90° (corresponding to lateral motion and roll tilt), as well as 45 and 135° orientations that are closely aligned with the left anterior/right posterior or right anterior/left posterior canal axes (see Fig. 1C).
Yaw rotations.
Yaw rotations (activating exclusively horizontal semicircular canal afferents) were delivered first at 0.5 Hz (31.4°/s; ±10°) and, if cell isolation was maintained, at 0.1 Hz (31.4°/s; ±50°), 0.25 Hz (31.4°/s; ±20°), and 1 Hz (31.4°/s; ±5°). Here, the goal was to maintain angular velocity constant across frequency. Because lesions of the NU result in changes in velocity storage (Angelaki and Hess, 1995; Wearne et al., 1998), Purkinje cells were also tested during constant velocity yaw rotation (30°/s; acceleration, 100°/s2).
Translation in three dimensions.
Finally, to complete the 0.5 Hz characterization of cells during translation in three dimensions (the Acutronics sled system can only translate animals in the horizontal plane), a subpopulation of cells was also tested with 0.5 Hz translation (±10 cm; 0.1 G) along the three cardinal directions: lateral, fore–aft, and vertical.
Data analysis
All data were analyzed off-line using Matlab (Mathworks). Instantaneous firing rate (IFR) was calculated as the inverse of interspike interval. Then data from multiple cycles were folded into a single IFR cycle. To compute the neural gain and phase during translation/rotation, a sine function (first and second harmonics and DC offset) was fitted to both response and stimulus using a nonlinear least-squares algorithm (Levenberg–Marquardt method). Neuronal gain for translation was first expressed relative to linear acceleration (in units of spikes/second per G where G = 9.81 m/s2), whereas for rotations and for combined stimuli (tilt-translation) gain was first expressed relative to head velocity (in units of spikes/second per degrees/second). Phase for translation was computed as the differences (in degrees) between peak neural activity and peak head acceleration or velocity.
The neural gain and phase during translation, tilt and their combination (tilt-translation) measured for at least two different directions (0 and 90°) were fitted by a two-dimensional spatiotemporal model (Angelaki, 1991, 1992; Schor and Angelaki, 1992). This model represents a generalization to cosine-tuning, in which neurons are allowed to have not just one, but two response axes. As a result, gain does not exhibit a rectified cosine-tuning and phase depends on stimulus direction. The larger the second axis, the strongest the departure from cosine-tuning and the greatest the dependence of response phase on stimulus direction. This model has been shown to characterize best the tuning of neurons in the fastigial and vestibular nuclei (Angelaki and Dickman, 2000; Shaikh et al., 2005a). Based on this analysis, four parameters for each cell were computed: maximum response gain and phase, the preferred (maximum response) direction, and tuning ratio (ratio of minimum over maximum neural response gain). To characterize the response dynamics of SS responses, we plotted neuronal gain (i.e., ratio of response amplitude over rotational position, velocity or linear acceleration) and phase as a function of frequency. For translation response dynamics, we used gain and phase along the preferred (maximum response) direction, as computed from the spatiotemporal model fits. For tilt and tilt-translation response dynamics [in which fewer cells were tested during at least two motion directions (e.g., pitch and roll)], we used gain and phase along either one axis (pitch or roll), whichever produced the largest modulation.
To assign a statistical significance to the response modulation for each neuron, we also computed average binned histograms (40 bins per cycle) and a “Fourier ratio (FR),” defined as the ratio of the fundamental over the maximum of the first 20 harmonics. The statistical significance of FR was then based on a permutation analysis. Briefly, the 40 response bins were shuffled randomly, thus destroying the systematic modulation in the data but maintaining the inherent variability of the responses. The FR was then computed from those randomly permuted histograms, and the randomization process was repeated 1000 times. If the FR for the original data exceeded that for 99% of the permuted data sets, we considered the temporal modulation to be statistically significant (p < 0.01). For constant-velocity yaw rotation, the firing rate was partitioned into bins of fixed (200 ms) size. We then computed an average firing rate over 5 s time intervals during the beginning and end of the perrotatory/postrotatory response.
Results
We recorded simple spike (SS) responses from 249 Purkinje cells. Based on anatomical reconstruction (Yakusheva et al., 2007), most cells were located in the cerebellar nodulus (folium 10) and ventral uvula (folium 9c, d), with only a few Purkinje cells recorded from the dorsal uvula. Because there were no notable differences between the SS responses of Purkinje cells in the nodulus, ventral uvula, and dorsal uvula, we collectively refer to them as NU cells.
SS responses were characterized during rotations and translations in three dimensions and for a range of frequencies. Stimuli included translation, yaw (i.e., rotations about an earth-vertical axis, such that animals' orientation relative to gravity does not change), and pitch/roll (i.e., rotations about an earth-horizontal axis that change head orientation relative to gravity). For the majority of cells (n = 172), translation stimuli were limited to the horizontal plane, although for one-third of the neurons (n = 77) responses were also tested during vertical motion. In addition, we also used combinations of earth-horizontal axis rotation (referred to here as “tilt”) and horizontal plane translation (Angelaki et al., 1999, 2004). For the latter stimuli (referred to here as “tilt-translation”), the linear acceleration during translation cancels the horizontal plane gravitational acceleration component that is generated because of the rotation relative to gravity (see Materials and Methods) (Angelaki et al., 1999, 2004; Yakusheva et al., 2007). As a result, tilt (e.g., pitch and roll) activates both semicircular canal and otolith afferents, but tilt-translation stimuli activate semicircular canal afferents exclusively. Note that this sample also includes a few cells whose 0.5 Hz responses to translation, tilt, and tilt-translation have been described previously (Yakusheva et al., 2007). These data have been included in a few summary figures here for completeness.
Representative examples of SS modulation from a typical NU Purkinje cell during 0.5 Hz translation, tilt, and tilt-translation along different directions (see diagram drawing) are shown in Figure 1. The most conspicuous observation is how little the cell modulated during tilt, compared with translation (Fig. 1, compare A, B). Because the relative amplitudes of translation and tilt were such as to elicit an identical linear acceleration in the horizontal plane (see Materials and Methods), the two stimuli activated otolith afferents similarly (Fernández and Goldberg, 1976; Dickman et al., 1991; Si et al., 1997; Angelaki et al., 2004). Yet, the tilt (i.e., earth-horizontal axis rotation) stimulus also activates vertical semicircular canal afferents. Thus, as previously shown by Yakusheva et al. (2007), the difference in firing rates between translation and tilt demonstrates that: (1) SS responses are driven by both otolith and semicircular canal signals and (2) the otolith and canal contributions to the response of this cell are temporally and spatially matched, such that they cancel out and little SS modulation is seen during tilt (Fig. 1B). Importantly, the canal contribution to SS responses can be revealed during tilt-translation, a stimulus that combines the two movements (Fig. 1C).
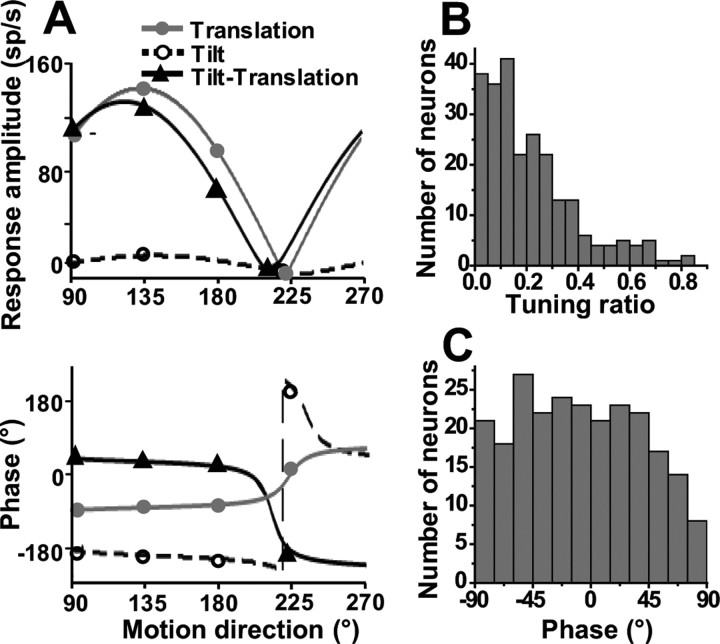
The matching between translation and tilt-translation responses is further illustrated for this neuron in Figure 2A, which plots peak response amplitude and phase as a function of stimulus direction. Response tuning was quantified using a spatiotemporal model (Angelaki, 1991; Angelaki and Dickman, 2000) that allows estimation of four parameters: preferred (i.e., maximum response) direction, amplitude and phase, as well as tuning ratio (defined as the ratio of the minimum over the maximum response amplitude). Rather than focusing on the spatiotemporal matching between otolith-driven and canal-driven responses (Yakusheva et al., 2007), here we focus on the spatial and temporal properties of each response component separately. In particular, our goal is to first explore the precise nature and properties of SS modulation during each one of the three stimuli: translation, tilt, and tilt-translation. Only then do we return to the issue of their interaction, which, unlike in the study by Yakusheva et al. (2007), has been now explored at different frequencies. First, we describe the population properties in response to each of the translation, tilt, and tilt-translation stimuli.
Figure 2.
SS response properties during translation in the horizontal plane. A, Peak response amplitude (top) and phase (bottom) of the cell of Figure 1 during translation (otolith activation alone; gray circles/solid lines), tilt (activation of both otolith and semicircular canals; open circles/dashed lines), and tilt-translation (semicircular canal activation alone; black triangles/solid lines), plotted versus motion direction. Phase is expressed relative to linear acceleration (translation) or angular velocity (tilt and tilt-translation). Notice that translation and tilt-translation responses are aligned not only spatially but also temporally: translation phase lags linear acceleration by ∼90°, illustrating responses in phase with velocity (tilt-translation phase slightly leads velocity). B, Distribution of tuning ratio (0.5 Hz; n = 243). C, Distribution of response phase along the preferred direction in the horizontal plane (0.5 Hz; n = 243).
SS responses during translation
One-half of Purkinje cells whose responses were studied during translation along different directions in the horizontal plane (Fig. 1A) were cosine-tuned, with 137 of 243 (56%) of the neurons having tuning ratios <0.2. In addition, approximately one-quarter had clear spatiotemporal response characteristics, with 58 of 243 (24%) having tuning ratios >0.3, as illustrated in Figure 2B. The phase of SS responses during 0.5 Hz translation was broadly distributed between −90 and +90°, with some neurons modulating in phase with head velocity and some in phase with acceleration (Fig. 2C). Both of these properties are similar to those of translation-sensitive neurons in the FN (Shaikh et al., 2005a) and VN (Angelaki and Dickman, 2000; Dickman and Angelaki, 2002), but different from primary otolith afferents (Fernández and Goldberg, 1976; Angelaki and Dickman, 2000).
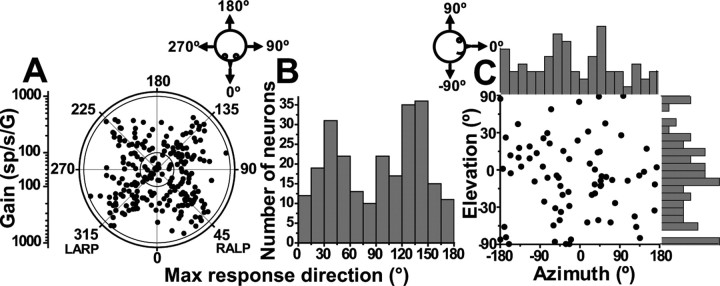
Unlike VN (Angelaki and Dickman, 2000; Dickman and Angelaki, 2002) and FN (Shaikh et al., 2005a) neurons, however, the distribution of preferred directions in the horizontal plane was not uniform (Fig. 3A). Instead, SS preferred directions appear to cluster around the oblique axes. To further illustrate this point, Figure 3B shows the corresponding distribution histogram in the range of [0, 180°] (i.e., data have been folded about the 0–180° axis in Fig. 3A). The distribution of preferred directions was significantly bimodal (p ≪ 0.001, uniformity test; puni = 0.001 and pbi = 0.98, modality test), clustering around 45 or 135° (Fig. 3B). In general, SS translation gains were large (Table 1), often approaching 1000 sp/s/G (Fig. 3A) (radial axis, mean ± SE, 305 ± 13 sp/s/G; range, 31–1104 sp/s/G).
Figure 3.
Spatial organization of SS responses during translation (0.5 Hz). A, Polar plot, in which the radius corresponds to response gain (in units of spikes/second per G) and the polar angle illustrates the preferred (i.e., maximum response) direction in the horizontal plane (azimuth). Each circle corresponds to one NU cell with significant response modulation along at least one direction (n = 243). B, Same data, now plotted as the distribution of preferred directions in the range [0, 180°]. C, Distributions of translation preferred directions for n = 74 of 77 NU Purkinje cells that had significant modulation (p < 0.01) (see Materials and Methods) along at least one of the vertical, lateral, and fore–aft motion directions when tested in three dimensions. Each data point in the scatter plot corresponds to the preferred azimuth (abscissa) and elevation (ordinate) of a single neuron. The data are plotted on Cartesian axes that represent the Lambert cylindrical equal-area projection of the spherical stimulus space. Histograms along the top and right sides of each scatter plot show the marginal distributions.
Table 1.
Mean (±SE) gain of NU Purkinje cells during vestibular stimulation
| Stimulus | Lateral motion/roll tilt | Fore–aft motion/pitch tilt | Up–down motion/yaw |
|---|---|---|---|
| Translation, 0.5 Hz (sp/s/G) | 274 ± 15 (243) | 284 ± 14 (243) | 210 ± 15 (77) |
| Tilt, 0.5 Hz (sp/s/°/s) | 0.3 ± 0.028 (84) | 0.3 ± 0.025 (114) | |
| Tilt, 0.05 Hz (sp/s/°/s) | 1.5 ± 0.2 (26) | 1.4 ± 0.2 (27) | |
| Tilt-translation, 0.5 Hz (sp/s/°/s) | 1.0 ± 0.12 (62) | 1.1 ± 0.1 (78) | |
| Yaw, 0.5 Hz (sp/s/°/s) | 0.21 ± 0.02 (99) |
n values are given in parentheses.
For a subpopulation of NU Purkinje cells, we used a motion platform (see Materials and Methods) to translate animals not only along the lateral and fore–aft axis, but also along the vertical axis (up–down). We found that preferred directions extended into vertical planes. For cells with significant modulation along at least one direction (74 of 77; p < 0.01) (see Materials and Methods), we computed the three-dimensional preferred direction (using the same spatiotemporal model) (Angelaki et al., 1992). The corresponding azimuth and elevation of the preferred direction for each cell have been plotted both as a scatter plot and as marginal distributions in Figure 3C. Notably, the majority of cells responded during more than a single cardinal axis; for example, only a few (3 of 74) SS responses showed significant modulation during vertical but not during horizontal plane (i.e., lateral and fore–aft) translation. For elevation, the distribution of preferred directions was not significantly different from uniform (p = 0.132, uniformity test).
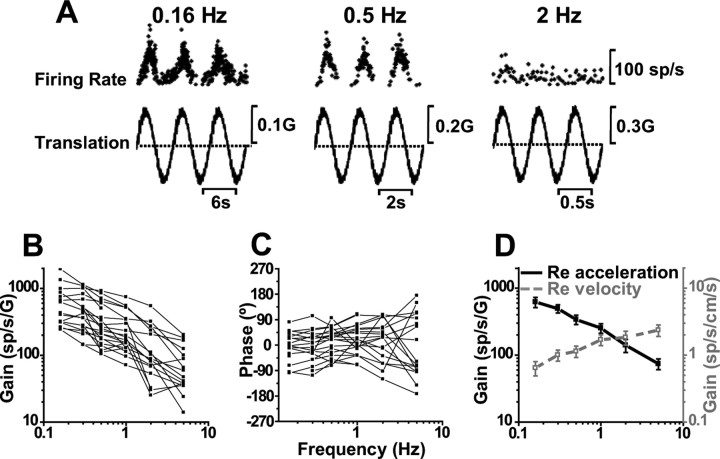
This strong modulation of all Purkinje cells during 0.5 Hz translation persisted at lower frequencies, but sharply declined at higher frequencies. Representative responses from a typical Purkinje cell during lateral motion are shown in Figure 4A. Modulation depth decreased with frequency, such that at 2 Hz there was hardly any visible response (Fig. 4A). To summarize this finding, we computed response dynamics along the preferred direction (using the spatiotemporal model) and expressed neuronal gain and phase (of the preferred direction) relative to linear acceleration (Fig. 4B,C). The decrease in gain was statistically significant (ANCOVA, F(5,101) = 9.7, p < 0.001), having a slope of −0.67 [with 95% confidence interval (CI) = [−0.82, −0.54]; r = −0.73; p < 0.001]. Response phase varied among neurons (Fig. 2C), but remained relatively independent of frequency (ANCOVA, F(5,101) = 0.35, p = 0.87; note that variability is large at high frequencies because of the lower response gains) (Fig. 4B,C).
Figure 4.
SS dynamics during translation. A, Sinusoidal responses of a typical Purkinje cell during lateral motion at 0.16, 0.5, and 2 Hz. B, C, Shown is the frequency dependence of response gain and phase (expressed relative to linear acceleration) for n = 22 cells. D, Average neural response gain plotted versus frequency, in which gain is computed either relative to linear acceleration (filled symbols; black solid line) or relative to linear velocity (open symbols; gray dashed line).
The fact that acceleration gains were not independent of frequency indicates that SSs do not encode linear acceleration. To further appreciate these dynamics, Figure 4D plots mean (±SE) gain and phase, computed in two different ways [i.e., relative to linear acceleration (filled circles, black solid line) and relative to linear velocity (open squares, gray dashed line)]. Unlike the sharp decrease of acceleration gains with frequency, the opposite trend was observed for velocity gains: they increased with frequency (ANCOVA, F(5,101) = 5.2, p < 0.001), with a slope of 0.36 (CI = [0.22, 0.59]; r = 0.49; p < 0.001). This occurred because the decrease of acceleration gain with frequency had a slope less than unity (thus indicating that SSs do not encode a full integral of linear acceleration). Instead, they carry combinations of linear acceleration and linear velocity. These response dynamics are different from those in the VN (Angelaki and Dickman, 2000; Dickman and Angelaki, 2002; Zhou et al., 2006) and FN (Shaikh et al., 2005a), in which a larger mixture of response dynamics was reported.
SS responses during tilt and tilt-translation stimuli
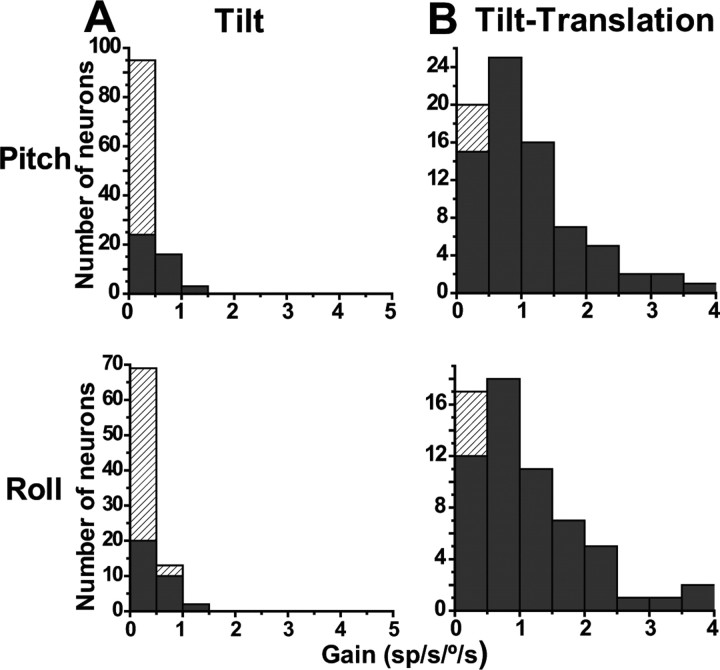
In contrast to robust responses during translation (Table 1), 0.5 Hz tilt response gains were typically low (pitch, mean ± SE, 0.3 ± 0.025 sp/s/°/s; roll, 0.3 ± 0.028 sp/s/°/s). Similarly low was the percentage of cells with significant modulation at 0.5 Hz: 38% (43 of 114) during pitch and 39% (33 of 84) during roll (Fig. 5A, black bars, p < 0.01; hatched bars, p > 0.01). In contrast, SS modulation was strong in response to tilt-translation stimuli (Table 1). Such movements, which are combinations of tilt and translation, selectively activate only semicircular canal, but not otolith, afferents (Angelaki et al., 2004; Shaikh et al., 2005b; Yakusheva et al., 2007). For motion in the pitch plane (i.e., pitch rotation and fore–aft translation), the mean (±SE) gain was 1.1 ± 0.1 sp/s/°/s (range, 0.2–3.9 sp/s/°/s), with 94% (73 of 78) of the cells having significant modulation (Fig. 5B, top). For roll stimuli (i.e., roll rotation and lateral translation), the mean (±SE) gain was 1.0 ± 0.12 sp/s/°/s (range, 0.15–3.9 sp/s/°/s), with 92% (57 of 62) of the cells having significant modulation (Fig. 5B, bottom; black bars, p < 0.01; hatched bars, p > 0.01). Across the population, gains were significantly larger in response to the tilt-translation than tilt stimuli (Wilcoxon's rank test, z117 = 8.6, p ≪ 0.001).
Figure 5.
Distribution of tilt (A) and tilt-translation (B) SS gains (0.5 Hz). Data are shown separately for pitch (top) and roll (bottom) planes. Filled bars, Significant sinusoidal modulation (p < 0.01). Hatched bars, p > 0.01.
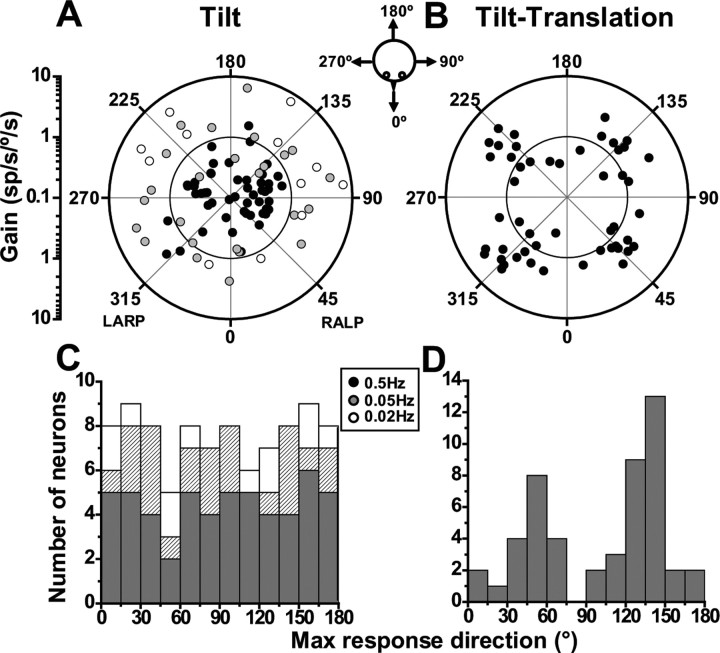
For cells with significant modulation for at least one direction, we used again the spatiotemporal model (Angelaki, 1991, 1992; Schor and Angelaki, 1992) to calculate the preferred (i.e., maximum response) direction and gain for tilt and tilt-translation responses (e.g., using data like those shown in Figs. 1, 2A). The distributions of maximum response directions during tilt and tilt-translation in the horizontal plane are illustrated with filled black circles in Figure 6, A and B, respectively. In these polar plots, the radius illustrates response gain (in units of spikes/second per degrees/second) and the polar angle the preferred direction. For responsive cells, the maximum response gain at 0.5 Hz averaged 0.4 ± 0.05 sp/s°/s for tilt and 1.8 ± 0.15 sp/s/°/s for tilt-translation.
Figure 6.
Spatial organization of SS responses during tilt (0.5, 0.05, and 0.02 Hz) (A, C) and tilt-translation (0.5 Hz) (B, D). A, B, Polar plots, in which the radius corresponds to response gain (in units of spikes/second per degrees/second) and the polar angle illustrates the preferred direction. Each circle corresponds to one NU cell with significant response modulation along at least one direction in the horizontal plane. For all three frequencies, distributions of tilt preferred directions were not different from uniform (uniformity test, puni ≫ 0.05), unlike the preferred directions during tilt-translation and translation (Fig. 3B), which are clearly bimodal and clustered around the semicircular canal axes. C, D, Same data, now plotted as distributions of preferred directions in the range [0, 180°]. Tilt: n = 55 for 0.5 Hz (filled black symbols, black bars), n = 25 for 0.05 Hz (filled gray symbols, hatched bars), and n = 12 for 0.02 Hz (open symbols, open bars); tilt-translation: n = 50.
Like translation (Fig. 3), preferred directions for tilt-translation responses also cluster around the oblique axes (Fig. 6B). The distribution of preferred directions during tilt-translation (plotted in the range of [0 180°]) were significantly different from uniform (p ≪ 0.001, uniformity test). Modality test detected two peaks in the distribution (puni = 0.007 and pbi 0.96, modality test), with response preferences clustering close to 45 or 135° (Fig. 6D). Thus, not only otolith-driven, but also canal-driven components in SS activity are encoded in semicircular canal coordinates. This does not appear to be true for 0.5 Hz tilt responses (uniformity test, puni = 0.77) (Fig. 6C, filled dark histograms), although this lack of clustering might be attributable to increased uncertainty in estimating phase of small responses. Absence of clear clustering of tilt response vectors with canal axes has also been reported in the mouse (Yakhnitsa and Barmack, 2006).
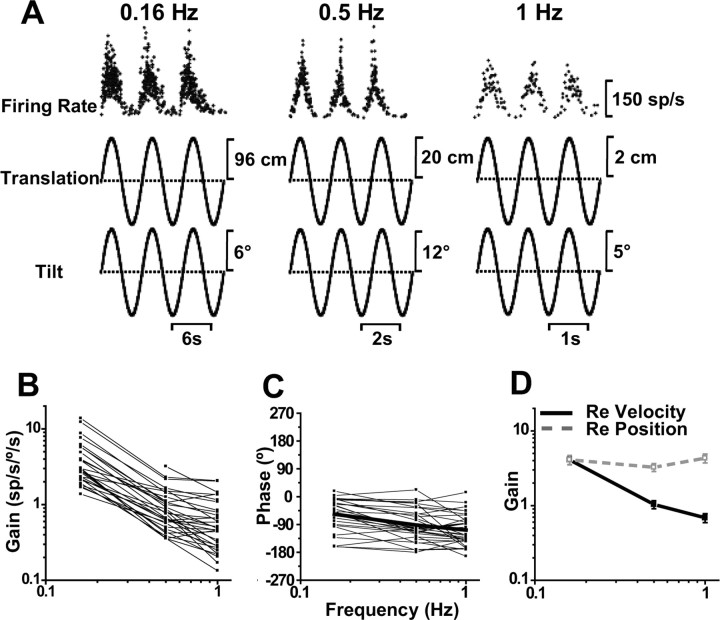
Like translation, SS modulation during tilt-translation decreased with frequency (Fig. 7). This is shown first with a representative example (Fig. 7A) and next with all cell responses (n = 33) (Fig. 7B,C). With gains expressed relative to angular velocity, there was a steep decrease with frequency (ANCOVA, F(2,80) = 21.4, p < 0.001), with a slope of −1 (CI = [−1.2, −0.8.]; r = −0.75; p < 0.0001) (Fig. 7B,D, filled symbols/solid lines). But when expressed relative to angular position, gain became independent of frequency [ANCOVA (2, 80) = 1.5; p = 0.22] (Fig. 7D, open symbols/dashed gray line). Thus, the canal-driven component of SS responses encodes angular position, with a mean sensitivity of 3.9 ± 0.3 spikes/s/° (averaged across all frequencies). This temporal integration of canal-driven signals on Purkinje cell responses is computationally necessary for canceling an otolith-driven linear acceleration signal because for small tilt angles, angular position and linear acceleration are directly proportional to each other (Green and Angelaki, 2003, 2004). Note that the response phase of the canal-driven response varied greatly among neurons (Fig. 7C), as necessary to match a similar variability of the otolith-driven response phase (Figs. 2C, 4C) and to cancel on a cell-by-cell basis the otolith-driven response because of head reorientation relative to gravity (Yakusheva et al., 2007).
Figure 7.
SS dynamics during tilt-translation. A, Sinusoidal responses of a typical Purkinje cell tested during combinations of pitch tilt and fore–aft translation at 0.16, 0.5, and 1 Hz. B, C, Shown is the frequency dependence of response gain and phase (expressed relative to angular velocity), plotted separately for individual neurons (n = 33). D, Average neural response gain plotted versus frequency, in which gain is computed either relative to angular velocity (filled symbols, black solid line) or relative to position (open symbols, gray dashed line).
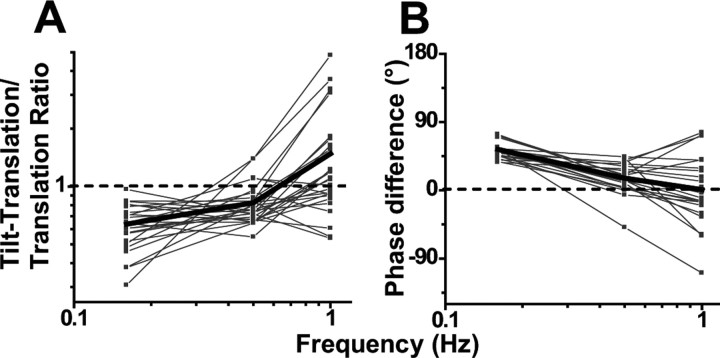
Canal-otolith response cancellation during tilt would indeed work in a frequency-independent manner if the otolith-driven component of Purkinje cell responses encoded linear acceleration. But, as already shown in Figure 4, otolith-driven responses are partially integrated, such that they encode combinations of linear acceleration and linear velocity. These findings raise the obvious question: Is the “matching” between canal-driven and otolith-driven contributions to NU Purkinje cell firing rates dependent on frequency? To cancel each other out during tilt, perfect otolith/canal convergence requires both amplitude and temporal matching across frequencies: Amplitude matching means that the ratio of canal-driven (tilt-translation responses) relative to otolith-driven (translation responses) amplitude should be 1. Temporal matching means that their phase difference [when expressed relative to the same variable (e.g., tilt velocity)] should be 0°.
Figure 8, A and B, shows that, as expected, this is not the case across all frequencies. Because the dynamics of the otolith-driven and canal-driven response components are not temporally matched, the two would not cancel each other during tilt at all frequencies. In fact, there was a significant dependence of both of these measures (ratio of tilt-translation vs translation gain and corresponding phase difference) on frequency (ANCOVA, ratio, F(2,68) = 14, p ≪ 0.001; phase, F(2,68) = 26, p ≪ 0.001). At 0.16 Hz, canal signals were smaller than otolith-driven responses (ratio, <1; t test, t24 = 11, p ≪ 0.001) (Fig. 8A). Similarly, the canal-driven SS responses at 0.16 Hz lead the otolith-driven component by 54 ± 2.4° (t test, t24 = 23, p ≪ 0.001) (Fig. 8B).
Figure 8.
Dependence of the relationship between otolith and canal-driven signals on frequency. A, Ratio of peak response modulation during tilt-translation (canal-driven response) relative to that during translation (otolith-driven response) plotted as a function of frequency. B, Phase difference between the response modulation during tilt-translation and translation plotted as a function of frequency. The thin lines and symbols illustrate data from single neurons (n = 23). The thick lines indicate population average.
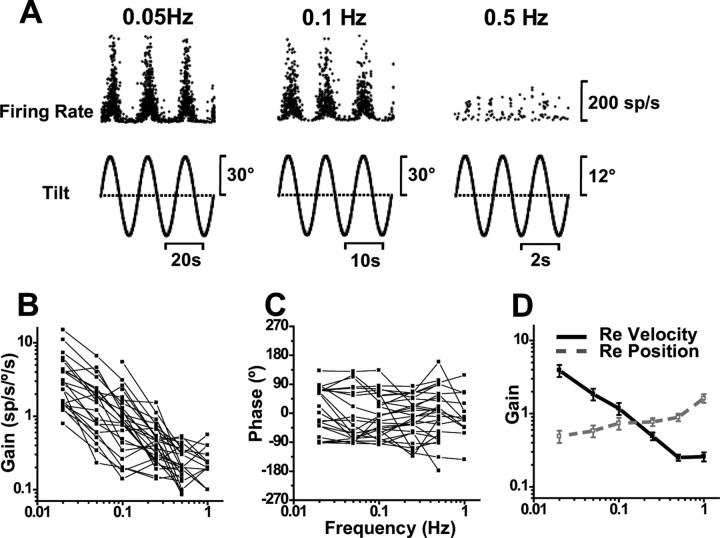
If indeed, as Figure 8 shows, the ability of canal-driven signals to cancel gravity-related otolith information during tilt deteriorates at low frequencies, one would then expect that tilt responses would be stronger at frequencies lower than 0.5 Hz. To address this hypothesis, we tested SS responses during low-frequency roll/pitch rotations (see Materials and Methods). Representative responses are shown in Figure 9A, and population summary in Figure 9, B–D. Tilt responses, which were small at 0.5 Hz (Figs. 1B, 5A), progressively increased at low frequencies. With gains expressed relative to angular velocity, there was a steep decrease with frequency (ANCOVA, F(4,104) = 16, p < 0.001), with a slope of −1.2 (CI = [−0.8, −1.4]; r = −0.98; p < 0.0001) (Fig. 9B,D, filled symbols/solid lines). But, like for tilt-translation, when tilt responses were expressed relative to angular position, gains became independent of frequency (ANCOVA, F(4,104) = 0.85, p = 0.45) (Fig. 9D, open symbols/dashed gray line). Tilt position gains averaged 0.85 ± 0.10 spikes/s/° across frequencies. These values are comparable with what was previously reported in the anesthetized mouse (Yakhnitsa and Barmack, 2006) and rabbit (Barmack and Yakhnitsa, 2003). Like the rabbit and mouse, macaque Purkinje cells were also sensitive to static tilt, although these responses were not quantified here.
Figure 9.
SS dynamics during tilt. A, Sinusoidal responses of a Purkinje cell during pitch tilt at 0.05, 0.1, and 0.5 Hz. B, C, Shown is the frequency dependence of response gain and phase (expressed relative to angular velocity), plotted separately for each cell (n = 27). D, Average neural response gain plotted versus frequency, in which gain is computed either relative to angular velocity (filled symbols, black solid line) or relative to position (open symbols, gray dashed line).
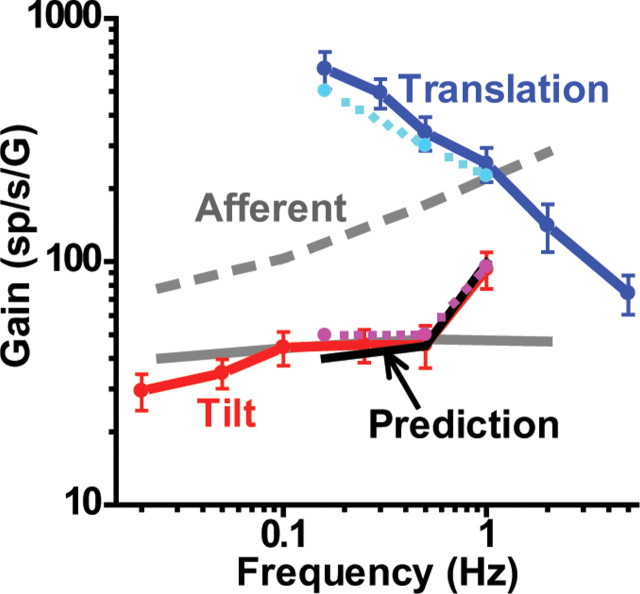
At this point, it is important to directly compare the mean responses to tilt and those to translation throughout the tested frequency range. In Figure 10, we have expressed both gains relative to linear acceleration (Fig. 10, red/magenta and blue/cyan lines, respectively), such that we can directly compare with mean gains from regular and irregular otolith afferents (solid and dashed gray lines, respectively) [data replotted from that of Fernández and Goldberg (1976)]. Several observations are worth noting. First, Purkinje cell responses to translation were large, particularly at lower frequencies, larger than both regular and irregular otolith afferents. Second, tilt gains, which were consistently smaller compared with translation gains across the common range of tested frequencies (0.16–1 Hz), were more comparable in magnitude to those of otolith afferents. Third, when we computed “predicted” tilt gains by vectorially subtracting tilt-translation from translation responses, predictions superimposed on actual tilt data (Fig. 10, black solid line vs red/magenta lines, respectively). Fourth, although translation responses were not tested <0.16 Hz, there was no tendency for gains to decrease as frequency was decreased. Thus, how the two responses are related at lower frequencies is unclear. Notably, tilt gains remained relatively constant (or were even decreased) down to 0.02 Hz. Thus, for the two responses to become equal at low frequencies, translation gains should decline with decreasing frequency <0.16 Hz. Unfortunately, we were not able to test this hypothesis.
Figure 10.
Comparison between response gain during tilt and translation as a function of frequency. Gain has been expressed relative to linear acceleration. Data are shown from two different experiments: those matching translation and tilt (0.16–1 Hz; cyan and magenta dashed lines, respectively) and those testing translation or tilt separately (solid blue and red lines, respectively). The black solid line illustrates the vectorial difference between translation (otolith-driven response) and tilt-translation (canal-driven response) gains (computed from the 0.16–1 Hz data only). The solid and dashed gray lines illustrate the mean gains from regular and irregular otolith afferents [replotted from the study by Fernández and Goldberg (1976)].
SS responses during earth-vertical axis (yaw) rotations
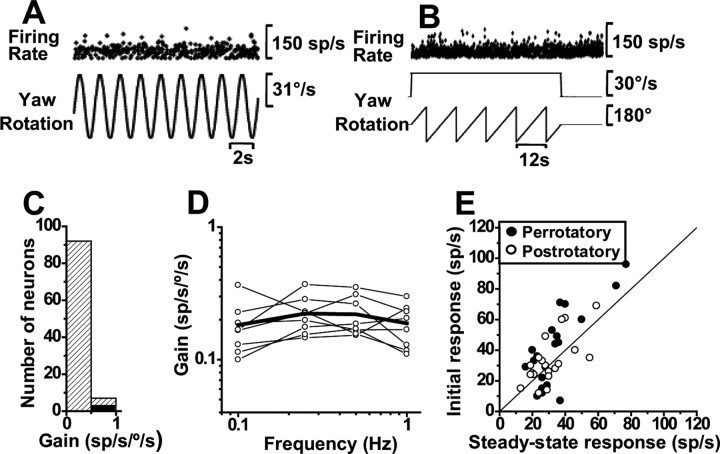
To complete the characterization of NU SSs during motion in three dimensions, we also tested their responses during yaw rotation. Although Yakusheva et al. (2007) showed no yaw modulation during 0.5 Hz, here we tested whether this result is extended to lower and higher frequencies. An example of such a typical unresponsive behavior is illustrated in Figure 11, A and B, for 0.5 Hz sinusoidal and constant velocity yaw rotation, respectively. Of 99 cells tested during 0.5 Hz yaw oscillations, only 3 passed our criterion for significant modulation (see Materials and Methods). Figure 11C shows the distribution of 0.5 Hz gains (mean ± SE, 0.25 ± 0.027 sp/s/°/s), separated for significant (black bar) and nonsignificant (stripped bar) modulations. Yaw response gains for all cells remained <1 sp/s/°/s and modulation continued to be nonsignificant when tested at different frequencies between 0.1 and 1 Hz (Fig. 11D). This lack of modulation during yaw rotations also holds when quantifying perrotatory and postrotatory responses by computing mean firing rate during the first and last 5 s of each period (Fig. 11E). Mean firing rate was identical during the beginning and end of each period (Wilcoxon's rank test, z40 = 1.8, p = 0.08), with the two values being linearly correlated (slope of 1.2; 95% confidence interval, [0.8, 1.4]]; r = 0.77; p ≪ 0.0001). We conclude that, similar to rabbits, monkey NU SS responses were completely unresponsive not only during yaw sinusoidal oscillations but also during constant velocity yaw rotation, a stimulus that activates velocity storage (see Discussion).
Figure 11.
Absence of SS modulation during yaw rotation. A, B, Example firing rate during 0.5 Hz sinusoidal and constant velocity (30°/s) yaw rotations. C, Distribution of yaw gains at 0.5 Hz, shown separately for significant (black bar; n = 3) and nonsignificant (striped bar; n = 96) modulation. D, Yaw response gains at different frequencies of rotation (the open circles indicate nonsignificant modulation). E, Summary of perrotatory and postrotatory responses. Data shown represent mean firing rates computed for each cell during the first and last 5 s of perrotatory (filled circles) and postrotatory (open circles) responses (n = 20 cells).
Discussion
We have shown that (1) SS responses in the macaque NU respond during 0.5 Hz translation in three dimensions, but show no modulation during yaw and only weak modulation during 0.5 Hz tilt. (2) The small responses during tilt result from a semicircular canal-driven signal that was reported to be spatially and temporally matched to the otolith-driven response, such that they cancel each other during rotations that change head orientation relative to gravity (Yakusheva et al., 2007). The present results further demonstrate the following: (3) Such otolith-canal convergence takes place in semicircular canal coordinates, as both the canal (tilt-translation) and otolith (translation) preferred directions cluster around the vertical canal axes (Figs. 3A, 6B). (4) Both otolith and canal responses are temporally integrated, compared with primary afferents. The canal signal integration is necessary to cancel an otolith-driven linear acceleration response during tilt. Indeed, canal-driven responses encode angular position (Fig. 7). Perhaps unexpectedly, however, otolith-driven responses are also partially integrated; they do not encode linear acceleration, but mostly linear velocity (Fig. 4). As a result, the spatiotemporal matching of canal/otolith convergence in the NU reported by Yakusheva et al. (2007) appears bandwidth-limited. Indeed, (5) we found deviations from ideally matched convergence at 0.16 Hz: Integrated canal signals were smaller and more phase-advanced than otolith-driven responses (Fig. 8). As a result, otolith-driven signals attributable to head reorientation relative to gravity might not cancel out during low-frequency tilt. Indeed, tilt velocity gains increased as frequency was decreased (Fig. 9).
These results provide for the first time a clear picture of the output properties of the macaque NU and bridge the gap between the results of Yakusheva et al. (2007) and those in anesthetized nonprimate species (Barmack and Shojaku, 1995; Fushiki and Barmack, 1997; Barmack and Yakhnitsa, 2002, 2003; Yakhnitsa and Barmack, 2006).
Failure of the otolith/canal convergence mechanism to discriminate translation from tilt: SS responses during low-frequency tilt
Multiple studies have proposed that convergence from both semicircular canals and otolith signals is essential to compute inertial motion and orientation relative to gravity (Stockwell and Guedry, 1970; Glasauer, 1995; Glasauer and Merfeld, 1997; Angelaki et al., 1999, 2004; Merfeld and Zupan, 2002; Green and Angelaki, 2003, 2004; Green et al., 2005; Merfeld et al., 2005a,b; Shaikh et al., 2005b; Zhou et al., 2006; Lewis et al., 2008). The mathematical solution requires that canal-driven sensory information must be both spatially and temporally transformed (Green and Angelaki, 2004): spatially, because canal-driven signal should only encode rotational components about an earth-horizontal axis; temporally, because to cancel gravitational acceleration this signal must be temporally integrated such that it encodes tilt position. Yakusheva et al. (2007) found that Purkinje cells carry canal-driven signals that have exactly these properties, and consequently, SS responses reliably encode translation at 0.5 Hz.
However, during low-frequency movements, linear accelerations in the absence of extravestibular cues are typically, and often erroneously (i.e., even when generated by translational motion), interpreted as tilt (Glasauer, 1995; Seidman et al., 1998; Paige and Seidman, 1999; Merfeld et al., 2005a,b; Kaptein and Van Gisbergen, 2006). In fact, these low-frequency motions often result in perceptual illusions (“somatogravic/oculogravic” illusion) (Graybiel, 1952; Clark and Graybiel, 1963, 1966). It is commonly thought that tilt-translation ambiguities are not properly resolved at low frequencies because the semicircular canals cease to provide a veridical estimate of angular velocity. The present results provide a glimpse at potential neural correlates of these behaviors.
The present findings significantly expand those of Yakusheva et al. (2007) by showing that the NU is not only important for appropriately estimating translation at 0.5 Hz, but also that the same neurons might also represent the neural substrate for the failure to correctly separate translation from tilt at low frequencies. The present experiments also explain previous differences in macaques (Yakusheva et al., 2007) and rabbits/mice. Whereas at 0.5 Hz only 39% of SSs modulated significantly during pitch/roll, the percentage increased to 94% at 0.05 Hz. Decreasing SS tilt gains with increasing frequency have also been mentioned in the mouse (Yakhnitsa and Barmack, 2006) and rabbit (Barmack and Yakhnitsa, 2002, 2003). It is possible that the NU uses additional information to compute translation at low frequencies. Visual information is one likely candidate for complementing the unreliable canal signal at low frequencies. Future experiments will test this hypothesis.
Absence of SS modulation during yaw (i.e., earth-vertical axis) rotations
A bizarre result in previous studies was the complete lack of SS modulation during yaw rotation in the mouse and rabbit (Fushiki and Barmack, 1997; Barmack and Yakhnitsa, 2002, 2003; Yakhnitsa and Barmack, 2006). We have verified that macaques also show no yaw modulation (Fig. 11). This has been considered puzzling because there is clear evidence of horizontal canal afferent inputs to the NU (Purcell and Perachio, 2001; Maklad and Fritzsch, 2003; Kevetter et al., 2004). In fact, ∼27% of mossy fibers in the rabbit were modulated by vestibular stimulation in the plane of the horizontal semicircular canal (Barmack and Shojaku, 1995). These observations took a new meaning, however, with the results of Yakusheva et al. (2007) showing that the lack of SS modulation applies to all earth-vertical axis rotations (i.e., yaw when upright, pitch when in ear-down orientation, and roll when in supine position).
This finding is consistent with the hypothesized functional role of canal signals in the NU (i.e., to provide a functional complement to, and cancel, the otolith-driven activation attributable to changes in the orientation of the head relative to gravity). With this framework in mind, of course, there should be no SS modulation during yaw rotation from an upright posture, because these movements do not change head orientation relative to gravity. Yet, why would the NU then receive a horizontal canal signal at all? The answer is simple: Such signal would be extremely valuable in non-upright orientations because yaw rotation would then result in head reorientation relative to gravity (Green and Angelaki, 2004). Similarly, pitch/roll rotations should modulate NU SS responses in upright but not ear-down/supine orientations. The latter has been indeed shown to be true in the macaque NU (Yakusheva et al., 2007).
Functional implications for velocity storage
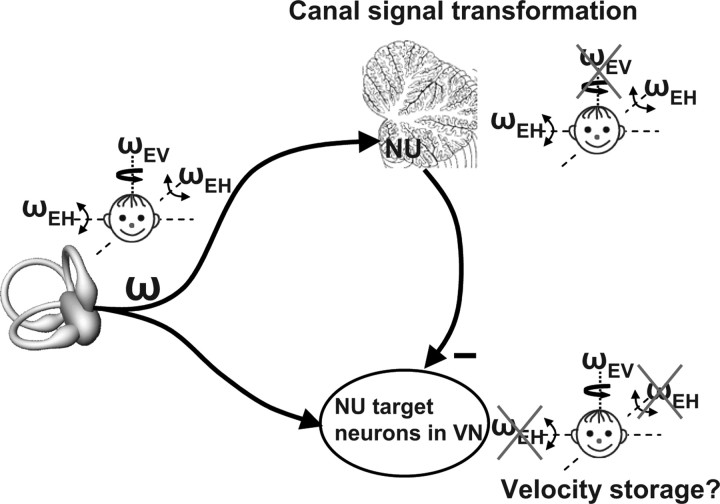
The complete absence of SS modulation during yaw rotations might appear at odds with the deficits of NU inactivation on velocity storage (Angelaki and Hess, 1995; Wearne et al., 1998). For example, NU lesions result in dramatic changes in the horizontal vestibulo-ocular reflex (VOR) time constant (velocity storage) during constant velocity rotations. Yet, the NU output is completely unresponsive under these conditions (Fig. 11B,E). Furthermore, NU lesions destroy the capacity of velocity storage to align with gravity when subjects are suddenly tilted postrotation (Angelaki and Hess, 1994, 1995). Yet, the output of the NU only carries earth-horizontal, rather than earth (gravity)-vertical signals (Yakusheva et al., 2007). Both of these effects can actually be consistent with the proposed function of the NU if we consider the fact that the NU output inhibits VOR pathways, possibly through projections to NU-target neurons in the VN (Fig. 12).
Figure 12.
Schematic illustrating our working hypothesis regarding the relationship between the processing of semicircular canal signals between the afferents, the NU and the VN. Semicircular canal afferents carry head-referenced angular velocity (ω), but the NU encodes only the earth-horizontal component (ωEH). Thus, because of Purkinje cell inhibition, NU-target neurons in the VN should carry the earth-vertical component (ωEV = ω − ωEH). Importantly, because the NU canal-driven responses are temporally integrated, VN responses are predicted to encode earth-vertical canal signals with a longer time constant than canal afferents. This is because, assuming for simplicity an ideal integration, ωEV = ω − ω/s = ω (s − 1)/s, where s is the complex frequency. Indeed, many VN neurons exhibit longer time constants, attributed to velocity storage influence (Reisine and Raphan, 1992). We have proposed that this framework underlies the rationale and functional relevance of what has been previously known as velocity storage (Green and Angelaki, 2003).
In particular, whenever an earth-horizontal rotation signal (ωEH, created in the NU) is subtracted from the net canal activation, what remains is an earth-vertical component of angular velocity (ωEV = ω − ωEH, presumably the signal driving velocity storage). Importantly, because SSs only modulate during low-frequency tilt, high-frequency responses of NU-target neurons would remain head-centered; Only low-frequency responses are expected to reflect an ωEV. Indeed, only the low-frequency components of the VOR have ωEV-like properties (Angelaki et al., 1995). Together, in agreement with experimental findings, this framework predicts that NU lesions would destroy the computation of both ωEH and ωEV. Moreover, because this computation involves a temporal integration, NU lesions should also alter the low-frequency dynamics of the VOR.
In summary, we believe that this temporal integration of gravity-referenced angular velocity necessary for the discrimination of translation and tilt is most likely one and the same with the elusive velocity storage integrator (Green and Angelaki, 2003, 2004). This conjecture could be directly testable should we have been able to measure the time constant of this integration. Because our experimental setup does not allow tilt-translation testing at frequencies <0.16 Hz, this analysis has not been possible. Yet, the fact that we saw no evidence of integration failure between 0.16 and 1 Hz (i.e., gain and phase remains flat throughout this frequency range) (Fig. 7) suggests a corner frequency of <0.05 Hz and an integrator time constant of >4 s. The fact that the NU computes earth-horizontal and earth-vertical components of rotation might also be ultimately linked to head direction cell activity in the limbic system (for review, see Angelaki and Cullen, 2008). The functional significance of earth-vertical rotation signals, computed by combining the output of the NU with net canal activation (Fig. 12), in creating velocity storage-like properties and possibly head direction cell activity remains to be investigated in the future.
Footnotes
This work was supported by National Institutes of Health Grant R01 EY12814.
References
- Akaogi K, Sato Y, Ikarashi K, Kawasaki T. Mossy fiber projections from the brain stem to the nodulus in the cat. An experimental study comparing the nodulus, the uvula and the flocculus. Brain Res. 1994;638:12–20. doi: 10.1016/0006-8993(94)90627-0. [DOI] [PubMed] [Google Scholar]
- Angelaki DE. Dynamic polarization vector of spatially tuned neurons. IEEE Trans Biomed Eng. 1991;38:1053–1060. doi: 10.1109/10.99068. [DOI] [PubMed] [Google Scholar]
- Angelaki DE. Spatio-temporal convergence (STC) in otolith neurons. Biol Cybern. 1992;67:83–96. doi: 10.1007/BF00201805. [DOI] [PubMed] [Google Scholar]
- Angelaki DE, Cullen KE. Vestibular system: the many facets of a multimodal sense. Annu Rev Neurosci. 2008;31:125–150. doi: 10.1146/annurev.neuro.31.060407.125555. [DOI] [PubMed] [Google Scholar]
- Angelaki DE, Dickman JD. Spatiotemporal processing of linear acceleration: primary afferent and central vestibular neuron responses. J Neurophysiol. 2000;84:2113–2132. doi: 10.1152/jn.2000.84.4.2113. [DOI] [PubMed] [Google Scholar]
- Angelaki DE, Hess BJ. The cerebellar nodulus and ventral uvula control the torsional vestibulo-ocular reflex. J Neurophysiol. 1994;72:1443–1447. doi: 10.1152/jn.1994.72.3.1443. [DOI] [PubMed] [Google Scholar]
- Angelaki DE, Hess BJ. Lesion of the nodulus and ventral uvula abolish steady-state off-vertical axis otolith response. J Neurophysiol. 1995;73:1716–1720. doi: 10.1152/jn.1995.73.4.1716. [DOI] [PubMed] [Google Scholar]
- Angelaki DE, Bush GA, Perachio AA. A model for the characterization of the spatial properties in vestibular neurons. Biol Cybern. 1992;66:231–240. doi: 10.1007/BF00198476. [DOI] [PubMed] [Google Scholar]
- Angelaki DE, Hess BJ, Suzuki J. Differential processing of semicircular canal signals in the vestibulo-ocular reflex. J Neurosci. 1995;15:7201–7216. doi: 10.1523/JNEUROSCI.15-11-07201.1995. [DOI] [PMC free article] [PubMed] [Google Scholar]
- Angelaki DE, McHenry MQ, Dickman JD, Newlands SD, Hess BJ. Computation of inertial motion: neural strategies to resolve ambiguous otolith information. J Neurosci. 1999;19:316–327. doi: 10.1523/JNEUROSCI.19-01-00316.1999. [DOI] [PMC free article] [PubMed] [Google Scholar]
- Angelaki DE, Shaikh AG, Green AM, Dickman JD. Neurons compute internal models of the physical laws of motion. Nature. 2004;430:560–564. doi: 10.1038/nature02754. [DOI] [PubMed] [Google Scholar]
- Barmack NH. GABAergic pathways convey vestibular information to the beta nucleus and dorsomedial cell column of the inferior olive. Ann N Y Acad Sci. 1996;781:541–552. doi: 10.1111/j.1749-6632.1996.tb15727.x. [DOI] [PubMed] [Google Scholar]
- Barmack NH, Shojaku H. Vestibular and visual climbing fiber signals evoked in the uvula-nodulus of the rabbit cerebellum by natural stimulation. J Neurophysiol. 1995;74:2573–2589. doi: 10.1152/jn.1995.74.6.2573. [DOI] [PubMed] [Google Scholar]
- Barmack NH, Yakhnitsa V. Vestibularly evoked climbing-fiber responses modulate simple spikes in rabbit cerebellar Purkinje neurons. Ann N Y Acad Sci. 2002;978:237–254. doi: 10.1111/j.1749-6632.2002.tb07571.x. [DOI] [PubMed] [Google Scholar]
- Barmack NH, Yakhnitsa V. Cerebellar climbing fibers modulate simple spikes in Purkinje cells. J Neurosci. 2003;23:7904–7916. doi: 10.1523/JNEUROSCI.23-21-07904.2003. [DOI] [PMC free article] [PubMed] [Google Scholar]
- Barmack NH, Baughman RW, Errico P, Shojaku H. Vestibular primary afferent projection to the cerebellum of the rabbit. J Comp Neurol. 1993;327:521–534. doi: 10.1002/cne.903270405. [DOI] [PubMed] [Google Scholar]
- Bernard JF. Topographical organization of olivocerebellar and corticonuclear connections in the rat—an WGA-HRP study: I. Lobules IX, X, and the flocculus. J Comp Neurol. 1987;263:241–258. doi: 10.1002/cne.902630207. [DOI] [PubMed] [Google Scholar]
- Bigaré F, Voogd J. Cerebello-vestibular projections in the cat. Acta Morphol Neerl Scand. 1977;15:323–325. [PubMed] [Google Scholar]
- Brodal A. The olivocerebellar projection in the cat as studied with the method of retrograde axonal transport of horseradish peroxidase. II. The projection to the uvula. J Comp Neurol. 1976;166:417–426. doi: 10.1002/cne.901660404. [DOI] [PubMed] [Google Scholar]
- Brodal A, Brodal P. Observations on the secondary vestibulocerebellar projections in the macaque monkey. Exp Brain Res. 1985;58:62–74. doi: 10.1007/BF00238954. [DOI] [PubMed] [Google Scholar]
- Carpenter MB, Stein BM, Peter P. Primary vestibulocerebellar fibers in the monkey: distribution of fibers arising from distinctive cell groups of the vestibular ganglia. Am J Anat. 1972;135:221–249. doi: 10.1002/aja.1001350209. [DOI] [PubMed] [Google Scholar]
- Clark B, Graybiel A. Contributing factors in the perception of the oculogravic illusion. Am J Psychol. 1963;76:18–27. [PubMed] [Google Scholar]
- Clark B, Graybiel A. Factors contributing to the delay in the perception of the oculogravic illusion. Am J Psychol. 1966;79:377–388. [PubMed] [Google Scholar]
- Dickman JD, Angelaki DE. Vestibular convergence patterns in vestibular nuclei neurons of alert primates. J Neurophysiol. 2002;88:3518–3533. doi: 10.1152/jn.00518.2002. [DOI] [PubMed] [Google Scholar]
- Dickman JD, Angelaki DE, Correia MJ. Response properties of gerbil otolith afferents to small angle pitch and roll tilts. Brain Res. 1991;556:303–310. doi: 10.1016/0006-8993(91)90320-u. [DOI] [PubMed] [Google Scholar]
- Epema AH, Gerrits NM, Voogd J. Secondary vestibulocerebellar projections to the flocculus and uvulo-nodular lobule of the rabbit: a study using HRP and double fluorescent tracer techniques. Exp Brain Res. 1990;80:72–82. doi: 10.1007/BF00228849. [DOI] [PubMed] [Google Scholar]
- Fernández C, Goldberg JM. Physiology of peripheral neurons innervating otolith organs of the squirrel monkey. III. Response dynamics. J Neurophysiol. 1976;39:996–1008. doi: 10.1152/jn.1976.39.5.996. [DOI] [PubMed] [Google Scholar]
- Fushiki H, Barmack NH. Topography and reciprocal activity of cerebellar Purkinje cells in the uvula-nodulus modulated by vestibular stimulation. J Neurophysiol. 1997;78:3083–3094. doi: 10.1152/jn.1997.78.6.3083. [DOI] [PubMed] [Google Scholar]
- Gerrits NM, Epema AH, van Linge A, Dalm E. The primary vestibulocerebellar projection in the rabbit: absence of primary afferents in the flocculus. Neurosci Lett. 1989;105:27–33. doi: 10.1016/0304-3940(89)90006-2. [DOI] [PubMed] [Google Scholar]
- Glasauer S. Linear acceleration perception: frequency dependence of the hilltop illusion. Acta Otolaryngol Suppl. 1995;520:37–40. doi: 10.3109/00016489509125184. [DOI] [PubMed] [Google Scholar]
- Glasauer S, Merfeld DM. Modeling three-dimensional responses during complex motion stimulation. In: Fetter M, Haslwanter T, Misslisch H, Tweed D, editors. Three-dimensional kinematics of eye, head and limb movements. Amsterdam: Harwood Academic; 1997. pp. 387–398. [Google Scholar]
- Graybiel A. Oculogravic illusion. AMA Arch Ophthalmol. 1952;48:605–615. doi: 10.1001/archopht.1952.00920010616007. [DOI] [PubMed] [Google Scholar]
- Green AM, Angelaki DE. Resolution of sensory ambiguities for gaze stabilization requires a second neural integrator. J Neurosci. 2003;23:9265–9275. doi: 10.1523/JNEUROSCI.23-28-09265.2003. [DOI] [PMC free article] [PubMed] [Google Scholar]
- Green AM, Angelaki DE. An integrative neural network for detecting inertial motion and head orientation. J Neurophysiol. 2004;92:905–925. doi: 10.1152/jn.01234.2003. [DOI] [PubMed] [Google Scholar]
- Green AM, Shaikh AG, Angelaki DE. Sensory vestibular contributions to constructing internal models of self-motion. J Neural Eng. 2005;2:164–179. doi: 10.1088/1741-2560/2/3/S02. [DOI] [PubMed] [Google Scholar]
- Groenewegen HJ, Voogd J. The parasagittal zonation within the olivocerebellar projection. I. Climbing fiber distribution in the vermis of cat cerebellum. J Comp Neurol. 1977;174:417–488. doi: 10.1002/cne.901740304. [DOI] [PubMed] [Google Scholar]
- Groenewegen HJ, Voogd J, Freedman SL. The parasagittal zonation within the olivocerebellar projection. II. Climbing fiber distribution in the intermediate and hemispheric parts of cat cerebellum. J Comp Neurol. 1979;183:551–601. doi: 10.1002/cne.901830307. [DOI] [PubMed] [Google Scholar]
- Hoddevik GH, Brodal A. The olivocerebellar projection studied with the method of retrograde axonal transport of horseradish peroxidase. V. The projections to the flocculonodular lobe and the paraflocculus in the rabbit. J Comp Neurol. 1977;176:269–280. doi: 10.1002/cne.901760208. [DOI] [PubMed] [Google Scholar]
- Kaptein RG, Van Gisbergen JA. Canal and otolith contributions to visual orientation constancy during sinusoidal roll rotation. J Neurophysiol. 2006;95:1936–1948. doi: 10.1152/jn.00856.2005. [DOI] [PubMed] [Google Scholar]
- Kaufman GD, Mustari MJ, Miselis RR, Perachio AA. Transneuronal pathways to the vestibulocerebellum. J Comp Neurol. 1996;370:501–523. doi: 10.1002/(SICI)1096-9861(19960708)370:4<501::AID-CNE7>3.0.CO;2-8. [DOI] [PubMed] [Google Scholar]
- Kevetter GA, Perachio AA. Distribution of vestibular afferents that innervate the sacculus and posterior canal in the gerbil. J Comp Neurol. 1986;254:410–424. doi: 10.1002/cne.902540312. [DOI] [PubMed] [Google Scholar]
- Kevetter GA, Leonard RB, Newlands SD, Perachio AA. Central distribution of vestibular afferents that innervate the anterior or lateral semicircular canal in the mongolian gerbil. J Vestib Res. 2004;14:1–15. [PubMed] [Google Scholar]
- Korte GE, Mugnaini E. The cerebellar projection of the vestibular nerve in the cat. J Comp Neurol. 1979;184:265–277. doi: 10.1002/cne.901840204. [DOI] [PubMed] [Google Scholar]
- Lewis RF, Haburcakova C, Merfeld DM. Roll tilt psychophysics in rhesus monkeys during vestibular and visual stimulation. J Neurophysiol. 2008;100:140–153. doi: 10.1152/jn.01012.2007. [DOI] [PMC free article] [PubMed] [Google Scholar]
- Maklad A, Fritzsch B. Partial segregation of posterior crista and saccular fibers to the nodulus and uvula of the cerebellum in mice, and its development. Brain Res Dev Brain Res. 2003;140:223–236. doi: 10.1016/s0165-3806(02)00609-0. [DOI] [PubMed] [Google Scholar]
- Marini G, Provini L, Rosina A. Macular input to the cerebellar nodulus. Brain Res. 1975;99:367–371. doi: 10.1016/0006-8993(75)90038-4. [DOI] [PubMed] [Google Scholar]
- Marini G, Provini L, Rosina A. Gravity responses of Purkinje cells in the nodulus. Exp Brain Res. 1976;24:311–323. doi: 10.1007/BF00235018. [DOI] [PubMed] [Google Scholar]
- Merfeld DM, Zupan LH. Neural processing of gravitoinertial cues in humans. III. Modeling tilt and translation responses. J Neurophysiol. 2002;87:819–833. doi: 10.1152/jn.00485.2001. [DOI] [PubMed] [Google Scholar]
- Merfeld DM, Park S, Gianna-Poulin C, Black FO, Wood S. Vestibular perception and action employ qualitatively different mechanisms. I. Frequency response of VOR and perceptual responses during translation and tilt. J Neurophysiol. 2005a;94:186–198. doi: 10.1152/jn.00904.2004. [DOI] [PubMed] [Google Scholar]
- Merfeld DM, Park S, Gianna-Poulin C, Black FO, Wood S. Vestibular perception and action employ qualitatively different mechanisms. II. VOR and perceptual responses during combined tilt ' translation. J Neurophysiol. 2005b;94:199–205. doi: 10.1152/jn.00905.2004. [DOI] [PubMed] [Google Scholar]
- Newlands SD, Purcell IM, Kevetter GA, Perachio AA. Central projections of the utricular nerve in the gerbil. J Comp Neurol. 2002;452:11–23. doi: 10.1002/cne.10350. [DOI] [PubMed] [Google Scholar]
- Newlands SD, Vrabec JT, Purcell IM, Stewart CM, Zimmerman BE, Perachio AA. Central projections of the saccular and utricular nerves in macaques. J Comp Neurol. 2003;466:31–47. doi: 10.1002/cne.10876. [DOI] [PubMed] [Google Scholar]
- Ono S, Kushiro K, Zakir M, Meng H, Sato H, Uchino Y. Properties of utricular and saccular nerve-activated vestibulocerebellar neurons in cats. Exp Brain Res. 2000;134:1–8. doi: 10.1007/s002210000424. [DOI] [PubMed] [Google Scholar]
- Paige GD, Seidman SH. Characteristics of the VOR in response to linear acceleration. Ann N Y Acad Sci. 1999;871:123–135. doi: 10.1111/j.1749-6632.1999.tb09179.x. [DOI] [PubMed] [Google Scholar]
- Precht W, Simpson JI, Llinás R. Responses of Purkinje cells in rabbit nodulus and uvula to natural vestibular and visual stimuli. Pflugers Arch. 1976;367:1–6. doi: 10.1007/BF00583649. [DOI] [PubMed] [Google Scholar]
- Purcell IM, Perachio AA. Peripheral patterns of terminal innervation of vestibular primary afferent neurons projecting to the vestibulocerebellum in the gerbil. J Comp Neurol. 2001;433:48–61. doi: 10.1002/cne.1124. [DOI] [PubMed] [Google Scholar]
- Reisine H, Raphan T. Neural basis for eye velocity generation in the vestibular nuclei of alert monkeys during off-vertical axis rotation. Exp Brain Res. 1992;92:209–226. doi: 10.1007/BF00227966. [DOI] [PubMed] [Google Scholar]
- Ruigrok TJ. Collateralization of climbing and mossy fibers projecting to the nodulus and flocculus of the rat cerebellum. J Comp Neurol. 2003;466:278–298. doi: 10.1002/cne.10889. [DOI] [PubMed] [Google Scholar]
- Sato Y, Kanda K, Ikarashi K, Kawasaki T. Differential mossy fiber projections to the dorsal and ventral uvula in the cat. J Comp Neurol. 1989;279:149–164. doi: 10.1002/cne.902790113. [DOI] [PubMed] [Google Scholar]
- Schor RH, Angelaki DE. The algebra of neural response vectors. Ann N Y Acad Sci. 1992;656:190–204. doi: 10.1111/j.1749-6632.1992.tb25209.x. [DOI] [PubMed] [Google Scholar]
- Seidman SH, Telford L, Paige GD. Tilt perception during dynamic linear acceleration. Exp Brain Res. 1998;119:307–314. doi: 10.1007/s002210050346. [DOI] [PubMed] [Google Scholar]
- Shaikh AG, Ghasia FF, Dickman JD, Angelaki DE. Properties of cerebellar fastigial neurons during translation, rotation, and eye movements. J Neurophysiol. 2005a;93:853–863. doi: 10.1152/jn.00879.2004. [DOI] [PubMed] [Google Scholar]
- Shaikh AG, Green AM, Ghasia FF, Newlands SD, Dickman JD, Angelaki DE. Sensory convergence solves a motion ambiguity problem. Curr Biol. 2005b;15:1657–1662. doi: 10.1016/j.cub.2005.08.009. [DOI] [PubMed] [Google Scholar]
- Si X, Angelaki DE, Dickman JD. Response properties of pigeon otolith afferents to linear acceleration. Exp Brain Res. 1997;117:242–250. doi: 10.1007/s002210050219. [DOI] [PubMed] [Google Scholar]
- Stockwell CW, Guedry FE., Jr The effect of semicircular cana stimulation during tilting on the subsequent perception of the visual vertical. Acta Otolaryngol. 1970;70:170–175. doi: 10.3109/00016487009181874. [DOI] [PubMed] [Google Scholar]
- Wearne S, Raphan T, Cohen B. Control of spatial orientation of the angular vestibuloocular reflex by the nodulus and uvula. J Neurophysiol. 1998;79:2690–2715. doi: 10.1152/jn.1998.79.5.2690. [DOI] [PubMed] [Google Scholar]
- Yakhnitsa V, Barmack NH. Antiphasic Purkinje cell responses in mouse uvula-nodulus are sensitive to static roll-tilt and topographically organized. Neuroscience. 2006;143:615–626. doi: 10.1016/j.neuroscience.2006.08.006. [DOI] [PubMed] [Google Scholar]
- Yakusheva TA, Shaikh AG, Green AM, Blazquez PM, Dickman JD, Angelaki DE. Purkinje cells in posterior cerebellar vermis encode motion in an inertial reference frame. Neuron. 2007;54:973–985. doi: 10.1016/j.neuron.2007.06.003. [DOI] [PubMed] [Google Scholar]
- Zhou W, Tang BF, Newlands SD, King WM. Responses of monkey vestibular-only neurons to translation and angular rotation. J Neurophysiol. 2006;96:2915–2930. doi: 10.1152/jn.00013.2006. [DOI] [PubMed] [Google Scholar]


