

Summary
The polarization of adipose tissue resident macrophages towards the alternatively activated, anti-inflammatory M2 phenotype is believed to improve insulin sensitivity. However, mechanisms controlling tissue macrophage activation remain unclear. We show adipocytes are a source of Th2 cytokines, including IL-13 and to a lesser extent, IL-4, which induce macrophage PPARδ (or PPARβ) expression through a STAT6 binding site on its promoter to activate alternative activation. Co-culture studies indicate that PPARδ ablation renders macrophages incapable of transition to the M2 phenotype, which in turns causes inflammation and metabolic derangement in adipocytes. Remarkably, a similar regulatory mechanism by hepatocyte-derived Th2 cytokines and macrophage PPARδ is found to control hepatic lipid metabolism. The physiological relevance of this paracrine pathway is demonstrated in myeloid specific PPARδ−/− mice, which develop insulin resistance and show increased adipocyte lipolysis and severe hepatosteatosis. These findings provide a molecular basis to modulate tissue resident macrophage activation and insulin sensitivity.
Introduction
The adipose tissue has been recognized as an endocrine organ modulating metabolic homeostasis (Qatanani and Lazar, 2007; Rosen and Spiegelman, 2006). Within this microenvironment, adipocytes secrete adipokines, including leptin, adiponectin and resistin, to control systemic lipid and glucose metabolism (Qatanani and Lazar, 2007; Rosen and Spiegelman, 2006). In contrast, adipose tissue resident macrophages (ATMs) are a major source of inflammatory mediators, such as monocyte chemoattractant protein-1 (MCP-1) and tumor necrosis factor α (TNFα), exerting direct and indirect effects on adipocyte function and insulin sensitivity (Hotamisligil, 2006). A major role of ATMs in the pathogenesis of metabolic diseases has been revealed in recent studies. Increased macrophage infiltration in white adipose tissue (WAT) is found in obese states (Weisberg et al., 2003; Xu et al., 2003). Following this observation, it has been suggested that ATMs from lean animals show an alternatively activated, M2 phenotype (Lumeng et al., 2007a), which is normally induced by Th2 cytokines, such as interleukin-4 (IL-4) and IL-13. These M2 macrophages produce IL-10 to suppress inflammation (Gordon, 2003; Mantovani et al., 2004). High fat feeding triggers the recruitment of macrophages exhibiting markers of classic activation by Th1 cytokines, including interferon-γ (IFN-γ), IL-1β and TNFα, to WAT. These M1 macrophages release pro-inflammatory cytokines causing metabolic derangement. Although these findings demonstrate a link between inflammation and metabolic diseases, a critical question remaining to be answered is how ATM activation is regulated and whether this M1/M2 phenotypic switch is also relevant in macrophages residing in other metabolically active tissues.
At the signaling level, inflammatory and metabolic processes are intertwined and are integral components of metabolic diseases (Hotamisligil, 2006). For example, free fatty acids have been shown to cause metabolic dysregulation through toll-like receptor 4 (TLR4) (Shi et al., 2006), whereas pro-inflammatory cytokines, such as TNFα, induce adipocyte lipolysis and inhibit insulin signaling (Gasic et al., 1999; Hirosumi et al., 2002; Laurencikiene et al., 2007; Souza et al., 1998). The c-Jun N-terminal kinase (JNK) appears to be the common downstream effector targeted by both signaling pathways. On the other hand, glycolysis is known to provide the energy required to mount an inflammatory response (Cramer et al., 2003; Kim et al., 2006; Seagroves et al., 2001). More recently, lipid catabolism has been shown to support the metabolic need during macrophage alternative activation, in which IL-4 activates PPARγ coactivator-1β (PGC-1β) and signal transducer and activator of transcription 6 (STAT6) to induce genes involved in fatty acid oxidation and mitochondria biogenesis (Vats et al., 2006). PGC-1β has also been proposed to mediate IFN-γ-induced mitochondrial reactive oxygen species production, through co-activating estrogen-related receptor α (ERRα) in the control of genes encoding respiratory chain machinery (Sonoda et al., 2007).
Peroxisome proliferators activated receptor δ (PPARδ or PPARβ), together with PPARγ and PPARα, constitute a subfamily within the nuclear receptor superfamily (Desvergne and Wahli, 1999; Lee et al., 2003b; Reilly and Lee, 2008). PPARδ has been shown to transcriptionally regulate oxidative metabolism in muscle and improve insulin sensitivity (Lee et al., 2006b; Schuler et al., 2006; Tanaka et al., 2003; Wang et al., 2003). In the macrophage, we have previously demonstrated that PPARδ activation suppressed inflammation and induced genes in the fatty acid catabolic program (Barish et al., 2008; Lee et al., 2003a; Lee et al., 2006a), suggesting that this receptor may function as a metabolic regulator of alternative activation. In the current study, we discover a Th2 cytokine/PPARδ signaling cascade that modulates resident macrophage polarization. We find that adipocytes are a source of Th2 cytokines, notably IL-13, which induces the expression of PPARδ to induce ATM alternative activation. A similar paracrine mechanism is found between hepatocyte-derived Th2 cytokines and macrophage PPARδ in the liver. This signaling cascade regulates metabolic homeostasis within metabolically active tissues and may serve as a therapeutic target to treat obesity-related metabolic syndrome.
Results
Adipocyte conditioned medium induces markers of alternative activation
The balance between M1 and M2 ATMs is believed to contribute to the onset of insulin resistance (Charo, 2007; Lumeng et al., 2007a). However, the mechanism through which ATMs are polarized has not been identified. We hypothesized that ATM activation is modulated by factors released by adipocytes. To test this hypothesis, we treated wild-type (WT) macrophages with conditioned medium (CM) collected from fully differentiated 3T3-L1 or 3T3-F442A (F442A) adipocytes. Pro-inflammatory genes MCP-1 and TNFα were induced by 24 hours but declined after 48 hours (Figure 1A). Unexpectedly, M2 markers, macrophage galactose N-acetyl-galactosamine-specific lectin 1 (Mgl1) and Mgl2, were also increased by CM and the induction appeared to sustain for 48 hours, indicating a switch from the M1 to M2 status. In line with this, 3T3-L1 adipocyte CM increased the activity of STAT6, which is the key signaling effector of Th2 cytokines (Figure 1B), and up-regulated the expression of Th2 cytokine receptors, IL-4R and IL-13Rα1 (Figure 1C). These effects were not detected in macrophages treated with pre-adipocyte CM (data not shown), supporting our hypothesis that adipocyte factors could modulate macrophage activation.
Figure 1. PPARδ mediates the effect of adipocyte conditioned medium on induction of M2 macrophage markers.

(A) M2 markers, Mgl1 and Mgl2, are induced in macrophages treated with conditioned medium (CM) collected from 3T3-L1 or 3T3 F442A adipocytes. The expression of MCP-1 and TNFα also increased 24 hours after CM treatment but declined at 48 hours. Gene expression was determined by real-time RT-PCR. (B) Adipocyte CM increases STAT6 activity in the macrophage. Protein lysates from WT or PPARδ−/− macrophage were subjected to Western blot analyses. The phospho-STAT6 (p-STAT6) and phospho-JNK (p-JNK) signal was used to determine their respective activities. Total STAT6 and JNK (t-STAT6 and t-JNK) were included as loading controls. The − and + sign indicate without or with CM treatment (48 hours), respectively. (C) The ability of 3T3-L1 adipocyte CM to activate M2 genes is reduced in PPARδ−/− macrophages. IL-4R: IL-4 receptor; IL-13Rα1: IL-13 receptor α1. Values are expressed as means ± SEM. *p<0.05, comparing − and + treatment within the same genotype.
Recently, fatty acid catabolism and oxidative metabolism has been shown to fuel alternative activation (Vats et al., 2006). We found genes encoding this metabolic program, including PGC-1β, SLC25a20 and Sdha, were increased by 3T3-L1 adipocyte CM (Figure 1C). Interestingly, the expression of PPARδ was also up-regulated. As PPARδ has been shown to regulate fatty acid oxidation and oxidative metabolism, we sought to determine whether PPARδ mediated this phenotypic switch. In fact, the ability of adipocyte CM to induce M2 signature genes was severely reduced in PPARδ−/−macrophages (Figure 1C). Flow cytometry analyses demonstrated that the increase in cell surface Mgl1 protein by CM was abolished in PPARδ−/− cells (Figure S1C). In addition, Western blot analyses showed that in PPARδ−/− macrophages, CM failed to increase STAT6 activity yet potentiated that of the pro-inflammatory JNK (Figure 1B). Similar defects in M2 activation were also observed in PPARδ−/− macrophages treated with 3T3-F442A adipocyte CM, IL-13 or IL-4 (Figure S1 and data not shown). Collectively, these results suggest that adipocyte factors activate PPARδ in the macrophage to turn on alternative activation.
Adipocytes are a source of Th2 cytokines
Macrophage alternative activation is mainly induced by IL-13 and IL-4, both of which activate STAT6 for signal transduction (Gordon, 2003). Although these two cytokines are primarily produced by type II T cells, the observation that adipocyte CM increased STAT6 activity prompted us to examine whether adipocytes are capable of producing Th2 cytokines. Remarkably, the expression of IL-13 was dramatically induced in fully differentiated 3T3-L1 adipocytes compared to pre-adipocytes (Figure 2A). Similar results were obtained in differentiated human adipocytes (data not shown). IL-4 was also induced in differentiated 3T3-L1 adipocytes but was undetectable in human adipocytes under the same condition. Since real-time PCR results did not show the absolute expression level, enzyme-linked immunosorbent assays (ELISAs) were conducted to quantify IL-13 and IL-4 concentrations in CM and cell lysate. It was determined that the IL-13 concentration was 10-fold and 3–4-fold higher than that of the IL-4 in CM from 3T3 and primary adipocytes, respectively (Figure 2B). In WAT, IL-13 was 8 fold higher than IL-4 and it could be readily detected by Western blot analyses (Figure 2A). Furthermore, recombinant IL-13 increased macrophage PPARδ expression (Figure 2C). These data suggest that the effect of 3T3-L1 adipocyte CM was mainly mediated by IL-13. To further prove this, macrophages were treated with CM pre-incubated with IL-13 neutralizing antibody for 1 hour. IL-13 neutraliztion diminished the ability of CM to induce markers of alternative activation, while it increased MCP-1 expression (Figure 2D). These results provide evidence that ATM polarization could be modulated by adipocyte derived Th2 cytokines in a paracrine manner.
Figure 2. Adipocytes produce Th2 cytokines.
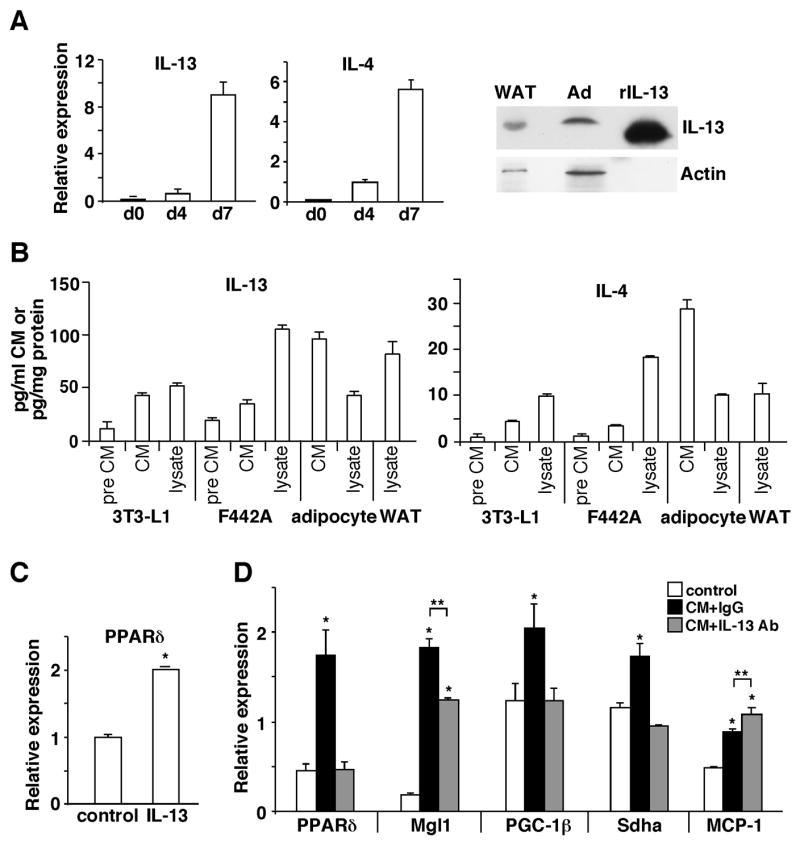
(A) The expression of IL-13 and IL-4 is induced during 3T3-L1 adipocyte differentiation. Gene expression was determined by real-time PCR at day 0, 4 and 7 (d0, d4 and d7) of the differentiation process. IL-13 protein in 3T3-L1 adipocyte (Ad) and WAT lysate (100 μg) was detected by Western blotting. Recombinant IL-13 (rIL-13, 60 ng) was included as a control. (B) Quantification of Th2 cytokines in CM and lysate from 3T3-L1, 3T3 F442A and primary adipocytes and WAT by ELISA. Pre CM: pre-adipocyte CM. (C) IL-13 induces PPARδ expression in the macrophage determined by real-time PCR. Cells were given IL-13 (20 ng/ml) for 24 hours. (D) IL-13 neutralizing antibody pre-incubation abolishes the ability of CM to induce alternative activation. 3T3-l1 adipocyte CM was pre-incubated with an IL-13 neutralizing antibody (Ab) or control IgG one hour prior to treating macrophages. Values are expressed as means ± SEM. *p<0.05, comparing CM treatment to control; **p<0.05, comparing IgG to IL-13 Ab.
PPARδ−/− macrophages cause adipocyte dysfunction
Having established the potential role of adipocyte-derived Th2 cytokines and PPARδ in ATM alternative activation, we sought to examine how disruption of this pathway by PPARδ ablation in the macrophage affects WAT homeostasis. A co-culture system was employed to mimic the microenvironment of WAT, in which macrophages were cultured in an insert on a semi-permeable membrane and differentiated 3T3-L1 adipocytes were grown in the lower chamber of the well. We first examined gene expression in the macrophage 48 hours after co-culturing. Consistent with the results from CM treatment, the expression of M2 markers, including Mgl1, Mgl2, mannose receptor C type 2 (Mrc2) and IL-10 was all induced in WT macrophages (Figure 3A). In sharp contrast, PPARδ deletion led to up-regulation of IL-6 and reduction of M2 genes. These differences in gene expression were not mediated by defects in macrophage differentiation, as levels of the macrophage marker F4/80 remained unchanged between the two genotypes. The differential expression of anti-inflammatory and pro-inflammatory cytokines, IL-10 and IL-6, in WT and PPARδ−/− macrophages indicated a potential feedback regulation by the macrophage on adipocyte function. In fact, adipocytes co-incubated with PPARδ−/− macrophages had elevated expression of pro-inflammatory mediators, including MCP-1, TNFα and IL-6, with a concomitant increase in JNK signaling, compared to adipocytes co-incubated with WT macrophages (Figure 3B and 3C). This suggests that macrophage PPARδ may dampen inflammation by switching on alternative activation, which protects against adipocyte dysfunction caused by pro-inflammatory stimulants. In support of this idea, adipocytes co-cultured with WT macrophages exhibited reduced levels of glucose transporter 4 (GLUT4) and insulin stimulated glucose uptake. However, the deregulated glucose metabolism was worsened in adipocytes co-cultured with PPARδ−/− macrophages (Figure 3C). These results indicate a critical role of alternative activation modulated by macrophage PPARδ in the control of WAT metabolic homeostasis.
Figure 3. Assessment of the role of alternative activation regulated by macrophage PPARδ in WAT homeostasis using a co-culture model.
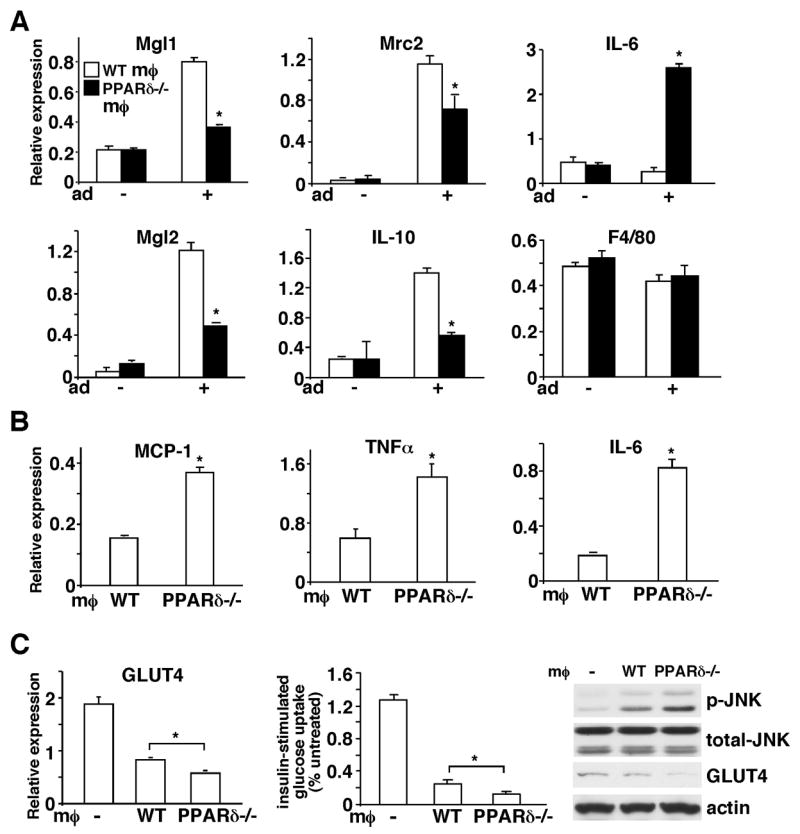
(A) PPARδ plays an important role in macrophage alternative activation induced by adipocyte-derived Th2 cytokines. A co-culture system was established to mimic the WAT microenvironment, in which macrophages were cultured in an insert on a semi-permeable membrane and differentiated 3T3-L1 adipocytes were grown in the lower chamber of the well. Gene expression in macrophages was determined 48 hours after co-culturing with adipocytes by real-time PCR. Mgl1, Mgl2, Mrc2 and IL-10 are M2 markers and F4/80 is a macrophage marker included as a control. The − and + signs indicate without or with adipocytes (Ad) co-culture. (B) Adipocytes co-cultured with PPARδ−/− macrophages express higher levels of pro-inflammatory mediators. Two days after co-culturing with macrophages, adipocytes were harvested and gene expression was determined by real-time PCR. (C) Adipocytes co-cultured with PPARδ−/− macrophages have reduced GLUT4 expression and insulin stimulated glucose uptake. The expression of GLUT4 in control adipocytes (indicated with −) or adipocytes co-cultured with WT or PPARδ−/−macrophages was determined by real-time PCR and Western blotting. The glucose uptake assay was performed using radioactive 2-deoxy-glucose. p-JNK: phospho-JNK; t-JNK: total JNK; MØ: macrophage. Values are expressed as means ± SEM. *p<0.05, comparing WT to PPARδ−/− macrophages.
Myeloid specific PPARδ−/− mice develop insulin resistance
To examine the pathophysiological relevance of the observations in the co-culture model, we generated myeloid-specific PPARδ knockout mice by crossing PPARδ floxed mice (WT) to lysozyme cre mice (Mac-PPARδ−/−). Genomic and real-time RT-PCR analyses demonstrated that the deletion of exon 4 of PPARδ where the loxP sites flanked was nearly complete in macrophages derived from bone marrow or isolated from the liver and WAT, but was not detected in other cell types such as adipocytes, hepatocytes and muscle fibers (Figure S2). In addition, the ability of the PPARδ agonist GW501516 (Kang et al., 2007; Oliver et al., 2001) to regulate target gene expression was abolished in macrophages from Mac-PPARδ−/− mice. PPARδ deletion was also detected in other myeloid cells, including dendritic cells and to a lesser extent, neutrophils (Figure S2). These mice showed no apparent developmental phenotype.
When fed a high fat diet to induce obesity and metabolic dysregulation, Mac-PPARδ−/− mice gained more weight than control animals (Figure S3A). Interestingly, the WAT to body weight ratio was decreased while the liver to body weight ratio was increased in Mac-PPARδ−/− mice (Table S1). The glucose tolerance test (GTT) showed no difference because Mac-PPARδ−/− mice exhibited increased insulin secretion at both the baseline and during a GTT, a defect found before full-blown diabetes (Figure 4A). The insulin tolerance test (ITT) further verified these mice were insulin resistant compared to WT controls. To determine which metabolically active tissues contributed to the observed phenotype, we examined insulin signaling in WAT, liver and muscle after an acute insulin injection. Impaired insulin signal transduction, determined by insulin-stimulated Akt phosphorylation, was found in WAT but not in the liver or muscle of Mac-PPARδ−/− mice (Figure 4B; Figure S3B and C). Insulin stimulated tyrosine phosphorylation of insulin receptor β (IRβ) was also dramatically reduced in WAT. In addition, the level of phospho-STAT6 was decreased, whereas JNK activity was increased (Figure 4D). These data demonstrate that macrophage PPARδ ablation disrupts WAT homeostasis leading to adipocyte insulin resistance, verifying the model derived from in vitro studies.
Figure 4. Mac-PPARδ−/− mice develop WAT insulin resistance.

(A) Hyperinsulinemia and insulin resistance in Mac-PPAR−/− mice on a high fat diet. The GTT (left), insulin production during the GTT (middle) and ITT were conducted on male mice (n=7) after 4 months on a high fat diet. (B) and (C) Defective insulin signaling in WATs of Mac-PPARδ−/− mice. Mice were given 5u insulin/kg body weight through the portal vein. Tissues were collected right before or 5 min after injection. Insulin stimulated Akt phosphorylation (p-Akt) (B) and IRβ tyrosine phosphorylation (C) was determined in WAT lysates from 5 individual wt or Mac-PPARδ−/− mice by Western blot analyses. IRβ was immunoprecipitated, followed by immunoblotting with anti-phospho-tyrosine (p-Tyr-IRβ) and anti-IRβ antibodies. The level of insulin-stimulated phosphorylation was quantified and normalized to that of total protein to obtain fold changes. Similar results were obtained using actin for normalization. t-Akt: total Akt. (D) Western blot analyses demonstrating increased JNK and decreased STAT6 signaling in WATs of Mac-PPARδ−/− mice. p-JNK and p-STAT6: phospho-JNK and STAT6; t-JNK and t-STAT6: total JNK and STAT6. Values are expressed as means ± SEM. *p<0.05, comparing WT to Mac-PPARδ−/− mice.
Myeloid PPARδ gene deletion causes tissue inflammation and dysfunction
To further characterize the phenotypes in glucose metabolism and the altered tissue mass, histological analyses of WAT and liver were performed on the high fat fed cohort. Intriguingly, Mac-PPARδ−/− WAT showed the presence of many small adipocytes surrounded by macrophages (Figure 5A). Examination of relevant metabolic genes revealed that the expression of GLUT4 and perilipin, a lipid droplet coating protein controlling lipid storage and lipolysis (Londos et al., 2005), was down-regulated, whereas genes encoding fatty acid synthesis (fatty acid synthase, FAS) and oxidation (CPT1) and adipokines (leptin and adiponectin) were unaffected (Figure 5B). Consistent with the co-culture studies, M2 markers, including Mgl1, Mgl2 and Mrc2, were suppressed and pro-inflammatory mediators, including MCP-1, TNFα and IL-6, as well as the pan-macrophage marker F4/80 were up-regulated in WAT of Mac-PPARδ−/− mice (Figure 5C and 5D). Furthermore, TNFα protein levels determined by ELISA were higher, whereas IL-13 and IL-4 levels were similar in Mac-PPARδ−/− WAT, suggesting that the changes in inflammatory status were not due differences in the production of WAT-derived Th2 cytokine (Figure 5E and data not shown). Since TNFα has been shown to increase lipolysis through perilipin down-regulation (Laurencikiene et al., 2007), we sought to determine whether WAT of Mac-PPARδ−/− mice had increased lipolysis. Primary adipocytes were isolated from high fat fed mice and subjected to stimulation with isoproterenol, a β-adrenergic receptor agonist. We found that adipocytes from Mac-PPARδ−/− mice had more than two fold increase in basal and isoproterenol-stimulated lipolysis (Figure 5F). These findings suggest that the reduction in the adipocyte size and WAT to body weight ratio by myeloid PPARδ deletion may result from deregulated adipocyte lipolysis.
Figure 5. Increased WAT inflammation and adipocyte lipolysis in Mac-PPARδ−/− mice.
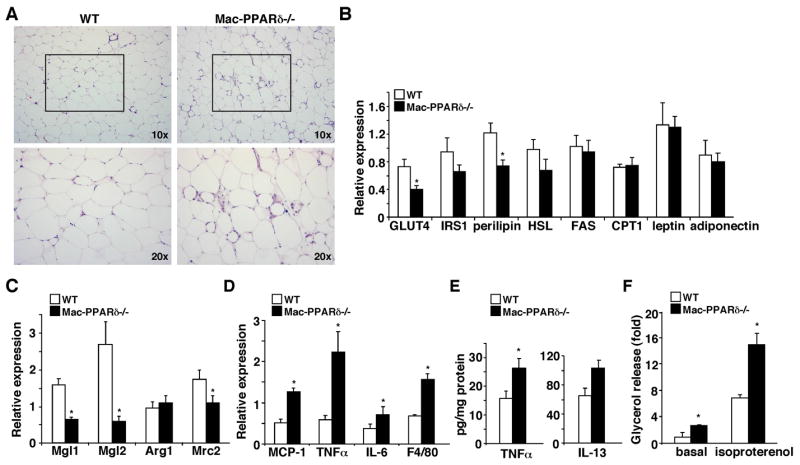
(A) Histological analyses of WAT sections (H & E staining) from high fat fed WT and Mac-PPARδ−/− mice. Mac-PPARδ−/− WATs contained small adipocytes that were surrounded by macrophages. (B) Analyses of metabolic gene expression in WAT by real-time PCR. IRS1: insulin receptor substrate 1; HSL: hormone sensitive lipase; FAS: fatty acid synthase; CPT1: carnitine palmitoyltransferase 1. (C) M2 markers are down-regulated in WATs of Mac-PPARδ−/− mice. M2 gene expression was determined by real-time PCR and normalized with F4/80. (D) WATs of Mac-PPARδ−/− mice exhibit elevated inflammatory gene expression. Gene expression was determined by real-time PCR. (E) Determination of TNFα and IL-13 protein concentration in WAT by ELISA (F) Increased lipolysis in primary adipocytes from Mac-PPARδ−/− mice. The rate of lipolysis was determined by glycerol release at the baseline or upon isoproterenol stimulation. Values are expressed as means ± SEM. *p<0.05, comparing WT to Mac-PPARδ−/− mice.
Assessment of the liver samples revealed that hepatosteatosis was more profound in Mac-PPARδ−/− mice compared to WT controls, which correlated well with the increased hepatic TG content (Figure 6A). In line with this observation, the expression of lipogenic genes (FAS and ACC2) was induced in livers of Mac-PPARδ−/− mice. In contrast, oxidative metabolism genes remained unchanged (Figure 6B). Interestingly, IL-1β and F4/80 were up-regulated and M2 markers, including arginase 1 (Arg1) and Mrc2, were down-regulated. These results prompted us to examine whether a similar Th2 cytokine/PPARδ regulatory mechanism between hepatocytes and resident macrophages (e.g., Kupffer cells) may exist and regulate hepatic lipid metabolism. In fact, we detected IL-13 and IL-4 in liver and hepatocyte lysates and the IL-13 concentration appeared to be higher than that of IL-4 (Figure 6C). In addition, M2 markers were induced in WT macrophages co-cultured with hepatocytes. This induction was diminished in PPARδ−/− macrophages (Figure 6D). On the other hand, hepatocytes co-cultured with PPARδ−/−macrophages showed increased ACC2 expression (Figure 6E), which was also observed in livers of Mac-PPARδ−/− mice. ACC2 is known to suppress fatty acid catabolism (Abu-Elheiga et al., 2001). As expected from an elevated ACC2 activity, hepatocytes co-cultured with PPARδ−/− macrophages had reduced fatty acid β-oxidation (Figure 6E, insert), indicating that the increase in hepatic lipid accumulation in Mac-PPARδ−/− mice could be due to increased lipogenesis and reduced fatty acid catabolism. Collectively, these data suggest that the signaling cascade involving tissue derived Th2 cytokines and macrophage PPARδ plays a critical role in modulating inflammation and maintaining metabolic homeostasis in metabolically active sites, such as the liver and WAT.
Figure 6. Mac-PPARδ−/− mice exhibit severe hepatic steatosis.

(A) Histological analyses of liver sections (H & E staining) from high fat fed WT and Mac-PPARδ−/−mice. Livers of Mac-PPARδ−/− mice contained larger lipid droplets. Hepatic lipid content was determined by enzymatic assays and normalized to protein content. (B) Analyses of metabolic and inflammatory gene expression in the liver by real-time PCR. ACC2: acetyl-CoA carboxylase 2; SREBP: sterol regulatory element-binding protein 1-c; Aox: acetyl-CoA oxidase. (C) Hepatocyes are a source of Th2 cytokines. IL-13 and IL-4 concentrations in lysates of isolated hepatocytes and liver were determined by ELISA. (D) M2 markers are induced in macrophages co-cultured with primary hepatocytes. Experiments were conducted similar to those in macrophage-adipocyte co-culture. The induction of Mgl1/2 was diminished in PPARδ−/− macrophages. The − and + signs indicate without or with hepatocyte co-culture. (E) Hepatocytes co-cultured with PPARδ−/− macrophages have increased ACC2 expression and reduced fatty acid oxidation. Insert: the rate of fatty acid β-oxidation determined by 3H2O production fromp 3H-fatty acids. Values are expressed as means ± SEM. *p<0.05.
Transcriptional regulation of alternative activation by PPARδ
Results presented earlier indicate that Th2 cytokines up-regulate PPARδ to modulate macrophage alternative activation (Figure 1 and 2). We sought to determine whether PPARδ is a direct target of Th2 cytokines. Analyses of a 2kb promoter region of PPARδ had identified a putative STAT6 binding site. Reporter assays conducted in RAW264.7 macrophage cell line verified that PPARδ promoter activity could be induced by IL-13 and this induction was abolished when the STAT6 binding site was mutated (Figure 7A), indicating that Th2 cytokine/STAT6 signaling controls PPARδ expression. To understand the molecular mechanism through which PPARδ regulates M2 gene expression, Mgl1 promoter activity was examined. Interestingly, report assays showed that the basal and IL-13-induced Mgl1 promoter activity was greatly enhanced by co-transfection of expression vectors for PPARδ and the obligate heterodimer partner RXRα (Figure 7B), which was further increased by the addition of a PPARδ agonist, GW501516. Consistent with the in vitro result, GW501516 and IL-13 synergistically up-regulated Mgl1 in WT macrophages (Figure 7C). Putative DNA binding elements for PPARδ and STAT6 could be found in the 2kb regulatory region used for report assays (data not shown), suggesting that in addition to controlling PPARδ expression, Th2 cytokine signaling may crosstalk with PPARδ on Mgl1 promoter. Similarly, GW501516 and adipocyte CM had a synergistic effect on Mgl1 up-regulation and the ligand effect was completely lost in PPARδ−/− macrophages (Figure 7D).
Figure 7. Synergistic regulation of M2 gene expression by IL-13 and PPARδ.

(A) PPARδ promoter activity is induced by IL-13 through a STAT6 binding site. A luciferase (luc) reporter driven by mouse PPARδ promoter (upper panel) was transfected into RAW264.7 cells. IL-13 was given at 40 ng/ml. The transcriptional initiation site was designated as +1 and the putative STAT6 binding site was indicated. STAT6 mutant: PPARδ promoter reporter with the mutated STAT6 binding site; RLU: relative luciferase unit. Values are expressed as means ± SEM. *p<0.05. (B) Mgl1 promoter is regulated by PPARδ and IL-13. Mgl1 promoter reporter was transfected into RAW264.7 cells, together with either the control vector or expression vectors for PPARδ and RXRα. Cells were treated with IL-13 (40 ng/ml) and/or a PPARδ agonist, GW501516 (0.1 μM). *p<0.05, comparing to vehicle treated control. (C) Co-treatment with IL-13 and GW501516 synergistically induces Mgl1 expression in the macrophage. Mgl1 expression was determined 48 hours after treatments by real-time PCR. (D) PPARγ activation could not compensate for PPARδ function in alternative activation. Mgl1 expression was measured in WT and PPARδ−/− macrophages treated with rosiglitazone (rosi, PPARγ agonist, 1μM), GW501516, 3T3 F442A adipocyte CM or the combinations. (E) PPARδ/γ−/− and PPARδ−/− macrophages show a similar reduction in F442A adipocyte CM and IL-13 stimulated Mgl1 expression. (F) Model for the role of macrophage PPARδ in metabolic homeostasis. Macrophages in WAT and the liver are prone to activation by stimulants, such as Th1 cytokines and free fatty acids. As a regulatory mechanism, adipocytes and hepatocytes produce Th2 cytokines to dampen inflammation. The signaling of Th2 cytokines is amplified through the activation of STAT6 and induction of PPARδ. Fatty acids also serve as ligands to activate PPARδ to control the expression of M2 genes as well as genes encoding oxidative metabolism, including PGC-1δ, which is required for STAT6 co-activation. High fat feeding or PPARδ gene deletion disrupts this homeostasis, leading to metabolic dysfunction in WAT and the liver.
PPARγ has previously been shown to modulate M2 activation (Bouhlel et al., 2007; Odegaard et al., 2007), raising the question whether PPARγ activation could rescue the defect in PPARδ−/− macrophages. Rosiglitazone, a PPARγ agonist, increased the basal level of Mgl1 (Figure 7D). However, it minimally affected CM-induced Mgl1 expression in PPARδ−/− macrophages. Furthermore, the reduction in the ability of adipocyte CM or IL-13 to up-regulate Mgl1 was similar between PPARδ−/− and PPARδ/γ double knockout macrophages, indicating that PPARδ plays a predominant role in the transcriptional control of alternative activation (Figure 7E). In summary, these findings suggest that PPARδ functions as an effector of Th2 cytokines, whose activation is required for the up-regulation of M2 gene expression.
Discussion
This study uncovers two unexpected sources of Th2 cytokines, adipocytes and hepatocytes. This finding provides a molecular mechanism through which resident macrophage activation is modulated. Our results further show that PPARδ is induced by Th2 cytokines to control the transcriptional program of alternative activation in the macrophage. The subsequent phenotypic switch to the M2 phenotype plays an important role in dampening inflammation within WAT and the liver, thereby providing protection against insults from inflammatory stimulants. The physiological relevance of this pathway is demonstrated in myeloid specific PPARδ−/− mice, which exhibit adipocyte dysfunction and insulin resistance as well as hepatosteatosis.
Several lines of evidence support the notion that tissue-derived Th2 cytokines are biological active and metabolically relevant. First, CM collected from 3T3 adipocytes, which mainly contains IL-13, increased STAT6 activity and the expression of M2 markers. This effect is inhibited by an IL-13 neutralizing antibody. In addition, IL-13 and IL-4 protein could be detected in lysates from primary adipocytes and hepatocytes as well as from WAT and liver, although IL-4 levels appeared to be several fold lower. The production of Th2 cytokines by adipocytes and hepatocytes could be considered a regulatory mechanism to prevent uncontrolled inflammation (Figure 7F), as macrophages in WAT and liver are prone to activation by inflammatory mediators, including free fatty acids. The activated macrophages, in turn, release cytokines, such as TNFα, IL-1β and IL-6, which cause metabolic deregulation. In the macrophage, the signaling of Th2 cytokines is transduced through STAT6 and PPARδ. While some fatty acid species trigger inflammation, others may serve as endogenous ligands to activate PPARδ to turn on alternative activation.
In support of the proposed model, high fat fed myeloid-specific PPARδ−/− mice showed increased M1 and decreased M2 markers in WAT and the liver. This results in lipolysis and insulin resistance in adipocytes. These defects are likely mediated by elevated TNFα, as it has been shown to interfere with glucose metabolism by down-regulation of GLUT4, to inhibit insulin sensitivity through JNK activation (Hirosumi et al., 2002; Lumeng et al., 2007b; Ruan et al., 2002) and to cause lipolysis by suppression of perilipin expression (Laurencikiene et al., 2007). In the liver, the pro-inflammatory status increases lipogenesis. The induction of ACC2 further suppresses fatty acid catabolism. The combined effect leads to increased TG accumulation. Although insulin signaling in the liver showed no difference at the time of examination, the deregulated fat metabolism will likely worsen hepatic insulin resistance in Mac-PPARδ−/− mice at a later stage. We did not observe changes in inflammatory or metabolic genes in muscle (Figure S3 and data not shown). This was not unexpected, as we were unable to detect an appreciable amount of IL-13 or IL-4 by ELISA in muscle (data not shown). The metabolic phenotype of Mac-PPARδ−/− mice was less profound on a chow diet. These mice showed mild glucose intolerance and insulin resistance compared to WT controls determined by the GTT and ITT (Figure S4A and B). There was no significant difference in the expression of M1 and M2 markers in WAT, liver or muscle (data not shown). However, the presence of adipocytes surrounded by macrophages and hepatic lipid accumulation was observed in Mac-PPARδ−/− mice (Figure S4C and D). These results suggest that in the unchallenged, lean state, other signaling pathways are capable of maintaining basal M2 gene expression. Nevertheless, it appears that even a minor shift in the resident macrophage polarization is sufficient to induce metabolic dysregulation.
One of the potential signaling pathways known to modulate M2 activation is through PPARγ, which when deleted in myeloid cells, causes insulin resistance in multiple tissues (Hevener et al., 2007; Odegaard et al., 2007). However, our data suggest that PPARγ could not compensate for the loss of PPARδ. In fact, PPARδ/γ−/−macrophages show a similar defect in Mgl1 expression to that of PPARδ−/− macrophages. A similar result was seen in Mgl2 expression (data not shown). It is possible that PPARγ plays a predominant role in circulating monocytes, as it has been shown that PPARγ activation induces monocyte differentiation into M2 macrophages but does not affect resting macrophages (Bouhlel et al., 2007). Alternatively, PPARδ may act as a competent factor for Th2 cytokine-induced M2 gene expression. Evidence supporting this idea comes from the observation that the ability of IL-13 to up-regulate Mgl1 promoter activity is highly dependent on PPARδ (Figure 7B). In addition, STAT6 activation and IL-4R induction by Th2 cytokines is diminished in PPARδ−/− macrophages (Figure 1), which remains intact in PPARγ−/− macrophages (Odegaard et al., 2007). PPARδ may do so by controlling the expression of PGC-1β (Figure 1C and S1A), which has been shown to co-activate STAT6 (Vats et al., 2006) and may also be required for the full transcriptional activity of PPARγ. However, we could not rule out the possibility that PPARδ and PPARγ controls different subsets of M2 genes.
Adipocytes and hepatocytes are unique in the way that they are capable of producing both Th1 and Th2 cytokines. The balance in the production of these two counter forces therefore determines the polarization of macrophages residing in WAT and liver. The current study identifies PPARδ as a potential drug target to modulate tissue macrophage activation and insulin sensitivity. Understanding how Th1 and Th2 cytokine production is controlled in adipocytes and hepatocytes in future studies may also reveal additional therapeutic pathways to combat obesity-related metabolic diseases.
Experimental Procedures
Animal Experiments
The PPARδ and PPARγ flox allele was generated as described previously (Barak et al., 2002; Barak et al., 1999). PPARδ f/f, PPARδ/γ f/f and lysozyme-Cre transgenic mice (obtained from The Jackson laboratory) were in the C57BL/6 background. The chow diet study was conducted in 9 month-old male mice (n=5). For the high fat feeding study, 3 month-old male mice (n=7) were placed on a high-fat, high-carbohydrate diet (F3282, Bio-Serv, Frenchtown, NJ) for 4 months. The GTT was performed by injecting 1 g glucose/kg body weight into the peritoneum. Blood glucose was measured before and after injection at the time course indicated by using the OneTouch glucose monitoring system (Lifescan, Milpitas, CA). The ITT was conducted similarly by injecting 0.7 u insulin/kg body weight. For determining insulin signaling in vivo, insulin (5u/kg body weight) was injected through the portal vein. A piece of liver, epididymal fat pad and muscle was collected before and 5 min after insulin injection and rapidly stored in liquid nitrogen. The metabolic phenotypes were reproduced in a second cohort (n=5–7, data not shown). Serum and hepatic triglyceride, free fatty acid, total cholesterol were measured using commercial kits (Wako Chemicals and ThermoDMA). Insulin levels were measured using ELISA kits (Linco, St. Charles, MO). All of the histology work was performed at the Dana Farber Research Pathology Cores, which also provided preliminary histological assessment by a pathologist. Statistics was performed using Student’s t-Test (2-tailed). Values were presented as means ± SEM. Significance was established at p<0.05. Animal studies were approved by the Harvard Medical Area Standing Committee on Animals.
Cell culture
Bone marrow derived macrophages were differentiated in L929 conditioned medium as described previously (Lee et al., 2003a). PPARδ−/− and PPARδ/γ−/− macrophages were obtained from Mac-PPARδ−/− and Mac- PPARδ/γ−/− mice, respectively. Experiments were conducted in DMEM (low glucose), 10% FBS. 3T3-L1 and 3T3 F442A adipocytes were differentiated in a cocktail containing insulin, isobutylmethylxanthine and dexamethason based on a standard protocol (Tontonoz et al., 1994). Conditioned medium was collected from fully differentiated adipocytes, which have been cultured in DMEM, 10% FBS in the absence of differentiation cocktail for 2 days. Goat anti-mouse IL-13 neutralization antibody was added to conditioned medium based on the ND50 provided by the manufacturer (R & D Systems). Goat IgG was added to the same concentration in the control experiment, which had no effect on macrophage activation at the dose used. For co-culture experiments, macrophages were grown in an insert and placed into a well containing adipocytes or hepatocytes (Transwell, Corning). Two days after co-culturing, macrophages and adipocytes/hepatocytes were collected separately for various assays. The transmigration of macrophages from the upper to the lower compartment was minimal as determined by the expression of F4/80 in adipocytes/hepatocytes. Hepatocytes were isolated by collagenase perfusion.
In vitro metabolic assays
The glucose uptake assay was conducted using 2-3H-deoxy-D-glucose in Krebs-Ringer bicarbonate HEPES (KRBH) buffer. Cells were pre-stimulated with 100 nM insulin for 10 min, followed by the addition of radioactive glucose. Glucose uptake was determined within 20 min and normalized to protein content. For lipolysis, primary adipocytes were isolated by collagenase digestion and filtered through 250 μM nylon mesh. Cells were suspended in KRBH buffer with or without 10 μM isoproterenol for 1 hour. The rate of lipolysis was determined by glycerol release in the medium. Fatty acid oxidation was conducted as described (Lee et al., 2006a).
Expression analyses
For gene expression, SYBR green based real time RT-PCR reactions were conducted as described, using 36B4 levels as loading controls to obtain relative expression levels (Lee et al., 2006b). For Western blot analyses, tissue or cell lysates were prepared in a buffer containing protease and phosphatase inhibitors. To determine tyrosine phosphorylation of IRβ, WAT lyastes were first immnuoprecipitated with an anti-IRβ antibody, followed by immnuoblotting with an anti-phospho-tyrosine antibody or total IRβ antibody. Antibodies against Akt, JNK, STAT6 and phospho-tyrosine were purchased from Cell Signaling and IRβ, GLUT4 and actin from Santa Cruz. IL-13 and IL4 antibodies and ELISA kits were obtained from R & D Systems. For report assays, a 2kb fragment containing either mouse PPARδ or Mgl1 promoter region was cloned into the pGL3-basic vector (Promega). Co-transfection was conducted in RAW264.7 cells in a 48-well format using the dual luciferase system (Promega). Both mouse PPARδ and human RXRα expression vectors were under the control of a CMV promoter. Concentrations used were: GW501516: 0.1μM; rosiglitazone: 1 μM; IL-13: 40 ng/ml.
Supplementary Material
Acknowledgments
We thank P. Olson for valuable comments and S.E. Calay for technical assistance. 3T3 F442A pre-adipocytes were a gift from Dr. Hotamisligil (Harvard School of Public Health). K. Kang was supported by NIH Roadmap training grant (R90DK071507) and S.M. Reilly by NIEHS training grant (T32ES07155). B. Hatano was supported by funds from the Japan Self Defense Forces Central Hospital. This work was supported in part by the Harvard Digestive Diseases Center (NIH grant P30 DK34845) and by American Heart Association, American Diabetes Association and NIH grant (R01DK075046) (C.-H.L.).
Footnotes
Publisher's Disclaimer: This is a PDF file of an unedited manuscript that has been accepted for publication. As a service to our customers we are providing this early version of the manuscript. The manuscript will undergo copyediting, typesetting, and review of the resulting proof before it is published in its final citable form. Please note that during the production process errors may be discovered which could affect the content, and all legal disclaimers that apply to the journal pertain.
References
- Abu-Elheiga L, Matzuk MM, Abo-Hashema KA, Wakil SJ. Continuous fatty acid oxidation and reduced fat storage in mice lacking acetyl-CoA carboxylase 2. Science. 2001;291:2613–2616. doi: 10.1126/science.1056843. [DOI] [PubMed] [Google Scholar]
- Barak Y, Liao D, He W, Ong ES, Nelson MC, Olefsky JM, Boland R, Evans RM. Effects of peroxisome proliferator-activated receptor delta on placentation, adiposity, and colorectal cancer. Proc Natl Acad Sci U S A. 2002;99:303–308. doi: 10.1073/pnas.012610299. [DOI] [PMC free article] [PubMed] [Google Scholar]
- Barak Y, Nelson MC, Ong ES, Jones YZ, Ruiz-Lozano P, Chien KR, Koder A, Evans RM. PPAR gamma is required for placental, cardiac, and adipose tissue development. Mol Cell. 1999;4:585–595. doi: 10.1016/s1097-2765(00)80209-9. [DOI] [PubMed] [Google Scholar]
- Barish GD, Atkins AR, Downes M, Olson P, Chong LW, Nelson M, Zou Y, Hwang H, Kang H, Curtiss L, et al. PPAR{delta} regulates multiple proinflammatory pathways to suppress atherosclerosis. Proc Natl Acad Sci U S A. 2008;105:4271–4276. doi: 10.1073/pnas.0711875105. [DOI] [PMC free article] [PubMed] [Google Scholar]
- Bouhlel MA, Derudas B, Rigamonti E, Dievart R, Brozek J, Haulon S, Zawadzki C, Jude B, Torpier G, Marx N, et al. PPARgamma activation primes human monocytes into alternative M2 macrophages with anti-inflammatory properties. Cell Metab. 2007;6:137–143. doi: 10.1016/j.cmet.2007.06.010. [DOI] [PubMed] [Google Scholar]
- Charo IF. Macrophage polarization and insulin resistance: PPARgamma in control. Cell Metab. 2007;6:96–98. doi: 10.1016/j.cmet.2007.07.006. [DOI] [PubMed] [Google Scholar]
- Cramer T, Yamanishi Y, Clausen BE, Forster I, Pawlinski R, Mackman N, Haase VH, Jaenisch R, Corr M, Nizet V, et al. HIF-1alpha is essential for myeloid cell-mediated inflammation. Cell. 2003;112:645–657. doi: 10.1016/s0092-8674(03)00154-5. [DOI] [PMC free article] [PubMed] [Google Scholar]
- Desvergne B, Wahli W. Peroxisome proliferator-activated receptors: nuclear control of metabolism. Endocr Rev. 1999;20:649–688. doi: 10.1210/edrv.20.5.0380. [DOI] [PubMed] [Google Scholar]
- Gasic S, Tian B, Green A. Tumor necrosis factor alpha stimulates lipolysis in adipocytes by decreasing Gi protein concentrations. J Biol Chem. 1999;274:6770–6775. doi: 10.1074/jbc.274.10.6770. [DOI] [PubMed] [Google Scholar]
- Gordon S. Alternative activation of macrophages. Nat Rev Immunol. 2003;3:23–35. doi: 10.1038/nri978. [DOI] [PubMed] [Google Scholar]
- Hevener AL, Olefsky JM, Reichart D, Nguyen MT, Bandyopadyhay G, Leung HY, Watt MJ, Benner C, Febbraio MA, Nguyen AK, et al. Macrophage PPAR gamma is required for normal skeletal muscle and hepatic insulin sensitivity and full antidiabetic effects of thiazolidinediones. J Clin Invest. 2007;117:1658–1669. doi: 10.1172/JCI31561. [DOI] [PMC free article] [PubMed] [Google Scholar]
- Hirosumi J, Tuncman G, Chang L, Gorgun CZ, Uysal KT, Maeda K, Karin M, Hotamisligil GS. A central role for JNK in obesity and insulin resistance. Nature. 2002;420:333–336. doi: 10.1038/nature01137. [DOI] [PubMed] [Google Scholar]
- Hotamisligil GS. Inflammation and metabolic disorders. Nature. 2006;444:860–867. doi: 10.1038/nature05485. [DOI] [PubMed] [Google Scholar]
- Kang K, Hatano B, Lee CH. PPARdelta Agonists and Metabolic Diseases. Curr Atheroscler Rep. 2007;9:72–77. doi: 10.1007/BF02693931. [DOI] [PubMed] [Google Scholar]
- Kim JW, Tchernyshyov I, Semenza GL, Dang CV. HIF-1-mediated expression of pyruvate dehydrogenase kinase: a metabolic switch required for cellular adaptation to hypoxia. Cell Metab. 2006;3:177–185. doi: 10.1016/j.cmet.2006.02.002. [DOI] [PubMed] [Google Scholar]
- Laurencikiene J, van Harmelen V, Arvidsson Nordstrom E, Dicker A, Blomqvist L, Naslund E, Langin D, Arner P, Ryden M. NF-kappaB is important for TNF-alpha-induced lipolysis in human adipocytes. J Lipid Res. 2007;48:1069–1077. doi: 10.1194/jlr.M600471-JLR200. [DOI] [PubMed] [Google Scholar]
- Lee CH, Chawla A, Urbiztondo N, Liao D, Boisvert WA, Evans RM, Curtiss LK. Transcriptional repression of atherogenic inflammation: modulation by PPARdelta. Science. 2003a;302:453–457. doi: 10.1126/science.1087344. [DOI] [PubMed] [Google Scholar]
- Lee CH, Kang K, Mehl IR, Nofsinger R, Alaynick WA, Chong LW, Rosenfeld JM, Evans RM. Peroxisome proliferator-activated receptor {delta} promotes very low-density lipoprotein-derived fatty acid catabolism in the macrophage. Proc Natl Acad Sci USA. 2006a doi: 10.1073/pnas.0510815103. [DOI] [PMC free article] [PubMed] [Google Scholar]
- Lee CH, Olson P, Evans RM. Minireview: lipid metabolism, metabolic diseases, and peroxisome proliferator-activated receptors. Endocrinology. 2003b;144:2201–2207. doi: 10.1210/en.2003-0288. [DOI] [PubMed] [Google Scholar]
- Lee CH, Olson P, Hevener A, Mehl I, Chong LW, Olefsky JM, Gonzalez FJ, Ham J, Kang H, Peters JM, Evans RM. PPAR{delta} regulates glucose metabolism and insulin sensitivity. Proc Natl Acad Sci U S A. 2006b doi: 10.1073/pnas.0511253103. [DOI] [PMC free article] [PubMed] [Google Scholar]
- Londos C, Sztalryd C, Tansey JT, Kimmel AR. Role of PAT proteins in lipid metabolism. Biochimie. 2005;87:45–49. doi: 10.1016/j.biochi.2004.12.010. [DOI] [PubMed] [Google Scholar]
- Lumeng CN, Bodzin JL, Saltiel AR. Obesity induces a phenotypic switch in adipose tissue macrophage polarization. J Clin Invest. 2007a;117:175–184. doi: 10.1172/JCI29881. [DOI] [PMC free article] [PubMed] [Google Scholar]
- Lumeng CN, Deyoung SM, Saltiel AR. Macrophages block insulin action in adipocytes by altering expression of signaling and glucose transport proteins. Am J Physiol Endocrinol Metab. 2007b;292:E166–174. doi: 10.1152/ajpendo.00284.2006. [DOI] [PMC free article] [PubMed] [Google Scholar]
- Mantovani A, Sica A, Sozzani S, Allavena P, Vecchi A, Locati M. The chemokine system in diverse forms of macrophage activation and polarization. Trends Immunol. 2004;25:677–686. doi: 10.1016/j.it.2004.09.015. [DOI] [PubMed] [Google Scholar]
- Odegaard JI, Ricardo-Gonzalez RR, Goforth MH, Morel CR, Subramanian V, Mukundan L, Eagle AR, Vats D, Brombacher F, Ferrante AW, Chawla A. Macrophage-specific PPARgamma controls alternative activation and improves insulin resistance. Nature. 2007;447:1116–1120. doi: 10.1038/nature05894. [DOI] [PMC free article] [PubMed] [Google Scholar]
- Oliver WR, Jr, Shenk JL, Snaith MR, Russell CS, Plunket KD, Bodkin NL, Lewis MC, Winegar DA, Sznaidman ML, Lambert MH, et al. A selective peroxisome proliferator-activated receptor delta agonist promotes reverse cholesterol transport. Proc Natl Acad Sci U S A. 2001;98:5306–5311. doi: 10.1073/pnas.091021198. [DOI] [PMC free article] [PubMed] [Google Scholar]
- Qatanani M, Lazar MA. Mechanisms of obesity-associated insulin resistance: many choices on the menu. Genes Dev. 2007;21:1443–1455. doi: 10.1101/gad.1550907. [DOI] [PubMed] [Google Scholar]
- Reilly SM, Lee CH. PPAR delta as a therapeutic target in metabolic disease. FEBS Lett. 2008;582:26–31. doi: 10.1016/j.febslet.2007.11.040. [DOI] [PMC free article] [PubMed] [Google Scholar]
- Rosen ED, Spiegelman BM. Adipocytes as regulators of energy balance and glucose homeostasis. Nature. 2006;444:847–853. doi: 10.1038/nature05483. [DOI] [PMC free article] [PubMed] [Google Scholar]
- Ruan H, Hacohen N, Golub TR, Van Parijs L, Lodish HF. Tumor necrosis factor-alpha suppresses adipocyte-specific genes and activates expression of preadipocyte genes in 3T3-L1 adipocytes: nuclear factor-kappaB activation by TNF-alpha is obligatory. Diabetes. 2002;51:1319–1336. doi: 10.2337/diabetes.51.5.1319. [DOI] [PubMed] [Google Scholar]
- Schuler M, Ali F, Chambon C, Duteil D, Bornert JM, Tardivel A, Desvergne B, Wahli W, Chambon P, Metzger D. PGC1alpha expression is controlled in skeletal muscles by PPARbeta, whose ablation results in fiber-type switching, obesity, and type 2 diabetes. Cell Metab. 2006;4:407–414. doi: 10.1016/j.cmet.2006.10.003. [DOI] [PubMed] [Google Scholar]
- Seagroves TN, Ryan HE, Lu H, Wouters BG, Knapp M, Thibault P, Laderoute K, Johnson RS. Transcription factor HIF-1 is a necessary mediator of the pasteur effect in mammalian cells. Mol Cell Biol. 2001;21:3436–3444. doi: 10.1128/MCB.21.10.3436-3444.2001. [DOI] [PMC free article] [PubMed] [Google Scholar]
- Shi H, Kokoeva MV, Inouye K, Tzameli I, Yin H, Flier JS. TLR4 links innate immunity and fatty acid-induced insulin resistance. J Clin Invest. 2006;116:3015–3025. doi: 10.1172/JCI28898. [DOI] [PMC free article] [PubMed] [Google Scholar]
- Sonoda J, Laganiere J, Mehl IR, Barish GD, Chong LW, Li X, Scheffler IE, Mock DC, Bataille AR, Robert F, et al. Nuclear receptor ERR alpha and coactivator PGC-1 beta are effectors of IFN-gamma-induced host defense. Genes Dev. 2007;21:1909–1920. doi: 10.1101/gad.1553007. [DOI] [PMC free article] [PubMed] [Google Scholar]
- Souza SC, de Vargas LM, Yamamoto MT, Lien P, Franciosa MD, Moss LG, Greenberg AS. Overexpression of perilipin A and B blocks the ability of tumor necrosis factor alpha to increase lipolysis in 3T3-L1 adipocytes. J Biol Chem. 1998;273:24665–24669. doi: 10.1074/jbc.273.38.24665. [DOI] [PubMed] [Google Scholar]
- Tanaka T, Yamamoto J, Iwasaki S, Asaba H, Hamura H, Ikeda Y, Watanabe M, Magoori K, Ioka RX, Tachibana K, et al. Activation of peroxisome proliferator-activated receptor delta induces fatty acid beta-oxidation in skeletal muscle and attenuates metabolic syndrome. Proc Natl Acad Sci U S A. 2003;100:15924–15929. doi: 10.1073/pnas.0306981100. [DOI] [PMC free article] [PubMed] [Google Scholar]
- Tontonoz P, Hu E, Spiegelman BM. Stimulation of adipogenesis in fibroblasts by PPAR gamma 2, a lipid-activated transcription factor. Cell. 1994;79:1147–1156. doi: 10.1016/0092-8674(94)90006-x. [DOI] [PubMed] [Google Scholar]
- Vats D, Mukundan L, Odegaard JI, Zhang L, Smith KL, Morel CR, Wagner RA, Greaves DR, Murray PJ, Chawla A. Oxidative metabolism and PGC-1beta attenuate macrophage-mediated inflammation. Cell Metab. 2006;4:13–24. doi: 10.1016/j.cmet.2006.05.011. [DOI] [PMC free article] [PubMed] [Google Scholar]
- Wang YX, Lee CH, Tiep S, Yu RT, Ham J, Kang H, Evans RM. Peroxisome-proliferator-activated receptor delta activates fat metabolism to prevent obesity. Cell. 2003;113:159–170. doi: 10.1016/s0092-8674(03)00269-1. [DOI] [PubMed] [Google Scholar]
- Weisberg SP, McCann D, Desai M, Rosenbaum M, Leibel RL, Ferrante AW., Jr Obesity is associated with macrophage accumulation in adipose tissue. J Clin Invest. 2003;112:1796–1808. doi: 10.1172/JCI19246. [DOI] [PMC free article] [PubMed] [Google Scholar]
- Xu H, Barnes GT, Yang Q, Tan G, Yang D, Chou CJ, Sole J, Nichols A, Ross JS, Tartaglia LA, Chen H. Chronic inflammation in fat plays a crucial role in the development of obesity-related insulin resistance. J Clin Invest. 2003;112:1821–1830. doi: 10.1172/JCI19451. [DOI] [PMC free article] [PubMed] [Google Scholar]
Associated Data
This section collects any data citations, data availability statements, or supplementary materials included in this article.