

Abstract
The measurement of the aflatoxin B1-lysine serum albumin adduct in human blood samples is the most facile biomarker for the assessment of chronic and consistent exposure to this carcinogen. Many technologies have been developed for the specific measurement of this protein adduct including immunoassays, HPLC with fluorescence detection and a newly developed isotope-dilution mass spectrometry method. Irrespective of the technology used to determine this adduct level, an important question remains about the long-term stability of this damage product in stored samples. To address this issue, nineteen human serum samples that had been previously analyzed for the aflatoxin B1-lysine adduct by HPLC-fluorescence in 1989 were reanalyzed by isotope dilution mass spectrometry after the many years of storage at −80°C. The adduct concentrations measured by these two techniques were identical within 4% over the range 5–100 pg aflatoxin B1-lysine /mg albumin. In addition, the specific chemical structure of the aflatoxin B1-lysine adduct in human samples was confirmed for the first time by collision-induced dissociation full scan mass spectrometry analysis of the protonated adduct molecular ion. These results illustrate that the specific aflatoxin B1-lysine serum albumin adduct can be stable in human serum stored at −80° C since 1989 and this provides confidence for the measurement of this biomarker in repository samples from many epidemiological investigations.
Keywords: aflatoxin, serum, albumin, adduct, stability, isotope dilution, fluorescence, molecular dosimetry
Introduction
Dietary exposure to the mycotoxin aflatoxin B1 (AFB1) is an important risk factor for the development of hepatocellular cancer in Asia and Africa (1). AFB1 is oxidized by cytochrome P450s to two epoxides one of which can react with double stranded DNA to form mutagenic AFB1-N7-guanine adducts (2, 3). In addition, hydrolysis products of these epoxides can react with the ε-amino group of lysine in serum albumin (AFB1-lys) (4, 5). Since the half-life of human serum albumin is approximately twenty days, chronic AFB1 exposure leads to the accumulation of albumin adducts up to thirty-fold higher than that resulting from a single exposure (6–8).
Immunoassays, HPLC with fluorescence detection and isotope dilution mass spectrometry (IDMS) have been used to measure serum albumin adduct concentrations and assess aflatoxin exposure status in epidemiological studies (9–12). Aflatoxin-albumin adduct concentrations measured by ELISA are well correlated with AFB1-lys concentrations measured by HPLC-fluorescence and IDMS, albeit the levels obtained in a recent study found that values using an ELISA were 2.6-fold higher than those measured in the same samples by IDMS (12, 13). The specific AFB1-lys adduct has been demonstrated to be present in rat albumin by full scan and tandem mass spectrometry, such confirmatory spectra have not been reported for human albumin samples collected in exposed populations (8, 13). Thus, in the work reported in this study, we report the confirmation of this adduct by full scan collision induced dissociation mass spectrometric analysis using a recently developed procedure (12, 14). Further, we have explored the question of the long-term stability of this protein adduct in stored samples where the concentrations had been determined using HPLC with fluorescence detection (11). These results illustrate that the AFB1-lys serum albumin adduct can be stable in human serum stored at −80° C since 1989 and this provides confidence for the measurement of this biomarker in repository samples.
Materials and methods
Chemicals
AFB1 and human serum albumin were purchased from Sigma-Aldrich (MO, USA). Pronase (120 kU/g) was purchased from Calbiochem-Novabiochem (CA, USA). Mixed mode solid phase extraction (SPE) cartridges (Oasis MAX) were obtained from the Waters Corp. (MA, USA).
Synthesis of AFB1-lys and AFB1-D4-lys standards
AFB1-lys and the tetra-deuterated (D4) lysine internal standard (ISTD) AFB1-D4-lys were prepared for mass spectrometric assays and chromatographically purified as previously described (12, 13).
Human sample collection and preparation
The remaining serum from nineteen human samples from a previous study in the People’s Republic of China were used in the current study (10). Dietary exposure to AFB1 and the concentrations of albumin and AFB1-lys, determined by HPLC with fluorescence detection, were previously reported (11).
Isotope dilution mass spectrometric determination of AFB1-lys
Serum was analyzed using a minor variation of the method reported by McCoy and colleagues (15). Serum (100 µL, ~ 4 mg albumin) was mixed with ISTD (100 µL × 2 ng AFB1-D4-lys/mL) and Pronase solution (250 µL, 13 mg/mL PBS) and incubated for 4.5 hrs at 37°C. SPE processed samples were analyzed by HPLC with mass spectrometric detection using a ThermoElectron TSQ Quantum Ultra operated in the positive electrospray ionization SRM mode. The ISTD parent molecular ion ((M+H)+, m/z 461.3) fragmented to yield an ion at m/z 398.2. The AFB1-lys molecular ion (m/z 457.2) fragmented to yield an ion at m/z 394.1. A 12 point isotopic dilution standard curve was generated by triplicate injection (100 µL) of AFB1-D4-lys (200 pg) mixed with varying amounts of AFB1-lys (0 – 2.9 ng) prepared via three-fold serial dilutions. The data was fitted using the method of least-squares with a 1/X weighting factor. The isotope dilution standard curve was linear over the range a 0.5 pg – 2.9 ng AFB1-lys injected onto the column in 100 µL (R2 = 0.9995). The coefficient of variation was 20% when 0.5 pg of AFB1-lys was injected.
Collision induced dissociation mass spectra of synthetic AFB1-lys and authentic AFB1-lys isolated from archived human serum
AFB1-lys was isolated from a pronase digest of a pooled human serum sample (1 mL) using the same chromatographic conditions as those used to detect AFB1-lys in the IDMS assay. The pooled sample was prepared by combining aliquots of the nineteen serum samples assayed for AFB1-lys. The average CID profile spectrum of the parent molecular ion (m/z 457.2) was acquired over the range m/z 80–500 using a Thermo-Finnigan TSQ Quantum Ultra operated in the ESI positive ionization mode. Q1 = Q3 = 0.7 m/z, scan time 0.33, Q2 gas (Ar) pressure 1.5 mTorr, Vs = 4.2 kV, collision energy 33 eV, capillary temp = 300°C, sheath pressure 49, auxillary pressure 22, capillary offset 35 V.
Results
Collision induced dissociation (CID) mass spectrometry was used to provide confirmation of the formation of the AFB1-lys in human samples obtained from a molecular epidemiologic investigation of a high-risk population for liver cancer. The CID spectra of synthetic AFB1-lys and the authentic compound isolated from pooled human sera are presented in Figure 1. Fragmentation of the protonated molecular ion (M+H)+ at m/z 457 from both the synthetic and in vivo samples produces (M+H-CO-H2O)+ at m/z 411 and (M+H-CO-H2O-NH3)+ at m/z 394. The fragment ion at m/z 328 is produced by cleavage of the C6-Nε bond and ion trap mass spectrometric studies previously revealed it undergoes fragmentation with the loss of NH3 to yield the ion at m/z 311 (13, 16). Fragmentation of the lysine moiety yields the immonium-NH3 ion at m/z 84. The base peak (M+H-H2O-CO-NH3)+ at m/z 394 was used to quantitatively analyze AFB1-lys in subsequent IDMS analyses.
Fig. 1.
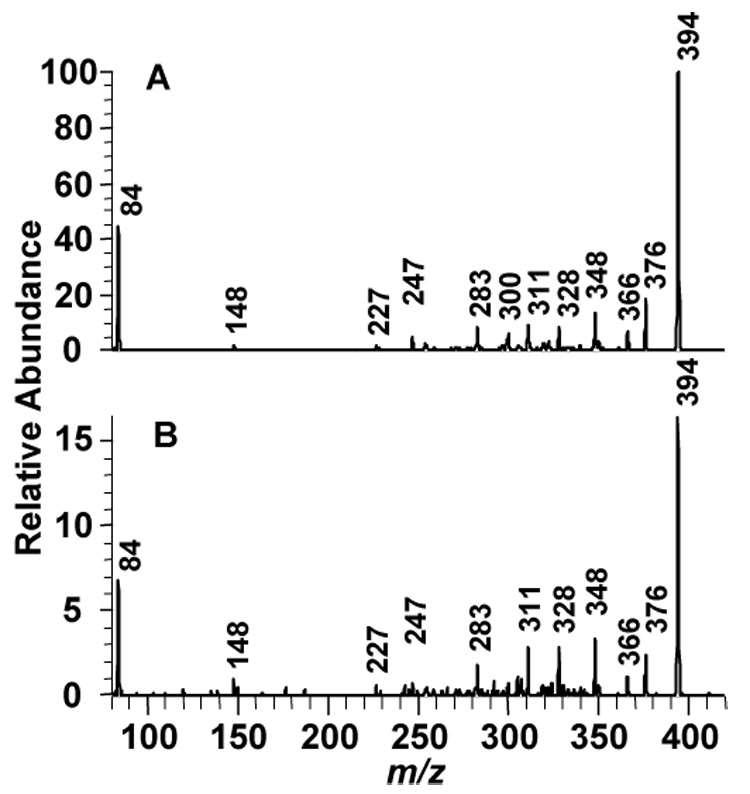
Collision induced dissociation mass spectra of the protonated molecular ion of AFB1-lys (m/z 457). A. Synthetic. B. Isolated from human serum.
Using the mass spectrometry technique, the association of AFB1-lys concentrations measured by IDMS with those measured by HPLC with fluorescence detection was examined. Representative single reaction monitoring chromatograms from IDMS analyses are presented in Figure 2. The correlation of AFB1-lys concentrations previously measured by HPLC with fluorescence detection with those measured by IDMS is presented in Figure 3 (11). A least-squares fit of the data demonstrates the IDMS method systematically detects 24% more AFB1-lys than reported in the original HPLC-fluorescence analysis. Nonetheless, the consistent association between these two analytic methods demonstrate the stability of the aflatoxin adduct in serum albumin over a nearly 20 year period of storage and subsequent measurements.
Fig. 2.
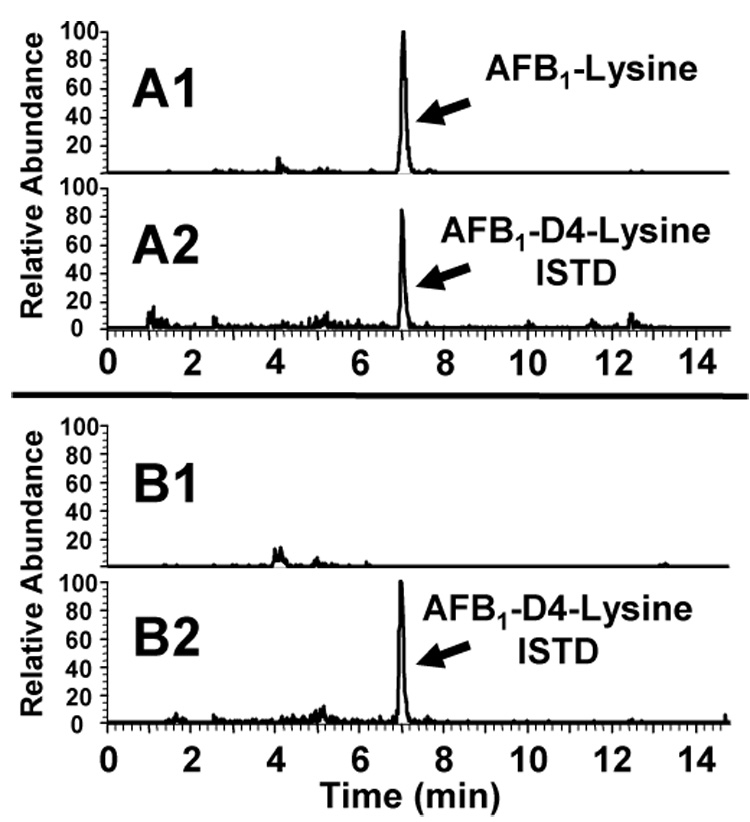
Chromatographic separation and selected reaction monitoring (SRM) chromatograms of AFB1-lys in an archival human serum sample. Top Panels. Archived human serum (139 pg AFB1-lys/mg albumin). A1. AFB1-lys SRM (m/z 457 to 394). A2. Internal standard channel. AFB1-D4-lys SRM (m/z 461 to 398). 100% relative abundance = 1 × 10⁵. Bottom Panels. Non-detection of AFB1-lys in archived human serum. B1. AFB1-lys SRM (m/z 457 to 394). B2. AFB1-D4-lys SRM (m/z 461 to 398). 100% relative abundance = 3 × 10⁴.
Fig. 3.
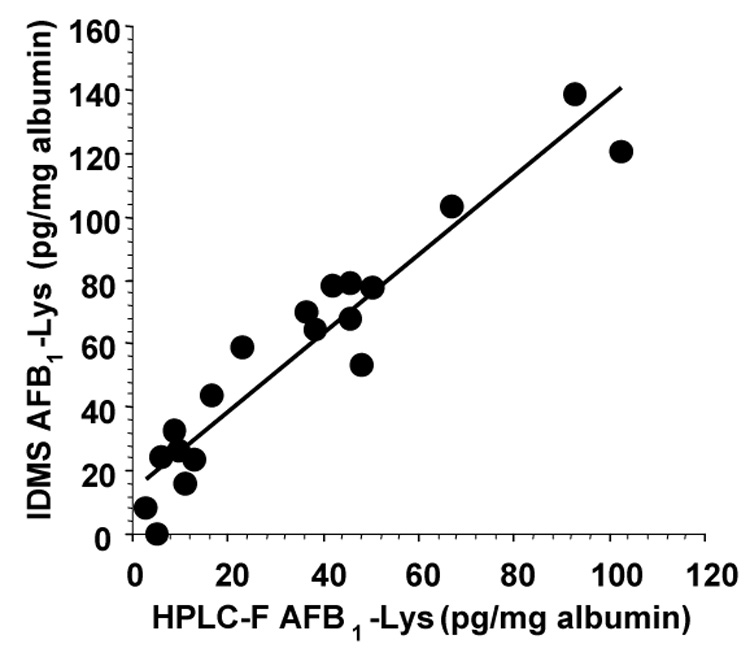
Comparison of HPLC-fluorescence and IDMS measurement of AFB1-lys concentrations in samples stored for nineteen years at −80°C. The least squares fit presented is described by the equation y = 1.24 + 13.74 (R2 = 0.91). Correction of the published AFB1-lys concentrations measured by HPLC-fluorescence for an 80% estimated method recovery yields a regression line described by the equation y = 0.99x + 13.74 (R2 = 0.91).
Discussion
The use of AFB1 serum albumin adducts as exposure biomarkers in molecular epidemiologic studies of liver cancer has become a standard for these investigations over the past 20 years (17). The validation of this biomarker was first performed in experimental models in rats (7, 8). Subsequently, mass spectrometric analysis of pronase digested albumin from rats treated with AFB1 contributed to identification of the adduct’s chemical structure as AFB1-lys (4, 5, 8). These findings provided the rationale for the development of immunoassays, HPLC with fluorescence detection and mass spectrometry for this protein adduct detection and measurement. A very sensitive ELISA was developed for aflatoxin albumin adducts that has been validated and this method continues to have the highest throughput for large scale studies (9, 12, 18, 19).
In the work reported here, we have taken advantage of human samples that had been analyzed by HPLC-fluorescence assay for specific AFB1-lys in 1989 to provide a perspective for the long-term stability of these adducts. These serum samples were reanalyzed using IDMS after being stored at −80°C for over fifteen years (10, 11). Inter-comparison of concentrations measured using the two different methods provided a unique opportunity to evaluate AFB1-lys adduct stability and gain insight on the selection of analytical methods for use in aflatoxin exposure studies. The close tracking in the comparison of these two data sets provides confidence that the AFB1-lys adduct is stable in stored serum samples for long periods of time.
The least squares fit of AFB1-lys concentrations measured by fluorescence and IDMS in this study provides descriptive information about the relative performance of these methods if the adduct did not significantly degrade during storage. The slope indicates the IDMS method systematically detects, on average, 24% more adduct than the fluorescence method. The internal standard used in the IDMS assay provides adduct concentrations that are corrected for losses of AFB1-lys during sample handling and ion suppression effects that could otherwise affect its quantitative analyses. The HPLC-fluorescence method did not utilize an internal standard. Neither method is corrected for potential artifacts due to inter-sample differences in the efficiency of the pronase digestion of albumin (15). Although the reported AFB1-lys concentrations measured by HPLC-fluorescence were not corrected for sample recovery, the method recovery was estimated in the original report to be ~80% (11). After correction of the HPLC-fluorescence measured adduct concentrations by an 80% recovery estimate, correlation the IDMS data results in a slope = 0.99 without significantly changing the y-intercept, thus indicating the same AFB1-lys concentrations are measured by both methods.
The measurement of equivalent AFB1-lys concentrations by IDMS and HPLC with fluorescence detection indicates the AFB1-lys-albumin adduct is stable in human serum samples stored for fifteen years at −80°C. If more than approximately ~6% of the AFB1-lys degraded during storage in some or all of these samples, the systematic correspondence between concentrations measured using the two methods would not have been directly accounted for by the 80% recovery of the HPLC-fluorescence method. Degradation of AFB1-lys in these serum samples between the time of their initial collection in 1983 and their initial analysis by HPLC with fluorescence detection in 1989 can not be ruled out. However, the correspondence between AFB1-lys concentrations measured after over fifteen years suggests it was stable for over twenty-four years.
These samples also provided the opportunity to use a current method to determine the structure of the aflatoxin protein adduct by mass spectrometry. The sensitivity of current mass spectrometry methods is at least 100 fold greater than the original studies reported for this adduct (8). The CID spectrum of synthetic AFB1-lys in this report exhibits structurally salient fragment ions at m/z 84, 311, 328, 394 and 411. These ions were also detected during the structural characterization of AFB1-lys isolated from the serum of AFB1 treated rats (13). The virtually identical appearance of the CID spectra of the co-eluting material isolated in vivo support the conclusion that AFB1-lys is present in human serum. Although aflatoxin albumin and AFB1-lys adducts have been studied for over twenty years, this is the first report of the mass spectrum of AFB1-lys in human serum samples.
These data provide a basis for the selection of immunoassays, HPLC-fluorescence and mass spectrometry methods for the measurement of albumin adducts and justification for the use of archived serum in aflatoxin exposure studies in people. Although the IDMS assay is more sensitive and specific than the other assays, the high cost of mass spectrometric instrumentation make it more expensive than the less sensitive HPLC-fluorescence method (9, 12, 20). Consequently, use of the IDMS method will result in higher study costs and therefore be less generally available to the research community. If the anticipated AFB1-lys serum albumin concentrations in a study population are sufficiently high (>5 pg AFB1-lys/mg albumin), the HPLC-fluorescence method may be a more cost-effective analytical tool. This study also demonstrates that over the range 5–100 pg AFB1-lys/mg albumin, these two techniques provide virtually identical results. When the requirement for specifically measuring AFB1-lys concentrations is not essential to the goals of a study, the sensitive, lower cost and potentially higher throughput ELISA assay should be considered. Although the performance of the IDMS assay has been compared to both the ELISA and HPLC-fluorescence methods in separate reports, the inter-comparison of all three assays using a single human serum sample set would be useful in guiding the selection of analytical methods for aflatoxin albumin adducts in future molecular epidemiology studies of liver cancer.
Acknowledgements
This work was supported by NIH grants P01 ES006052 and P30 ES 003819.
Abbreviations
- AFB1
aflatoxin B1
- AFB1-lys
aflatoxin B1-lysine
- IDMS
isotope-dilution mass spectrometry
References
- 1.Kensler TW, Qian GS, Chen JG, Groopman JD. Translational strategies for cancer prevention in liver. Nature Reviews. 2003;3:321–329. doi: 10.1038/nrc1076. [DOI] [PubMed] [Google Scholar]
- 2.Raney VM, Harris TM, Stone MP. DNA conformation mediates aflatoxin B 1 -DNA binding and the formation of guanine N 7 adducts by aflatoxin B 1 8,9- exo -epoxide. Chem.Res.Toxicol. 1993;6:64–68. doi: 10.1021/tx00031a010. [DOI] [PubMed] [Google Scholar]
- 3.Essigmann JM, Croy RG, Nadzan AM, Busby WF, Jr, Reinhold VN, Buchi G, Wogan GN. Structural identification of the major DNA adduct formed by aflatoxin B 1 in vitro. Proc.Natl.Acad.Sci.USA. 1977;74:1870–1874. doi: 10.1073/pnas.74.5.1870. [DOI] [PMC free article] [PubMed] [Google Scholar]
- 4.Sabbioni G. Chemical and physical properties of the major serum albumin adduct of aflatoxin B 1 and their implications for the quantification in biological samples. Chem.Biol.Interact. 1990;75:1–15. doi: 10.1016/0009-2797(90)90018-i. [DOI] [PubMed] [Google Scholar]
- 5.Guengerich FP, Arneson KO, Williams KM, Deng Z, Harris TM. Reaction of aflatoxin B 1 oxidation products with lysine. Chem.Res.Toxicol. 2002;15:780–792. doi: 10.1021/tx010156s. [DOI] [PubMed] [Google Scholar]
- 6.Wild CP, Hasegawa R, Barraud L, Chutimataewin S, Chapot B, Ito N, Montesano R. Aflatoxin-albumin adducts: a basis for comparative carcinogenesis between animals and humans. Cancer Epidemiol Biomarkers Prev. 1996;5:179–189. [PubMed] [Google Scholar]
- 7.Wild CP, Garner RC, Montesano R, Tursi F. Aflatoxin B 1 binding to plasma albumin and liver DNA upon chronic administration to rats. Carcinogenesis. 1986;7:853–858. doi: 10.1093/carcin/7.6.853. [DOI] [PubMed] [Google Scholar]
- 8.Sabbioni G, Skipper PL, B□chi G, Tannenbaum SR. Isolation and characterization of the major serum albumin adduct formed by aflatoxin B 1 in vivo in rats. Carcinogenesis. 1987;8:819–824. doi: 10.1093/carcin/8.6.819. [DOI] [PubMed] [Google Scholar]
- 9.Wild CP, Jiang YZ, Sabbioni G, Chapot B, Montesano R. Evaluation of methods for quantitation of aflatoxin-albumin adducts and their application to human exposure assessment. Cancer Res. 1990;50:245–251. [PubMed] [Google Scholar]
- 10.Gan LS, Skipper PL, Peng XC, Groopman JD, Chen JS, Wogan GN, Tannenbaum SR. Serum albumin adducts in the molecular epidemiology of aflatoxin carcinogenesis: correlation with aflatoxin B1 intake and urinary excretion of aflatoxin M1. Carcinogenesis. 1988;9:1323–1325. doi: 10.1093/carcin/9.7.1323. [DOI] [PubMed] [Google Scholar]
- 11.Sabbioni G, Ambs S, Wogan GN, Groopman JD. The aflatoxin-lysine adduct quantified by high-performance liquid chromatography from human serum albumin samples. Carcinogenesis. 1990;11:2063–2066. doi: 10.1093/carcin/11.11.2063. [DOI] [PubMed] [Google Scholar]
- 12.Scholl PF, Turner PC, Sutcliffe AE, Sylla A, Diallo MS, Friesen MD, Groopman JD, Wild CP. Quantitative comparison of aflatoxin B1 serum albumin adducts in humans by isotope dilution mass spectrometry and ELISA. Cancer Epidemiol Biomarkers Prev. 2006;15:823–826. doi: 10.1158/1055-9965.EPI-05-0890. [DOI] [PubMed] [Google Scholar]
- 13.Scholl PF, McCoy L, Kensler TW, Groopman JD. Quantitative analysis and chronic dosimetry of the aflatoxin B1 plasma albumin adduct Lys-AFB1 in rats by isotope dilution mass spectrometry. Chem Res Toxicol. 2006;19:44–49. doi: 10.1021/tx050251r. [DOI] [PubMed] [Google Scholar]
- 14.Scholl PF, Groopman JD. Synthesis of 5,5,6,6-D4-L-lysine-aflatoxin B 1 for use as a mass spectrometric internal standard. J.Labelled Compounds and Radiopharmaceuticals. 2005;47:807–815. [Google Scholar]
- 15.McCoy LF, Scholl PF, Schleicher RL, Groopman JD, Powers CD, Pfeiffer CM. Analysis of aflatoxin B1-lysine adduct in serum using isotope-dilution liquid chromatography/tandem mass spectrometry. Rapid Communications in Mass Spectrometry. 2005;19:2203–2210. doi: 10.1002/rcm.2045. [DOI] [PubMed] [Google Scholar]
- 16.Scholl PF, Mcoy L, Kensler TW, Groopman JD. Development of a quantitative LCMS method for the analysis of aflatoxin B1 serum albumin adducts. Abstracts of Papers of the American Chemical Society. 2004;228:U379–U379. [Google Scholar]
- 17.Kensler TW, Egner PA, Wang JB, Zhu Yr, Zhang BC, Qian GS, Kuang SY, Gange SJ, Jacobson LP, Munoz A, Groopman JD. Strategies for chemoprevention of liver cancer. Eur.J.Cancer Prevention. 2002;11:S58–S64. [PubMed] [Google Scholar]
- 18.Wild CP, Hudson GJ, Sabbioni G, Chapot B, Hall AJ, Wogan GN, Whittle H, Montesano R, Groopman JD. Dietary intake of aflatoxins and the level of albumin-bound aflatoxin in peripheral blood in The Gambia, West Africa. Cancer Epidemiol.Biomarkers Prev. 1992;1:229–234. [PubMed] [Google Scholar]
- 19.Turner PC, Collinson AC, Cheung YB, Gong Y, Hall AJ, Prentice AM, Wild CP. Aflatoxin exposure in utero causes growth faltering in Gambian infants. Int J Epidemiol. 2007;36:1119–1125. doi: 10.1093/ije/dym122. [DOI] [PubMed] [Google Scholar]
- 20.Strosnider H, Azziz-Baumgartner E, Banziger M, Bhat RV, Breiman R, Brune MN, DeCock K, Dilley A, Groopman J, Hell K, Henry SH, Jeffers D, Jolly C, Jolly P, Kibata GN, Lewis L, Liu X, Luber G, McCoy L, Mensah P, Miraglia M, Misore A, Njapau H, Ong CN, Onsongo MT, Page SW, Park D, Patel M, Phillips T, Pineiro M, Pronczuk J, Rogers HS, Rubin C, Sabino M, Schaafsma A, Shephard G, Stroka J, Wild C, Williams JT, Wilson D. Workgroup report: public health strategies for reducing aflatoxin exposure in developing countries. Environ Health Perspect. 2006;114:1898–1903. doi: 10.1289/ehp.9302. [DOI] [PMC free article] [PubMed] [Google Scholar]