

Abstract
Chromatic contrast thresholds for spatially varying patterns of various spatial frequencies (0.5, 1, 2, and 4 cycles per degree) were measured for ten older (65-77 yr of age) and ten younger (18-30 yr of age) observers. The stimuli were Gabor patches modulated along S-varying or (L - M)-varying chromatic axes. Thresholds were determined for two sets of stimuli. For one set of stimuli, the mean chromaticity and luminance were equated at the cornea for all observers. The second set of stimuli was corrected for ocular media density differences to equate stimulation of each of the three cone types at the retina for each individual. Chromatic contrast thresholds were higher for older observers for all stimuli tested. The magnitude of this difference showed little dependence on spatial frequency. When stimuli were equated at the cornea, this difference was greater for S-varying stimuli. When stimuli were equated at the retina, the age-related difference in thresholds for S-varying stimuli was reduced. Both optical and neural factors contribute to these age-related losses in spatial chromatic contrast sensitivity.
1. INTRODUCTION
Age-related losses in sensitivity to spatially varying luminance patterns have been demonstrated under a variety of conditions.1-3 In the realm of color vision, senescent losses in the sensitivities of the short- (S-), medium- (M-), and long- (L-) wavelength-sensitive cone mechanisms have been demonstrated,4,5 as have senescent losses in wavelength discrimination.6 These losses occur in the absence of eye disease and under conditions in which senescent reductions in pupillary area7 and increases in ocular media density are taken into account.8
Visual scenes vary spatially in chromaticity as well as in luminance. The visual system has mechanisms that selectively encode spatial information about chromatic patterns.9-11 Thus sensitivity to spatial patterns that vary in chromaticity is of interest to those who wish to understand how the visual system encodes information about the visual world.12 The capacity of the visual system to detect chromatic patterns of various spatial frequencies can be characterized by the chromatic contrast sensitivity function.13-15 A few studies have examined age-related changes in sensitivity to chromatically varying patterns.16-19 However, none of these has measured contrast sensitivity for patterns of various spatial frequencies that were purely chromatic, with chromatic aberration and individual differences in luminosity functions controlled.
Some reports have suggested that different cone pathways age at different rates. Specifically, sensitivity to stimuli that modulate the S cones may decrease at a faster rate as a function of age than sensitivity to stimuli that modulate the M or L cones.20,21 Other reports have found little or no evidence of selective losses in the S-cone pathway.5,22 A major difficulty in addressing the relative loss in sensitivity of the different cone pathways arises from senescent changes in ocular media optical density (OD) particularly lens brunescence. As a result of these processes, retinal light levels are lower for older observers than they are for younger observers viewing the same physical stimuli. This effect is largest for short-wavelength light, where the OD of the ocular media is greatest. If age-related changes in optical media OD are not taken into account, it may appear that S cones lose sensitivity at a faster rate than do M or L cones simply because relatively less light is reaching those cones. From one perspective, this conclusion is appropriate and useful. For example, in designing displays for older adults, it would be useful to know the relative effectiveness of stimuli modulated along various directions in a standard-observer color space. This more naturalistic approach is used in the companion paper, which investigates senescent changes in contrast-matching functions for chromatic and luminance patterns.23 To understand the mechanisms of age-related changes in chromatic pattern sensitivity, however, it is useful to separate optical and neural contributions to the extent possible.
Several methods have proven effective for measuring in vivo the OD of the ocular media of the human eye as a function of wavelength.24-26 If this function is known for each individual, it should be possible to correct chromatic stimuli for age-related changes in the OD of the lens and the cornea. Such a correction would allow an assessment of the sensitivity of the chromatic pathways that is independent of changes in the spectral filtering properties of the ocular media. A more complete attempt to equate chromatic stimuli at the retina would take into account macular pigment OD as well. While reports differ substantially in estimates of the relation between chronological age and macular pigment OD,4,27,28 cornea and lens changes clearly account for the largest proportion of the age-related difference in the amount of light reaching the various cone types. In the present study, optical media OD was estimated for each observer by using a variant of the method of van Norren and Vos.24 With the use of these estimates, the cone spectral sensitivities (fundamentals)29,30 were adjusted to reflect each individual's optical media density.
Chromatic contrast sensitivity functions were obtained from younger and older observers for stimuli modulated along the S-varying (tritan) and (L - M)-varying axes in color space.31,32 In one set of conditions, stimulus luminance and chromaticity values were generated from a cone contrast color space based on standard observer cone fundamentals. The mean luminance and chromaticity of these stimuli were equal for all observers. In another set of conditions, stimuli were generated from color spaces based on cone fundamentals adjusted for each individual's ocular media OD. The nominal CIE luminance and chromaticity values of these stimuli varied considerably among individuals, but the retinal cone excitations were matched for all observers based on the measured ocular media OD functions. In addition, stimuli were presented through an optical system with a small exit pupil to control for age-related changes in pupil size. With these optical factors controlled, any remaining age-related losses in chromatic contrast sensitivity would be consistent with losses in neural sensitivity.
2. METHODS
Four sets of experiments were performed for this study. The first three sets included a scotopic sensitivity measurement, a tritan-pairs matching task, and a heterochromatic flicker photometry (HFP) task. These tests were designed to isolate chromatic mechanisms for each individual. The last set of experiments measured spatial chromatic contrast sensitivity for these isolated mechanisms. All subjects participated in all experiments.
A. Observers
Ten younger (six male/four female, mean age 24 yr, range 18-30 yr) and ten older (six male/four female, mean age 73 yr, range 65-77 yr) phakic subjects participated in the study. Nine of these subjects (four younger and five older) also participated in our companion study.23 Subjects were thoroughly screened for abnormal ocular media and retinal disease. All subjects were given slit lamp examinations, and their fundus photographs were examined by a retinal specialist. Intraocular pressure was normal for all observers (<22 mm Hg). All observers were normal trichromats based on testing with the Neitz anomaloscope, the HRR pseudoisochromatic plates, and the Farnsworth F-2 plate. Written informed consent was obtained following the Tenets of Helsinki and with approval of the Office of Human Research Protection of the University of California, Davis, School of Medicine. All subjects had corrected visual acuity of 20/25 or better (Bailey-Lovie Eye Chart 4).
B. Apparatus
Stimuli for all experiments were presented in a threechannel optical system. Two channels presented stimuli in Maxwellian view, while the third channel presented stimuli from a CRT through a Keplerian telescope. All three channels had a 1.5-mm exit pupil in the plane of the observer's pupil. The source for the Maxwellian-view channels was a 300-W xenon arc lamp. In one channel, used for scotopic sensitivity measurements, a monochrometer (8-nm half-bandpass) allowed presentation of narrowband light over a range of 400-700 nm. Stimuli in this channel could be modulated at 3 Hz (square wave) with an Ithaco light chopper. The center 7° of the 15° field was blocked, leaving an annular stimulus. The light intensity produced by this channel could be adjusted by rotating a neutral-density wedge filter with a potentiometer. In the second channel, used to generate a background stimulus for the tritan-pairs matching task, an interference filter with a central wavelength of 420 nm (<8-nm half-bandpass) produced an ∼15° narrowband short-wavelength stimulus. The third channel consisted of a 2.1× magnification Keplerian telescope imaging an Eizo FlexScan T566 CRT at an angular subtense of ∼15°. This image could be superimposed on the short-wavelength field from the second Maxwellian-view channel. Stimuli for the tritan pairs, the HFP, and the chromatic contrast sensitivity experiments were presented on the CRT driven by a personal computer with a visual stimulus generator 2/4 graphics card (Cambridge Research Systems Ltd.) that allowed 15-bit resolution for each of the three phosphor channels. The subject's head position was stabilized with a bite bar on an x-y-z mount. Alignment of the observer's pupil and the exit pupil of the optical system was performed with the aid of a pupil viewer. All stimuli were viewed monocularly. Refractive error was corrected with trial lenses. The effects of axial (longitudinal) chromatic aberration were attenuated with a Powell achromatizing lens.33 The position of the achromatizing lens was adjusted for each individual's chromatic axis by having the subject move the horizontal and vertical position of the lens to align a series of horizontal and vertical, red and blue nonius lines. Subject responses were recorded with a CB3 response box (Cambridge Research Systems Ltd.).
C. Calibrations and Characterizations
Radiometric measurements of the outputs of the two Maxwellian-view channels were made with a silicon photodiode and a linear readout system (United Detector Technologies, 81 Optometer) that was calibrated relative to the standards of the National Institute of Standards and Technology. These measurements were taken for all neutral-density filters and all wavelengths used in these channels and for a large number of wedge settings spanning the range used by subjects in the scotopic sensitivity experiment. The luminance outputs of the three CRT phosphor channels were characterized with visual stimulus generator OptiCAL hardware and linearized in software. The accuracy of this linearization was confirmed with a Minolta Chroma Meter (CS-100). The Chroma Meter was also used to measure the chromaticity of the phosphor outputs and to confirm the accuracy of the chromaticity rendering of the system.
D. Scotopic Sensitivity Measurements
A scotopic spectral sensitivity function was measured for each individual to allow estimation of optical media OD following the procedure of van Norren and Vos.24 Before testing, subjects dark adapted for a minimum of 25 min. Scotopic sensitivity was measured at seven wavelengths (410, 430, 450, 470, 505, 550, 600 nm). Subjects were instructed to adjust the intensity of the light by using a potentiometer until they could “just barely see a light flickering on and off.” Subjects were allowed as much practice as necessary to obtain stable threshold settings. A minimum of five practice threshold settings was made. The geometric mean of three settings expressed in units of relative energy was taken as the detection threshold. The order in which the wavelengths were tested was randomized for each individual, but all three settings for a given wavelength were made consecutively.
E. Estimating Ocular Media Optical Density from Scotopic Sensitivity Data
The standard observer for scotopic sensitivity V′(λ) is based on data from relatively young observers and is most appropriate for individuals of approximately 25 yr of age.34 The shape of this function depends on the spectral absorption of the photopigment rhodopsin, preretinal factors such as ocular media OD, and photopigment OD. Macular pigment OD probably contributes little to the shape of this function, since the peak of rod sensitivity is outside the macula. The OD of the ocular media, especially the crystalline lens, will contribute the largest component to individual differences in this function when observers from a wide range of ages are used.25 By subtracting an individual's log scotopic sensitivity from that of the standard observer after properly scaling for differences in absolute sensitivity, one can obtain an estimate of the difference between the individual's ocular media OD and that of the standard observer.24,25 Adding this difference to the ocular media OD of the standard observer provides an estimate of the individual's ocular media OD function.
If V′(λ) is adjusted for an individual's ocular media OD function ODI(λ), then
| (1) |
where VI′(λ) is the individually adjusted relative scotopic sensitivity function of the observer, c is a scale factor, ODI(λ) is the OD of the individual's ocular media, and ODS(λ) is the OD of the ocular media of the standard observer. The value of V′(λ) was defined by the CIE in 1951 and is tabulated in 1-nm steps by Wyszecki and Stiles.34 The function ODS(λ) is not known a priori, as it was never measured for the observers whose data went into the formulation of the standard observer. The CIE based V′(λ) on data from Wald35 and from Crawford.36 The average age in the Wald study was 20 yr, and all the data used by the CIE from the Crawford study were from a group under 30 yr of age. We assumed an age of 25 yr for the standard observer. Pokorny et al.26 provide an ocular media OD template that can be adjusted for the age of the observer. The values of this model at 25 yr of age were taken as ODS(λ). To obtain an estimate of the continuous function ODI(λ) from our scotopic sensitivity measurements made at seven wavelengths, we adjusted the value of c and ODI(λ) in Eq. (1) to minimize the least-squares difference between the log absolute sensitivity data and the relative sensitivity of the standard observer, log10 V′(λ). The values of ODI(λ) were adjusted by changing the age parameter in the ocular media OD model of Pokorny et al.26
F. Standard Observer and Individualized Cone Fundamentals
The standard observer cone fundamentals used in this experiment were Smith-Pokorny29,30 fundamentals. To obtain wavelength-by-wavelength values, we converted Judd-Vos37 modified color-matching functions , and to cone fundamental values by using the following transformation:
| (2) |
where LS(λ), MS(λ), and SS(λ) are the standard observer cone fundamentals.
If LI(λ), MI(λ), and SI(λ) are individualized cone fundamentals that take into account individual differences in ocular media OD, then
| (3) |
where ODI(λ) is the individual ocular media OD function determined as described in Subsection 2.E and ODS(λ) is the ocular media OD function of the standard observer, taken here as being equivalent to the OD values from the lens model of Pokorny et al.26 for an age of 32 yr, which is the anchor point of their model. A matrix that transforms the values of the individualized cone fundamentals to Judd-Vos37 modified color-matching functions was computed for each observer.
Stimuli used in the remaining experiments varied along one of two axes in color space, either an (L - M)-varying axis or an S-varying (tritan) axis. The tritan axis was determined individually for each subject as described in Subsection 2.G. The (L - M)-varying axis used was a nominal axis. While individual L - M axes could have been determined, the sensitivity of the visual system is much lower to S-varying contrast than to (L - M)-varying contrast. Thus any intrusion of contrast from the orthogonal axis should affect S-axis thresholds to a greater extent than (L - M)-axis thresholds. Each chromatic axis was computed with both standard observer and individually adjusted cone fundamentals. For the standard-observer-fundamental conditions, the mean chromaticity of the stimuli was (0.310, 0.316) in CIE 1931 chromaticity space (equivalent to CIE illuminant C) with a luminance of 15 cd/m2 on the CRT. The cone excitations corresponding to this white point were 9.923, 5.180, and 0.134 for L, M, and S, respectively. For individualized cone-fundamental conditions, these cone excitations were taken as the white point, and corresponding chromaticity and luminance values were computed, yielding different physical white points for each individual. Physical white points were shifted toward higher light levels and shorter wavelengths for older observers. The opposite was true, on average, for younger subjects, though the shift was not as large. The maximum cone contrasts used in these experiments were 0.078 L, −0.149 M, and 0.8 S. Contrast Ci (i = L, M, S) for each cone type for a given stimulus is
| (4) |
where E is cone excitation. Chromatic contrasts are expressed in terms of normalized cone contrast vector length38 :
| (5) |
For our stimuli, the maximum axis contrast was 0.097 for the (L - M)-varying axis and 0.462 for the S-varying axis. Chromatic angles (θ) were related to cone contrasts by the following equations:
| (6) |
where P(L-M) is the proportion of the maximum contrast possible along the (L - M)-varying axis and P(S) is the proportion of the maximum contrast possible along the S-varying axis. Thus an angle of 0° (or 180°) corresponds to the (L - M)-varying axis, and an angle of 90° (or 270°) corresponds to the S-varying axis.
G. Determination of Tritan Axes
The tritan axis (varying stimulation of the S cones, with stimulation being constant for both L and M cones) was determined for each subject for both standard and individualized cone fundamentals conditions. Subjects were presented with two horizontally adjacent, 1.15° × 1.15° chromatic squares superimposed on a 420-nm background of ∼2.5 log trolands. The chromaticities of the two stimuli correspond to the opposite ends of a chromatic axis defined by a chromatic angle θ in the manner described in Subsection 2.F. Subjects adjusted the chromatic angle and the luminance contrast of the pair until the two squares matched in hue and brightness. The short-wavelength background has the effect of suppressing the relative sensitivity of the S cones. Therefore a perceptual match can be made between two stimuli that differ in chromaticity when they lie along a tritan axis and thus modulate only the S cones. Five such settings were made for both the standard and individual fundamentals, and the mean chromatic angle defined the tritan axis.
H. Heterochromatic Flicker Photometry
The chromatic axes produced in the manner described above will be nominally isoluminant within the context of the color space that produced them. However, each set of axes will likely need to be further adjusted to create stimuli that are equated for sensation luminance.39 We used heterochromatic flicker photometry (HFP) to create stimuli that were isoluminant in the individual sense. Circular stimuli with a diameter of 3.7° were presented on the CRT. The chromaticities of the two stimuli to be flickered against each other corresponded to either 0.4 or 0.8 of the maximum axis contrast for the axis being used. Stimuli were flickered at 13.7 Hz (square-wave modulation). Subjects adjusted the nominal luminance of the two stimuli until a point of minimum flicker was achieved. The luminances of the two stimuli were varied in a balanced manner such that the nominal mean luminance and chromaticity of the stimuli remained constant. An average of five settings at 0.4 maximum axis contrast and five settings at 0.8 maximum axis contrast was taken as the final value for the HFP task. This procedure was performed for both chromatic axes and for both sets of fundamentals.
I. Chromatic Contrast Sensitivity Functions
Contrast detection thresholds were measured for chromatically varying Gabor (a spatially sinusoidally varying pattern windowed by a Gaussian) patches. Patterns with spatial frequencies of 0.5, 1, 2, and 4 c/deg were used. All patches contained the same number of cycles thus decreasing in size with increasing spatial frequency (SF). The standard deviation (σ) of the Gaussian was equal to 2.5/SF. Patterns varied spatially between two chromaticities determined by the chromatic angle and the stimulus cone contrast. To minimize the effects of local chromatic adaptation, we varied the spatial phase of the Gabor patch randomly from trial to trial between two phases 180° apart. Stimuli were presented as a Gaussian function of time (σ = 250 ms). Each stimulus presentation lasted 1 s with maximum contrast occurring 500 ms after onset. Between trials, a small fixation cross, which was a luminance decrement on the background, was presented in the middle of the screen, corresponding to the center of the test stimuli. Subjects were instructed to maintain central fixation throughout each trial. However, between trials, subjects were free to move their eyes and take breaks as necessary.
Four sessions were performed for each subject. In a given session, all four spatial frequencies were tested for one chromatic axis for one set of fundamentals. At the beginning of a session, subjects dark adapted for at least 10 min and then light adapted to the background chromaticity for at least 2 min. A temporal two-alternative forced-choice procedure was used. The beginning of each interval was marked by a tone: a low tone for the first interval and a high tone for the second. The fixation mark reappeared during the 1-s gap between the intervals. Subjects indicated the interval in which the stimulus appeared with the flip of a switch. If nothing was seen, the subject was instructed to guess. The next trial was initiated after the subject made a response, following a minimum intertrial interval of 1 s. The contrast of the test stimulus on a trial was chosen based on a QUEST40 adaptive staircase procedure, set to converge at 82% correct. Two independent staircases were interleaved on a given run. Staircases were terminated based on a confidence interval criterion of ±0.15 log contrast. The threshold for a given condition was taken as the geometric mean of the final contrasts at the termination of the two staircases. Results are expressed in terms of chromatic contrast sensitivity, which is the inverse of the contrast (normalized cone contrast vector length) at threshold.
3. RESULTS
A. Optical Media Optical Density Estimates Based on Scotopic Sensitivity Measurements
Two examples of scotopic sensitivity functions measured in this experiment are shown in the upper panels of Fig. 1. The upper left and right panels show scotopic sensitivity data from representative younger (age 18 yr) and older (age 76 yr) subjects, respectively. Smooth curves represent V′(λ), while dashed curves represent V′I(λ) for each individual. The lower panels show the ODI(λ) estimated from the data for each observer. V′(λ) fits the scotopic sensitivity data for the younger subject quite well. However, for the older subject, V′(λ) fails to account for the shape of the scotopic sensitivity function. At shorter wavelengths, the older subject's sensitivity falls off more quickly than V′(λ) does. Greater ocular media OD at short wavelengths can account for this change in shape of the scotopic sensitivity function, and V′I(λ) fits the sensitivity data better for this subject.
Fig. 1.

The upper panels show relative scotopic sensitivity functions for two observers, an 18 yr old (left) and a 76 yr old (right). The solid curves represent the CIE V′(λ) function, while the dashed curves represent scotopic sensitivity functions individualized for each subject, VI′(λ). The lower panels show the corresponding estimated ocular media optical density (OD) functions for the two subjects.
The results of the OD measurements for all 20 subjects are summarized in Fig. 2. This figure shows the estimated OD at 400 nm for each subject as a function of age. Knowledge of this value allows reconstruction of the entire function (see Pokorny et al.26) The average ocular media OD at 400 nm was 1.45 ± 0.05 [standard error of the mean (SEM)] for the younger group and 2.55 ± 0.09 (SEM) for the older group. There was no overlap in OD between the two age groups. This difference is significant (p < 0.001, one-tailed t test). The predictions of the model of Pokorny et al.26 are shown as a dashed bilinear function in Fig. 2. While the model does well predicting ocular media OD for individuals of different ages, considerable intragroup variability exists. Using the model rather than measuring OD individually would lead to large residual interobserver differences in the accuracy of ODI(λ) specifications.
Fig. 2.

Estimated ocular media OD at 400 nm for the 20 phakic subjects as a function of age. Solid circles represent data from individual subjects. The dashed bilinear curve shows the predicted values from the model of Pokorny et al.26
B. Adjusted Cone Fundamentals
Cone fundamentals adjusted for ocular media OD are shown as dashed curves in Fig. 3. The solid curves are the standard Smith-Pokorny fundamentals. The dashed curves in the left panel show cone fundamentals adjusted for an ODI(λ) that corresponds to the average of the younger group, and the dashed curves in the right panel show cone fundamentals adjusted for the average ODI(λ) of the older group. There is a larger difference between the standard observer fundamentals and those fundamentals adjusted for the older group than between the standard observer fundamentals and the fundamentals for the younger group. The sensitivities of the individualized cone fundamentals for the average older observer need to be adjusted down more relative to the standard fundamentals than the sensitivities of the average younger observer need to be shifted up. This is expected, since we are assuming that the standard fundamentals correspond to a lens age of 32 yr, closer to the average age of the younger group. Another obvious effect is that the S cones are more affected by the adjustment than are the S cones are more affected by the adjustment than are the M or L cones. One way to quantify these effects is to consider the cone excitations of each of the fundamentals in response to an equal-energy white stimulus. Cone excitations for the average younger subject's cone fundamentals in response to an equal-energy white are 1.05, 1.06, and 1.20 times greater than the standards for the L, M, and S cone fundamentals, respectively. On the other hand, the cone excitations for the average older subject's cone fundamentals in the same situation would be 0.77, 0.69, and 0.34 times those given by the standard observer L, M, and S fundamentals. The peak sensitivities of the cone fundamentals shift when adjusted for ocular media OD. The peak sensitivities of the standard fundamentals occur at 566, 543, and 440 nm for L, M, and S. For the average younger subject's fundamentals, these shift slightly toward shorter wavelengths: 564, 542, and 439 nm. For the average older subject's fundamentals, the peak sensitivities shift toward longer wavelengths: 580, 552, and 446 nm.
Fig. 3.

Log relative sensitivity (energy) of the three cone fundamentals as a function of wavelength for standard Smith-Pokorny29,30 fundamentals (solid curves) and individualized cone fundamentals adjusted for ocular media OD (dashed curves).
In general, cone excitations for all three cone types will be higher for subjects in the younger group than for subjects in the older group for any given stimulus containing short or medium visible wavelengths. For stimuli that are designed to modulate either S cones or an L - M mechanism, the consequences are somewhat more complicated. One predicted effect is that the mechanism-isolating axes will be rotated somewhat from their orientations in a color space based on a standard observer. For example, the nominal S-isolating axis corresponds to a chromatic angle of 90°. Based on the cone fundamentals of the average younger subject, an angle of 89.4° in the standard observer space would be necessary to create a tritan axis. For the average older subject's cone fundamentals, an angle of 92.3° in the standard observer space should create a tritan axis. These predicted effects are small but consistent with the results from our tritan axis experiment (see Subsection 2.G). Figure 4 shows the average chromatic angle selected in the tritan-pairs task for younger and older subjects in the conditions in which they were tested with chromatic stimuli generated from either the standard observer or individualized fundamentals. In the condition in which the standard observer fundamentals were used (i.e., the same color space was used for all observers), there was a rotation in the expected direction for older relative to younger subjects. In this condition, the average chromatic angle for tritan pairs was 90.1° (± 0.9° SEM) for younger subjects and 95.0° (± 1.1° SEM) for older subjects (p < 0.01, one-tailed t test). This difference is slightly larger than anticipated from the model. In the condition in which individualized fundamentals were used to generate the stimuli (i.e., each subject received different stimuli), the mean angles of tritan pairs were closer for the two groups. Theoretically, these should be the same if no other factors are involved. The average tritan-pairs angles under this condition were 91.8° (±0.9° SEM) for the younger group and 90.8° (±1.4° SEM) for the older group (p > 0.05).
Fig. 4.

Chromatic angle corresponding to the average tritan-pairs settings. Y-S represents the data from younger subjects in the standard fundamentals condition; O-S, older subjects, standard fundamentals; Y-A, younger subjects, individually adjusted fundamentals; and O-A, older subjects, individually adjusted fundamentals. Error bars represent ±1 standard error of the mean (SEM).
The individualized cone fundamentals also suggest other implications for color spaces related to cone contrasts. The white points of the individualized spaces, which are defined by a set of cone excitations, will lie at different coordinates in standard chromaticity space. The white point of an older subject's individually adjusted color space will be more intense overall and contain a greater proportion of short-wavelength light than the white point of a younger individual's space. In our experiment, the white point in the standard observer space was chosen to be (0.310, 0.316) in CIE 1931 chromaticity space with a luminance of 15 cd/m2. Producing the same cone excitations in the average younger observer's cone space would require a chromaticity of (0.322, 0.332) at 14.3 cd/m2. Producing the same cone excitations in the average older observer's cone space would require a chromaticity of (0.241, 0.213) at 21.1 cd/m2.
Additionally, there are effects on axis contrast. To appreciate these effects in terms of the experiment that we have performed, one must first correct these values for changes in isoluminance with OD differences. After correction for luminance changes, we find that the average younger observer fundamentals will receive 99% of the L-cone modulation and 98% of the M-cone modulation of the standard observer for stimuli modulated along the standard L - M axis. On the other hand, the average older observer fundamentals will receive 105% of the L-cone modulation and 112% of the M-cone modulation of the standard observer under the same circumstances. Thus, when subjects are presented with the standard L - M stimuli, older subjects are receiving more L- and M-cone contrast at the same nominal contrast values, according to this analysis. For stimuli along the standard S axis, the situation is reversed. The average younger observer S fundamental will be modulated to just over 100% of the standard fundamentals contrast, while the older observer S fundamental will be modulated approximately 96% as much as the standard observer fundamental.
C. Chromatic Contrast Sensitivity Functions
The mean contrast sensitivities for (L - M)-varying patterns for all subjects are shown in Fig. 5. For all spatial frequencies, younger subjects are more sensitive to patterns defined by L - M chromatic contrast than are older subjects. This difference shows no dependence on spatial frequency for the standard fundamentals stimuli. There is a slight trend toward greater differences at high spatial frequencies when individually adjusted fundamentals are used. Sensitivities are similar for both groups for conditions in which the standard fundamentals are used and for conditions in which the individualized fundamentals are used. The average difference in log sensitivity between younger and older subjects was 0.22 log unit for the standard observer fundamentals conditions and 0.25 log unit for the individually adjusted fundamentals conditions for the (L - M)-varying stimuli.
Fig. 5.
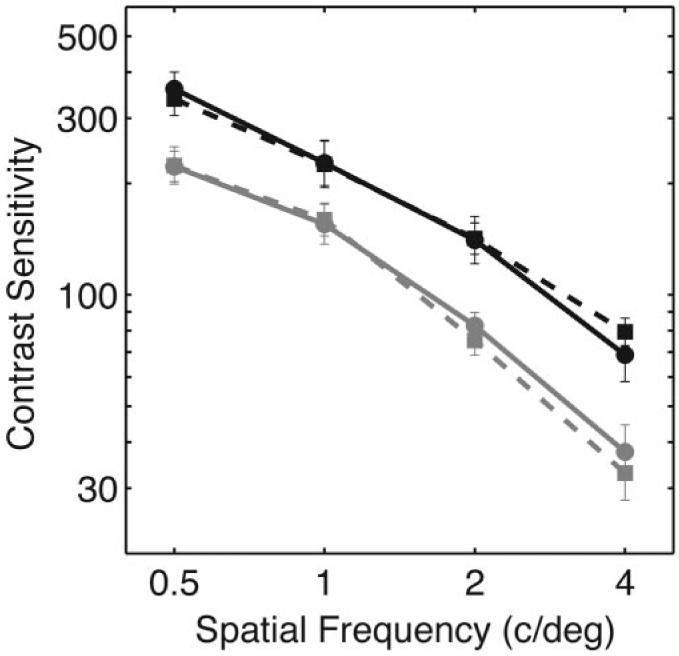
Average chromatic contrast sensitivity as a function of spatial frequency for (L - M)-varying stimuli. Sensitivities are equal to inverse threshold contrast (normalized cone contrast vector length). Black symbols and lines show average data from younger subjects, and gray symbols and lines show average data from older subjects. Solid lines and solid circles show data from the standard fundamentals conditions, and dashed lines and solid squares show data from the individually adjusted fundamentals conditions. Error bars represent ±1 SEM.
The average contrast sensitivities for S-varying patterns for all subjects are shown in Fig. 6. When sensitivities are measured with standard observer fundamentals, there is a larger difference in sensitivity between younger and older subjects than was seen for L - M stimuli. This difference is approximately the same for all spatial frequencies. The sensitivities for the older group in the 2- and 4-c/deg conditions are affected by a floor effect. With the standard fundamentals, one older observer was unable to achieve criterion detection performance for the 2-c/deg patterns even at the highest contrast available for this experiment—0.462 normalized cone contrast vector length or 0.80 S contrast. For the 4-c/deg patterns, six older observers were unable to achieve criterion detection performance at the highest contrast when the standard fundamentals were used. In these instances, the maximum possible contrast was taken as the threshold for purposes of averaging, and downward-pointing arrows on these data points indicate that the true average sensitivity of the older observers at the highest spatial frequencies is lower than that presented here. This floor effect should not affect any of the major conclusions. All younger subjects were able to detect all the patterns. All older subjects were able to detect all the patterns when individualized fundamentals were used. When individualized fundamentals were used, the average sensitivity of older subjects was closer to that of younger subjects. The average difference in log sensitivity between younger and older subjects was 0.47 log unit in the standard observer fundamentals conditions and 0.14 log unit in the individually adjusted fundamentals conditions for the S-varying stimuli.
Fig. 6.

Average chromatic contrast sensitivity for S-varying stimuli. Sensitivities are equal to inverse contrast threshold (normalized cone contrast vector length). Black symbols and lines show average data from younger subjects, and gray symbols and lines show average data from older subjects. Solid lines and solid circles show data from the standard fundamentals conditions, and dashed lines and solid squares show data from the individually adjusted fundamentals conditions. Error bars represent ±1 SEM. The downward-pointing arrows indicate conditions for which one or more of the older observers were unable to detect the patterns at any contrast.
Separate analyses of variance, assuming equal variances across treatment groups, were performed for the L - M and S conditions. The results were analyzed as a mixed within-subjects (spatial frequency and type of fundamentals used), between-subjects (age group) design.41 For the L - M conditions (Fig. 5), the effect of age was significant (p < 0.001), with younger subjects being more sensitive. The effect of spatial frequency was significant (p < 0.001), with sensitivity dropping with increasing spatial frequency. There was no significant effect of type of fundamentals used to produce the stimuli (p = 0.783). The only significant interaction for this analysis was between age group and spatial frequency (p < 0.05), with sensitivity falling off at a faster rate with spatial frequency for the older subjects in the individualized fundamentals conditions (p < 0.01).
For the S conditions (Fig. 6), the effects of age (p < 0.001), spatial frequency (p < 0.001), and type of fundamentals (p < 0.001) were all significant. In addition, there was a significant interaction between age and spatial frequency (p < 0.05) and significant interaction between age and fundamentals (p < 0.001). Overall, older subjects were less sensitive to S contrast than younger subjects. All subjects were more sensitive to lower spatial frequencies than higher. On average, subjects were more sensitive to the S contrast in the individually adjusted fundamentals conditions. However, this effect was driven by the older subjects becoming considerably more sensitive under these conditions (younger subjects became somewhat less sensitive at higher spatial frequencies). This difference between the younger and older groups accounts for the significant interaction between age group and the type of fundamentals used. Additional comparisons were made between older and younger subjects for the individually adjusted conditions, since it appeared that these data converge at the higher spatial frequencies. There was still a significant effect of age under these conditions (p < 0.05) as well as a significant interaction between age and spatial frequency.
Figure 7 shows the individual sensitivities for all 20 observers as a function of age for the four spatial frequencies tested on the L - M conditions. The sensitivities of the younger subjects cluster at higher values than those of the older subjects, but there is some overlap in sensitivity between the two groups. This is true for both the standard observer fundamentals (open circles) and individualized fundamentals (solid squares) conditions. Sensitivities as a function of age for the S-varying conditions are shown in Fig. 8. For the standard observer fundamentals conditions, the younger subjects have significantly higher sensitivities for all four spatial frequencies. There is less overlap between the two groups than was seen in Fig. 7 for the L - M conditions. However, for the individually adjusted fundamentals, there is more overlap between the two groups, especially at 2 and 4 c/deg.
Fig. 7.

Chromatic contrast sensitivity for all 20 subjects as a function of chronological age for (L - M)-varying stimuli. Solid squares represent data from individually adjusted fundamentals conditions, and open circles represent data from standard fundamentals conditions. Data from the four spatial frequencies are plotted in different panels. The dashed line across the bottom of each panel represents a sensitivity corresponding to the maximum contrast achievable for these stimuli under these conditions.
Fig. 8.

Chromatic contrast sensitivity for all 20 subjects as a function of chronological age for S-varying stimuli. Solid squares represent data from individually adjusted fundamentals conditions, and open circles represent data from standard fundamentals conditions. The dashed line across the bottom of each panel represents a sensitivity corresponding to the maximum contrast achievable for these stimuli under these conditions.
4. DISCUSSION
These experiments have demonstrated age-related losses in sensitivity to chromatically varying patterns at all spatial frequencies tested and for both (L - M)- and S-varying stimuli. These losses occurred both when subjects were tested with stimuli having the same mean chromaticity and luminance at the cornea and when subjects were tested with stimuli that had been corrected for changes in ocular media OD to equate retinal stimulation. These differences were not due to differences in pupil size with age, since stimuli were presented through an optical system with a small exit pupil. The results of these experiments are consistent with the hypothesis that neural as well as optical changes contribute to reduced sensitivity to chromatically varying patterns with age.
The wavelength-dependent filtering effects of ocular media brunescence have differential impacts on sensitivities to stimuli modulated along either the (L - M)- or S-varying axis. Older subjects are no more sensitive to chromatic contrast for (L - M)-varying stimuli when that contrast is produced from cone fundamentals that are individually adjusted to account for ocular media OD than when that contrast is produced from the standard cone fundamentals. This result may seem counterintuitive. Both L and M cones will receive more net stimulation after the correction. However, this overall increase in stimulation in L and M cones (luminance increase) is modest, and any effect of this increase may be offset by the slight reduction in L - M contrast due to the optical correction.
On the other hand, the correction for ocular media OD has considerable effect for older subjects' sensitivity to S-cone contrast. Older subjects' sensitivity to S-cone contrast increased for individually adjusted S-varying stimuli relative to stimuli generated from the standard fundamentals for all spatial frequencies tested. When corrected for ocular media OD, the sensitivity of older subjects is considerably closer to that of younger subjects. In fact, in the individually adjusted conditions, the difference between older subjects and younger subjects for S-varying stimuli is less than the difference seen for (L - M)-varying stimuli, at least at 2 and 4 c/deg. This result is inconsistent with the hypothesis that the S-cone pathways are more susceptible than L - M pathways to senescent processes in normal aging.20,21 For conditions in which stimuli were adjusted for ocular media density differences, the relative differences between the two axes were rather small, and the pattern of results is quite similar. One curiosity in the data is the convergence of the sensitivities for older and younger observers at 2 and 4 c/deg in the individually adjusted conditions for the S-varying stimuli. This could be simply due to variability in the data. Alternatively, this convergence could be a result of both curves approaching the high-spatial-frequency cutoff of the S-cone system. Because of relatively sparse retinal sampling, the highest spatial frequencies used in this experiment approach the upper resolution limit of the S-cone system.42 Finally, luminance artifacts due to chromatic aberration or imperfect luminance equations with the HFP technique could cause such a convergence of sensitivity curves. Despite our best efforts to control luminance artifacts, it is possible that luminance intrusion occurred and biased sensitivities toward higher values for some of the older observers. Such a bias is more likely at the highest spatial frequency tested (4 c/deg), where the luminance contrast sensitivity function approaches its peak and where the effects of chromatic aberration would be expected to be most prominent. The fact that two older observers have particularly high sensitivity under this one condition (i.e., appear as outliers in Fig. 8, lower right panel) is consistent with this idea.
A potentially important distinction between the stimuli presented to older and younger subjects in the individually adjusted conditions is the difference in mean chromaticity of the stimuli. Stimuli presented to older observers in these conditions were shifted toward shorter wavelengths. While these stimuli should create cone excitations that are more similar between groups, the appearance of the stimuli was quite different. Older subjects tend to perform similarly to younger subjects on measures of color appearance,43-46 and older subjects reported (informally) in this experiment that the background color did appear bluish. The effect of this difference in color appearance for chromatic contrast sensitivity is unclear. However, the results of this experiment indicate that, for the purposes of detection thresholds, using chromatic stimuli equated at the level of the cones (individualized stimuli) yields greater concordance between the results of older and younger subjects than stimuli that are likely to be more similar in appearance (standard stimuli).
Stimuli in this study were controlled for age-related increases in ocular media OD and age-related reduction in pupil size. However, other optical differences could still contribute to reduced sensitivity to spatially varying chromatic patterns with increased age. One such difference is increased forward light scatter with age for phakic individuals,47,48 which is due largely to changes in the crystalline lens.49 The effect of forward scatter would be to reduce the effective contrast of the stimulus at the retina for any spatially varying pattern.50 One potential control against this is to test pseudophakes—individuals who have had their crystalline lenses removed and replaced with artificial intraocular lenses. However, there are potentially important differences between older pseudophakic and younger phakic individuals that make such a direct comparison problematic. The OD of intraocular lenses is generally lower at shorter visible wavelengths than the crystalline lens of a young observer.51,52 Thus a correction for this difference is still necessary. Furthermore, a well-refracted pseudophakic eye may be more affected by monochromatic aberrations than a well-refracted, young phakic eye.53 Finally, pseudophakic observers may differ in other respects from those considered eligible for “normalaging” groups. Specifically, most of these individuals have experienced cataracts and have undergone a surgery to correct this condition. The full effect of having had such a condition and surgery on visual performance is not known.
Given the difficulties in comparing the effects of “normal” aging in pseudophakic and phakic individuals, the approach of adjusting test stimuli to account for effects of ocular media OD is particularly attractive. This concept is not new.24,54,55 What is novel in the development presented here is the combination of a simple quantitative method for modeling the effects of ocular media OD senescence on cone fundamentals with a simple method for measuring the ocular media OD for each individual tested. The results from the measurement of ocular media OD demonstrate good internal consistency with the lens-aging model of Pokorny et al.26 When their template is used to estimate the ocular media OD of individuals based on their scotopic sensitivity functions, the model is a good predictor of OD as a function of age. However, considerable variability remains that would be missed if the model were used by itself in the place of individual measurement.
The magnitude of the loss in sensitivity to chromatic patterns with age seen in this study is somewhat lower than what is seen in other studies of sensitivity of isolated cone mechanisms where spatially uniform patterns were used.4,5,28 The lack of additional losses in sensitivity with increased spatial complexity is consistent with losses in neural sensitivity at a fairly early stage of visual processing. This pattern of results is not consistent with cumulative losses at successive stages of visual processing, at least for these simple patterns in a highly controlled environment with little attention load.
Studies of luminance contrast sensitivity differ widely in their assessment of age-related losses. Some results suggest that age-related losses are greater at higher spatial frequencies,1 though this selective effect may be largely due to optical changes.2 In this study, we find only weak evidence for increasing losses with higher spatial frequencies for (L - M)-varying patterns and no such effect, indeed perhaps an effect in the opposite direction, for S-varying stimuli when ocular media OD is controlled for. This lack of dependence of sensitivity on spatial frequency suggests that the effect of increasing optical aberrations with increasing age,56-58 which should impact the highest spatial frequencies to a greater extent, has either been properly controlled for in our viewing situation or does not come into effect until higher spatial frequencies, which cannot be tested under these conditions without creating substantial luminance artifacts.
ACKNOWLEDGMENTS
This work was supported by a National Institute on Aging grant (AG04058) and a Research to Prevent Blindness Jules and Doris Stein Professorship.
REFERENCES
- 1.Owsley C, Sekuler R, Siemsen D. Contrast sensitivity throughout adulthood. Vision Res. 1983;23:689–699. doi: 10.1016/0042-6989(83)90210-9. [DOI] [PubMed] [Google Scholar]
- 2.Burton KB, Owsley C, Sloane ME. Aging and neural spatial contrast sensitivity: photopic vision. Vision Res. 1993;33:939–946. doi: 10.1016/0042-6989(93)90077-a. [DOI] [PubMed] [Google Scholar]
- 3.Schefrin BE, Tregear SJ, Harvey LO, Jr., Werner JS. Senescent changes in scotopic contrast sensitivity. Vision Res. 1999;39:3728–3736. doi: 10.1016/s0042-6989(99)00072-3. [DOI] [PubMed] [Google Scholar]
- 4.Werner JS, Bieber ML, Schefrin BE. Senescence of foveal and parafoveal cone sensitivities and their relations to macular pigment density. J. Opt. Soc. Am. A. 2000;17:1918–1932. doi: 10.1364/josaa.17.001918. [DOI] [PMC free article] [PubMed] [Google Scholar]
- 5.Werner JS, Steele VG. Sensitivity of human foveal color mechanisms throughout the life span. J. Opt. Soc. Am. A. 1988;5:2122–2130. doi: 10.1364/josaa.5.002122. [DOI] [PubMed] [Google Scholar]
- 6.Shinomori K, Schefrin BE, Werner JS. Age-related changes in wavelength discrimination. J. Opt. Soc. Am. A. 2001;18:310–318. doi: 10.1364/josaa.18.000310. [DOI] [PMC free article] [PubMed] [Google Scholar]
- 7.Kadlecová V, Peleška M, Vaško A. Dependence on age of the diameter of the pupil in the dark. Nature (London) 1958;182:1520–1521. doi: 10.1038/1821520a0. [DOI] [PubMed] [Google Scholar]
- 8.Boettner EA, Wolter JR. Transmission of the ocular media. Invest. Ophthalmol. 1962;1:776–783. [Google Scholar]
- 9.Thorell LG, De Valois RL, Albrecht DG. Spatial mapping of monkey V1 cells with pure color and luminance stimuli. Vision Res. 1984;24:751–769. doi: 10.1016/0042-6989(84)90216-5. [DOI] [PubMed] [Google Scholar]
- 10.Bradley A, Switkes E, De Valois K. Orientation and spatial frequency selectivity of adaptation to color and luminance gratings. Vision Res. 1988;28:841–856. doi: 10.1016/0042-6989(88)90031-4. [DOI] [PubMed] [Google Scholar]
- 11.De Valois RL, De Valois KK. Neural coding of color. In: Carterette EC, Freidman MP, editors. Seeing, Vol.5 of Handbook of Perception. Academic; New York: 1975. pp. 117–166. [Google Scholar]
- 12.De Valois KK. The role of color in spatial vision. In: Chalupa LM, Werner JS, editors. The Visual Neurosciences. MIT Press; Cambridge, Mass.: 2004. pp. 924–935. [Google Scholar]
- 13.Kelly DH. Spatio-temporal frequency characteristics of color-vision mechanisms. J. Opt. Soc. Am. 1974;64:983–990. doi: 10.1364/josa.64.000983. [DOI] [PubMed] [Google Scholar]
- 14.Kelly DH. Spatiotemporal variation of chromatic and achromatic contrast thresholds. J. Opt. Soc. Am. 1983;73:742–750. doi: 10.1364/josa.73.000742. [DOI] [PubMed] [Google Scholar]
- 15.Mullen KT. The contrast sensitivity of human colour vision to red-green and blue-yellow chromatic gratings. J. Physiol. (London) 1985;359:381–400. doi: 10.1113/jphysiol.1985.sp015591. [DOI] [PMC free article] [PubMed] [Google Scholar]
- 16.Werner A, Schwarz G, Paulus W. Ageing and chromatic contrast sensitivity. In: Drum B, editor. Colour Vision Deficiencies XII. Kluwer Academic; Dordrecht, The Netherlands: 1995. pp. 235–241. [Google Scholar]
- 17.Steen R, Whitaker D, Elliott DB, Wild JM. Age-related effects of glare on luminance and color contrast sensitivity. Optom. Vision Sci. 1994;71:792–796. doi: 10.1097/00006324-199412000-00010. [DOI] [PubMed] [Google Scholar]
- 18.Fiorentini A, Porciatti V, Morrone MC, Burr DC. Visual ageing: unspecific decline of the responses to luminance and colour. Vision Res. 1996;36:3557–3566. doi: 10.1016/0042-6989(96)00032-6. [DOI] [PubMed] [Google Scholar]
- 19.Crognale MA. Development, maturation, and aging of chromatic visual pathways: VEP results. J. Vision. 2002;2:438–450. doi: 10.1167/2.6.2. [DOI] [PubMed] [Google Scholar]
- 20.Eisner A, Fleming SA, Klein ML, Mauldin WM. Sensitivities in older eyes with good acuity: cross-sectional norms. Invest. Ophthalmol. Visual Sci. 1987;28:1824–1831. [PubMed] [Google Scholar]
- 21.Haegerstrom-Portnoy G, Hewlett SE, Barr SAN. S cone loss with aging. In: Drum B, Verriest G, editors. Colour Vision Deficiencies IX. Kluwer Academic; Dordrecht, The Netherlands: 1989. pp. 345–352. [Google Scholar]
- 22.Zlatkova MB, Coulter E, Anderson RS. Short-wavelength acuity: blue-yellow and achromatic resolution loss with age. Vision Res. 2003;43:109–115. doi: 10.1016/s0042-6989(02)00411-x. [DOI] [PubMed] [Google Scholar]
- 23.Delahunt PB, Hardy JL, Okajima K, Werner JS. Senescence of spatial chromatic contrast sensitivity. II. Matching under natural viewing conditions. J. Opt. Soc. Am. A. 2004;22:60–67. doi: 10.1364/josaa.22.000060. [DOI] [PMC free article] [PubMed] [Google Scholar]
- 24.van Norren D, Vos JJ. Spectral transmission of the human ocular media. Vision Res. 1974;14:1237–1244. doi: 10.1016/0042-6989(74)90222-3. [DOI] [PubMed] [Google Scholar]
- 25.Werner JS. Development of scotopic sensitivity and the absorption spectrum of the human ocular media. J. Opt. Soc. Am. 1982;72:247–258. doi: 10.1364/josa.72.000247. [DOI] [PubMed] [Google Scholar]
- 26.Pokorny J, Smith VC, Lutze M. Aging of the human lens. Appl. Opt. 1987;26:1437–1440. doi: 10.1364/AO.26.001437. [DOI] [PubMed] [Google Scholar]
- 27.Werner JS, Donnelly SK, Kliegl R. Aging and human macular pigment density; appended with translations from the work of Max Schultze and Ewald Hering. Vision Res. 1987;27:257–268. doi: 10.1016/0042-6989(87)90188-x. [DOI] [PubMed] [Google Scholar]
- 28.Hammond BR, Jr., Wooten BR, Snodderly DM. Preservation of visual sensitivity of older subjects: association with macular pigment density. Invest. Ophthalmol. Visual Sci. 1998;39:397–406. [PubMed] [Google Scholar]
- 29.Smith VC, Pokorny J. Spectral sensitivity of the foveal cone photopigments between 400 and 500 nm. Vision Res. 1975;15:161–171. doi: 10.1016/0042-6989(75)90203-5. [DOI] [PubMed] [Google Scholar]
- 30.Smith VC, Pokorny J. The design and use of a cone chromaticity space: a tutorial. Color Res. Appl. 1996;21:375–383. [Google Scholar]
- 31.MacLeod DIA, Boynton RM. Chromaticity diagram showing cone excitation by stimuli of equal luminance. J. Opt. Soc. Am. 1979;69:1183–1186. doi: 10.1364/josa.69.001183. [DOI] [PubMed] [Google Scholar]
- 32.Derrington AM, Krauskopf J, Lennie P. Chromatic mechanisms in lateral geniculate nucleus of macaque. J. Physiol. (London) 1984;357:241–265. doi: 10.1113/jphysiol.1984.sp015499. [DOI] [PMC free article] [PubMed] [Google Scholar]
- 33.Powell I. Lenses for correcting chromatic aberration of the eye. Appl. Opt. 1981;20:4152–4155. doi: 10.1364/AO.20.004152. [DOI] [PubMed] [Google Scholar]
- 34.Wyszecki G, Stiles WS. Color Science: Concepts and Methods, Quantitative Data and Formulae. 2nd ed. Wiley; New York: 1982. [Google Scholar]
- 35.Wald G. The spectral sensitivity of the human eye; a spectral adaptometer. J. Opt. Soc. Am. 1945;35:187. [Google Scholar]
- 36.Crawford BH. The scotopic visibility function. Proc. Phys. Soc. London. 1949;62B:321–334. [Google Scholar]
- 37.Vos JJ. Colorimetric and photometric properties of a 2° fundamental observer. Color Res. Appl. 1978;3:125–128. [Google Scholar]
- 38.Brainard DH. Color contrast and opponent modulation color spaces. In: Kaiser PK, Boynton RM, editors. Human Color Vision. 2nd ed. Optical Society of America; Washington, D.C.: 1996. pp. 563–579. [Google Scholar]
- 39.Kaiser PK. Sensation luminance: a new name to distinguish CIE luminance from luminance dependent on an individual's spectral sensitivity. Vision Res. 1988;28:455–456. doi: 10.1016/0042-6989(88)90186-1. [DOI] [PubMed] [Google Scholar]
- 40.Watson AB, Pelli DG. QUEST: a Bayesian adaptive psychometric method. Percept. Psychophys. 1983;33:113–120. doi: 10.3758/bf03202828. [DOI] [PubMed] [Google Scholar]
- 41.Keppel G, Zedeck S. Data Analysis for Research Designs. Freeman; New York: 1989. [Google Scholar]
- 42.Williams D, Sekiguchi N, Brainard D. Color, contrast sensitivity, and the cone mosaic. Proc. Natl. Acad. Sci. USA. 1993;90:9770–9777. doi: 10.1073/pnas.90.21.9770. [DOI] [PMC free article] [PubMed] [Google Scholar]
- 43.Okajima K, Yamashita K, Takamura Y, Watanabe K, Tsuchiya N. Color perception of the elderly: experiments and simulations. Proceedings of the International Conference for Universal Design; International Association for Universal Design; Yokohama, Japan. 2002.pp. 238–244. [Google Scholar]
- 44.Schefrin BE, Werner JS. Loci of spectral unique hues throughout the life span. J. Opt. Soc. Am. A. 1990;7:305–311. doi: 10.1364/josaa.7.000305. [DOI] [PubMed] [Google Scholar]
- 45.Schefrin BE, Werner JS. Age-related changes in the color appearance of broadband surfaces. Color Res. Appl. 1993;18:380–389. [Google Scholar]
- 46.Hardy JL, Frederick CM, Kay P, Werner JS. Color naming, lens aging, and grue: what the optics of the aging eye can teach us about color language. Psychol. Sci. doi: 10.1111/j.0956-7976.2005.01534.x. (to be published) [DOI] [PMC free article] [PubMed] [Google Scholar]
- 47.Allen MJ, Vos JJ. Ocular scattered light and visual performance as a function of age. Am. J. Optom. Arch. Am. Acad. Optom. 1967;44:717–727. doi: 10.1097/00006324-196711000-00003. [DOI] [PubMed] [Google Scholar]
- 48.Whitaker D, Steen R, Elliott DB. Light scatter in the normal young, elderly, and cataractous eye demonstrates little wavelength dependency. Optom. Vision Sci. 1993;70:963–968. doi: 10.1097/00006324-199311000-00014. [DOI] [PubMed] [Google Scholar]
- 49.Weale RA. Senescent vision: is it all the fault of the lens? Eye. 1987;1:217–221. doi: 10.1038/eye.1987.40. [DOI] [PubMed] [Google Scholar]
- 50.Westheimer G, Liang J. Influence of ocular light scatter on the eye's optical performance. J. Opt. Soc. Am. A. 1995;12:1417–1424. doi: 10.1364/josaa.12.001417. [DOI] [PubMed] [Google Scholar]
- 51.Werner JS, Steele VG, Pfoff DS. Loss of human photoreceptor sensitivity associated with chronic exposure to ultraviolet radiation. Ophthalmology. 1989;96:1552–1558. doi: 10.1016/s0161-6420(89)32693-5. [DOI] [PubMed] [Google Scholar]
- 52.Werner JS, Spillmann L. UV-absorbing intraocular lenses: safety, efficacy, and consequences for the cataract patient. Graefe's Arch. Clin. Exp. Ophthalmol. 1989;227:248–256. doi: 10.1007/BF02172758. [DOI] [PubMed] [Google Scholar]
- 53.Barbero S, Marcos S, Jimenez-Alfaro I. Optical aberrations of intraocular lenses measured in vivo and in vitro. J. Opt. Soc. Am. A. 2003;20:1841–1851. doi: 10.1364/josaa.20.001841. [DOI] [PubMed] [Google Scholar]
- 54.Cottaris NP. Artifacts in spatiochromatic stimuli due to variations in preretinal absorption and axial chromatic aberration: implications for color physiology. J. Opt. Soc. Am. A. 2003;20:1694–1713. doi: 10.1364/josaa.20.001694. [DOI] [PubMed] [Google Scholar]
- 55.Okajima K, Takase M. Computerized simulation and chromatic adaptation experiments based on a model of aged human lens. Opt. Rev. 2001;8:64–70. [Google Scholar]
- 56.Artal P, Marcos S, Navarro R, Williams DR. Odd aberrations and double-pass measurements of retinal image quality. J. Opt. Soc. Am. A. 1995;12:195–201. doi: 10.1364/josaa.12.000195. [DOI] [PubMed] [Google Scholar]
- 57.Guirao A, Redondo M, Artal P. Optical aberrations of the human cornea as a function of age. J. Opt. Soc. Am. A. 2000;17:1697–1702. doi: 10.1364/josaa.17.001697. [DOI] [PubMed] [Google Scholar]
- 58.McLellan JS, Marcos S, Burns SA. Age-related changes in monochromatic wave aberrations of the human eye. Invest. Ophthalmol. Visual Sci. 2001;42:1390–1395. [PubMed] [Google Scholar]