Abstract
Insulin-like growth factor-2 (IGF2) is essential for fetal development as well as maintenance of adult organs such as brain and liver. Although genetic polymorphisms of IGF2 are linked to cytoskeletal variations little is known about the mechanisms of IGF2 action in proliferation and differentiation of chondrocytes for skeletal growth. A genome-wide mRNA expression analysis using C28/I2 chondrocyte cells studied potential signaling pathways underlying the responses to IGF2. Microarray data predicted involvement of the phosphatidylinositol 3-kinase (PI3K) and transforming growth factor β (TGFβ) signaling pathways. Protein analyses revealed IGF2 administration activated phosphorylation of Akt and GSK3β in the PI3K pathway. LY294002 (selective inhibitor of PI3K) blocked Akt phosphorylation and abolished IGF2-driven elevation of the mRNA levels of the proteoglycans, Aggrecan and Versican. LY294002 did not suppress upregulation of TGFβ mRNA induced by IGF2, so IGF2 activates PI3K and TGFβ pathways. IGF2-driven transcriptional activation of proteoglycan genes such as Aggrecan and Versican is mediated by the PI3K pathway.
Keywords: Chondrocytes, IGF2, PI3K, Akt, TGFβ, Aggrecan, Versican
1. Introduction
The insulin-like growth factor (IGF) “axis” consists of two ligands (IGF1 and IGF2), two cell-surface receptors (IGF1R and IGF2R) and a family of six IGF binding proteins (IGFBP1-6) (Humbel, 1990; Schmid, 1995; Denley et al., 2005). This IGF axis promotes cell proliferation and inhibits apoptosis in many different model systems (Koike et al., 2003; Kiepe et al., 2005; Wang et al., 2006; Ciarmatori et al., 2007). IGF1 and IGF2 bind to IGF1R as well as IGFBP1-6 with different specificities and affinities, but only IGF2 interacts with IGF2R. IGF2R does not possess a receptor kinase domain and acts as a sequestering agent of IGF2 (O’Dell and, 1998). IGF1 is known to stimulate proteoglycan synthesis via the PI3K signaling pathway in chondrocytes (Starkman et al., 2005) but little is known about IGF2. IGF2 is active primarily at early stages of skeletal growth (Shinar et al., 1993) and a linkage of genetic polymorphisms in IGF2 to body mass index in adults has been reported (Gaunt et al., 2001). Our study aims to evaluate the effects of IGF2 on gene expression in chondrocytes and identify signaling pathways that respond to IGF2-driven metabolic alterations.
Anabolic responses in chondrocytes can be induced by various growth factors including bone morphogenetic proteins (BMPs) (Yoon and Lyons KM, 2004; Sugimori et al., 2005), epidermal growth factor (EGF) (Bonassar and Trippel, 1997), fibroblast growth factor (FGF) (Dailey et al., 2003), parathyroid hormone (PTH) (Iannotti et al., 1990; Nasatzky et al., 2000) and TGFβ (Yonekura et al., 1999; Schneiderbauer et al., 2004; Han et al., 2005). Their signaling processes such as activations of MAPK (extracellular signal-regulated kinase – ERK; and p38 kinase), PI3 kinase and nuclear factor-κB as well as inhibition of protein kinase C have been characterized (Yonekura et al., 1999; Sugimori et al., 2005). The responses to IGF1 are mediated by phosphorylation of various kinases via the PI3K and MAPK pathways (Kiepe et al., 2005; Starkman et al., 2005; Ciarmatori et al., 2007) we hypothesized that those kinases would be involved in the responses to IGF2 and we tested the hypothesis that IGF2 upregulates TGFβ that are primarily anabolic in chondrocytes.
To test the above hypotheses and identify IGF2-driven signaling pathways, we used a “comparative-systems biology approach” with 4 pairs of whole human genome microarrays in the presence and absence of IGF2 administration. Microarray-derived data were pre-filtered to identify a list of genes whose mRNA levels were significantly altered. Those genes were analyzed by the web-based software tool Pathway-Express to find the most highly ranked signaling pathways (Khatri et al., 2007; Draghici et al., 2007), which revealed potential involvement of two molecular pathways. We focused on the phosphorylation status of Akt (also known as protein kinase B) and glycogen synthase kinase 3β (GSK3β) with and without administration of a pharmacological inhibitor LY294002 and evaluated expression of Aggrecan (Watanabe et al., 1994 and 1998) and Versican (Kamiya et al., 2006; Matsumoto et al., 2006) since regulation of those proteoglycan genes is critical in differentiation of chondrocytes and development of articular cartilage.
2. Materials and methods
2.1. Cell culture and administration of IGF2
C-28/I2 human chondrocytes (Goldring et al., 1994) were cultured in Dulbecco’s modified Eagle’s medium containing10% FBS and antibiotics (50 units/ml penicillin and 50 µg/ml streptomycin; Invitrogen). Cells were incubated at 37°C in a humid chamber with 5 % CO2 in air, and cultured for experiments at 70–80% confluency. Approximately 4 × 10⁵ cells were starved for 14 h in a 60-mm plastic dish (Falcon) in the medium containing 0.1% FBS and treated with IGF2 (R&D Systems) at 10, 50, or 100 ng/ml for 5 h. The IGF2 dosages were based on the responses to other cell types (Smith et al., 1999; and Fiedler et al., 2006).
A phosphatidylinositol 3-kinase (PI3K) pathway was inhibited through 30 min pre-incubation with LY294002 (Cell Signaling Technology) prior to incubation with 100 ng/ml IGF2 for 5 h.
2.2. Microarray
Microarray experiments were conducted using Agilent whole human genome arrays (G4112A, Agilent). Eight RNA samples isolated from 4 pairs of control chondrocyte cells and IGF2-treated cells (100 ng/ml IGF2 for 5 h) using an RNeasy Plus mini kit (Qiagen) were labeled with the Agilent low RNA input fluorescent linear amplification kit. They were hybridized to 8 one-color arrays using the in situ hybridization kit (Agilent). Microarray data were filtered to remove background noise and a modified t-test was performed to identify a group of genes that were altered >2-fold or <0.5-fold with statistical significance at P<0.01. The list of genes was imported into Pathway-Express which identified gene signaling pathways through calculation of an impact factor. The impact factor of the entire pathway was calculated using a probabilistic term that considered the proportion of differentially expressed genes on the pathway and gene perturbation factors of all the genes.
2.3. Reverse transcription and real-time PCR
Using ~50 ng of total RNA reverse transcription was performed with high capacity cDNA reverse transcription kits (Applied Biosystems). Quantitative real-time PCR was performed using ABI 7500 with Power SYBR green PCR master mix kits (Applied Biosystems). We evaluated the mRNA levels of chondrogenic genes (Aggrecan, Versican, Sox9, and Col2A1), hypertrophic genes (Runx2 and Col10A1), a collagenase gene (MMP13), a growth factor gene (TGFβ1) and GAPDH with the PCR primers listed in the Table. GAPDH was used as an internal control and the results were given as a ratio of the mRNA level of IGF2-treated cells to that of control cells.
Table 1.
Real-Time PCR primers
| Gene | forward primer | backward primer |
|---|---|---|
| Aggrecan | 5’- GACAGACTTGAGGGGGAGGT -3’ | 5’- GCAGTGGCATTGTGAGATTC -3’ |
| Col2A1 | 5’- TACCACTGCAAGAACAGC -3’ | 5’- GTGCAATGTCAATGATGG -3’ |
| Col10A1 | 5’- CAGGCAACAGCATTATGACC -3’ | 5’- CATTTGACTCGGCATTGG -3’ |
| MMP13 | 5’- AATATCTGAACTGGGTCTTCCAAAA -3’ | 5’- CAGACCTGGTTTCCTGAGAACAG -3’ |
| Noggin | 5’- GAAGCTGCGGAGGAAGTTACAG -3’ | 5’- GGTCGTTCCACGCGTACAG -3’ |
| Runx2 | 5’- AACCCACGAATGCACTATCCA -3’ | 5’- CGGACATACCGAGGGACATG -3’ |
| Sox9 | 5’- CATGAGCGAGGTGCACTCC -3’ | 5’- TCGCTTCAGGTCAGCCTTG -3’ |
| TGFβ1 | 5’-GGACACCAACTATTGCTTCAGCT-3’ | 5’-CTTGCTGTACTGCGTGTCCAGG-3’ |
| Versican | 5’-CACAAGACACGGTGTCACTGACT-3’ | 5’-ACGTCCAAACAAGCCTTCTGA-3’ |
| GAPDH | 5’- GCACCGTCAAGGCTGAGAAC -3’ | 5’- ATGGTGGTGAAGACGCCAGT -3’ |
2.4. Immunoblots
Cells were sonicated with a sonic dismembrator (Model 100; Fisher Scientific) and lysed in a RIPA lysis buffer containing protease inhibitors (Santa Cruz Biotechnology) and phosphatase inhibitors (Calbiochem). Isolated proteins were fractionated using 10 % SDS gels and electro-transferred to Immobilon-P membranes (Millipore). The membrane was incubated for 1 h with primary antibodies followed by 45 min incubation with goat anti-rabbit IgG (Cell Signaling Technology) or goat anti-mouse IgG conjugated with horseradish peroxidase (Amersham) (1:2000 dilution) and antibodies against Akt, p-Akt and p-GSK3β (Cell Signaling Technology) and anti β-actin (Sigma). Protein levels were assayed with an ECL advance western blotting detection kit (Amersham Biosciences) and signal intensities were quantified with a luminescent image analyzer (LAS-3000, Fuji Film).
2.5. Statistical analysis
Experiments were conducted at least twice and the data were expressed as mean ± s.d. Real-time PCR was run using 4 independent wells for each experiment and statistical significance from t-test was indicated with *(P<0.05) and ** (P<0.01).
3. Results
3.1. Microarray data
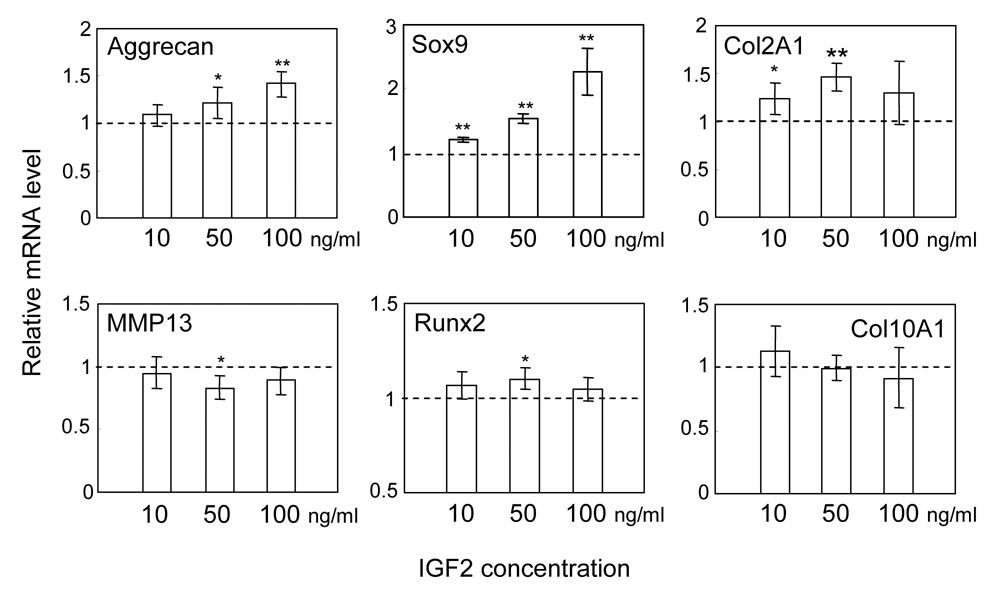
Quantitative real-time PCR was conducted prior to microarray experiments to examine the dosage response to IGF2 in C-28/I2 chondrocytes using 6 marker genes with 3 chondrogenic genes (Aggrecan, Sox9, and Col2A1), 2 hypertrophic genes (Runx2 and Col10A1) and 1 collagenase gene (MMP13) (Fig. 1). In response to 10, 50 and 100 ng/ml IGF2 administration for 5 h, upregulation of Aggrecan mRNA and Sox9 mRNA exhibited dependence on IGF2 dosage. The level of Col12A1 mRNA was elevated but its elevation did not show clear dependence on IGF2 dosage. The mRNA levels of MMP13, Runx2 and Col10A1 were largely unchanged and we administered IGF2 at a concentration of 100 ng/ml.
Figure 1.
Alterations in mRNA levels of Aggrecan, Sox9, Col2A1, MMP13, Runx2 and Col10A1 in response to 10, 50, and 100 ng/ml IGF2 for 5 h. The relative mRNA level was normalized by the level of control cells without IGF2 administration. The asterisks indicate statistical significance at P<0.05 (*) and P<0.01 (**).
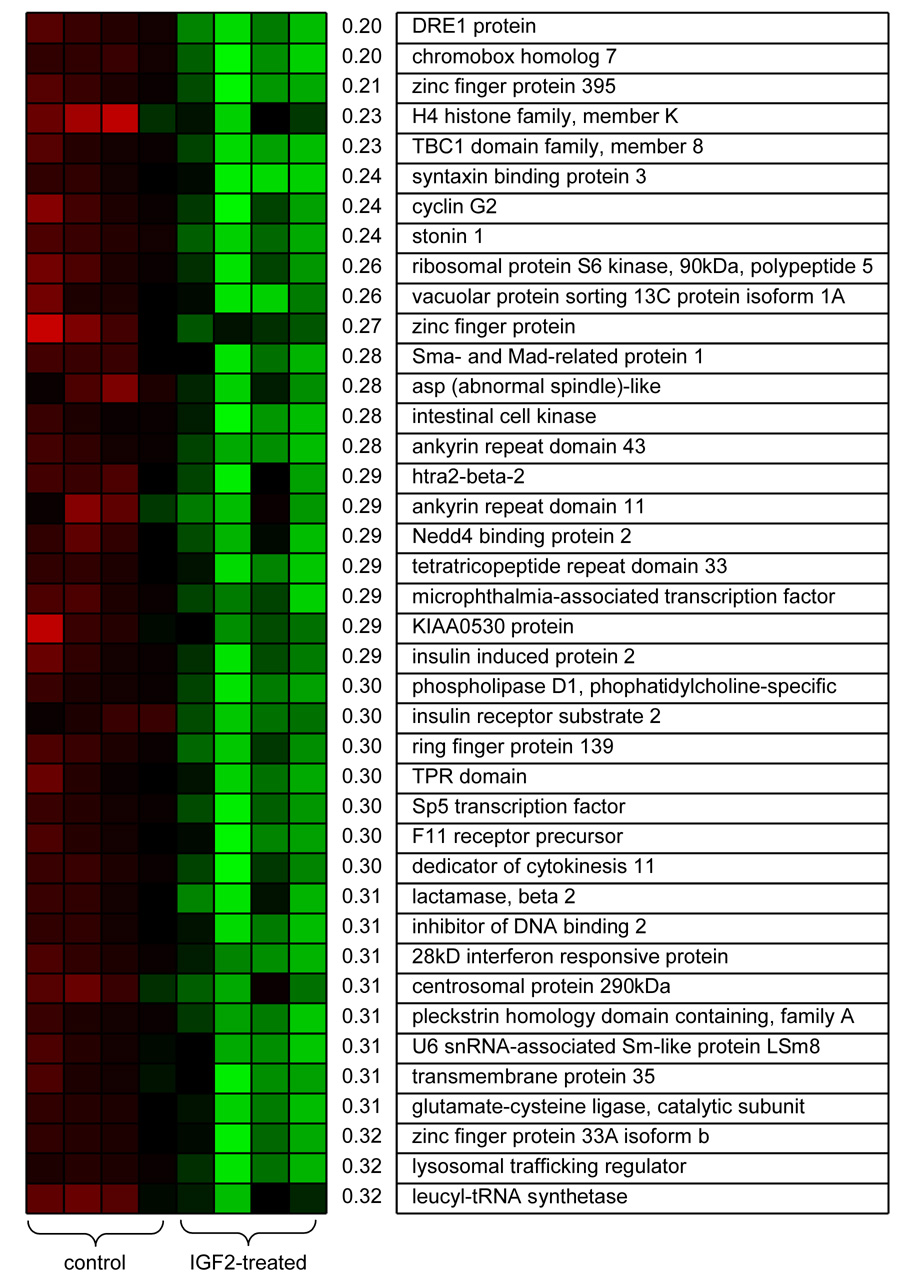
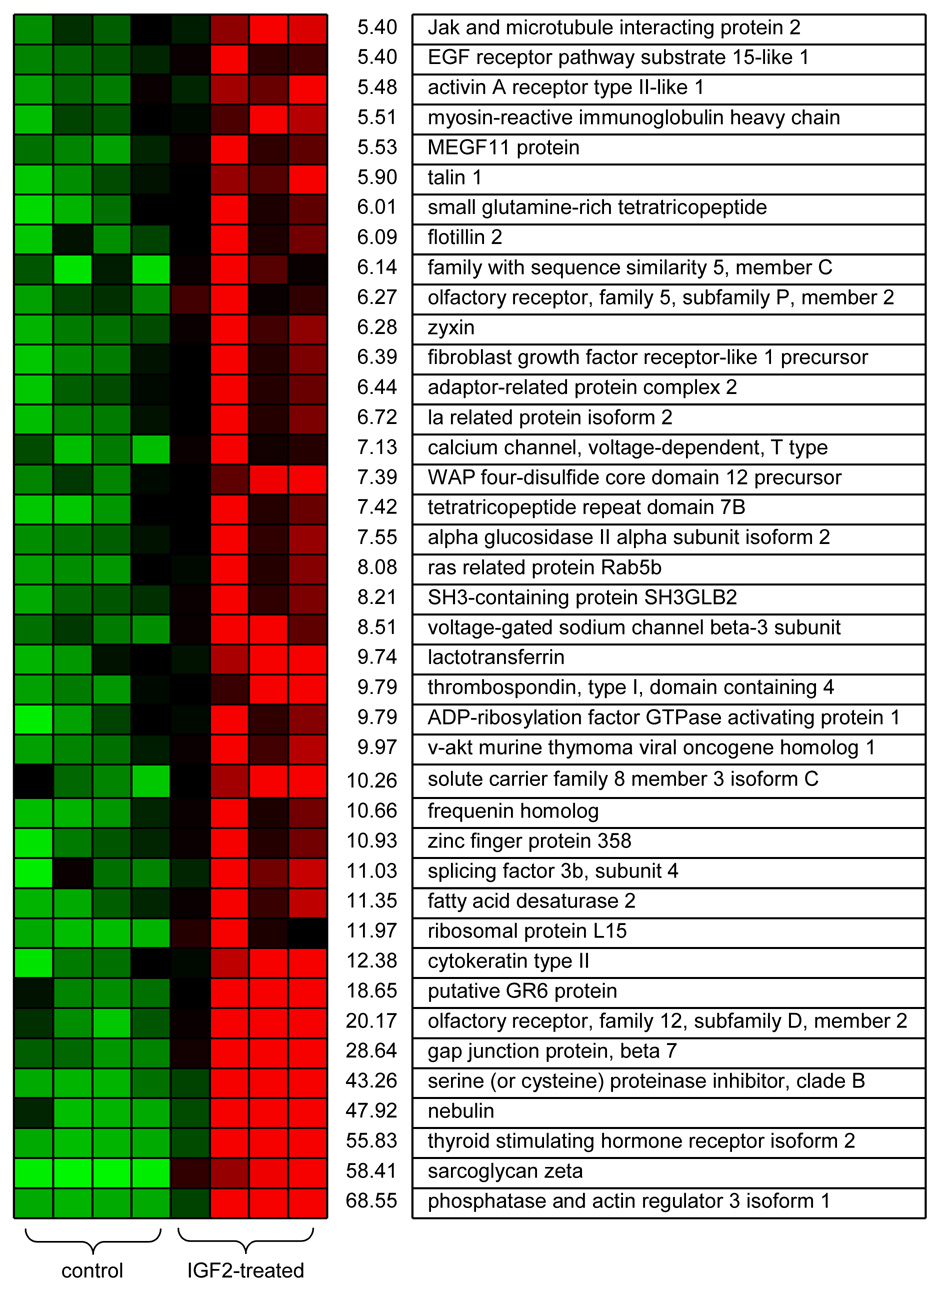
Microarray data identified a group of 908 genes whose mRNA expression levels were significantly altered at p < 0.01 by IGF2 treatments with a fold change above 2 or below 0.5. Illustrated in Fig. 2 and Fig.3 is a list of the top 40 genes most downregulated (0.20 to 0.32-fold change) and most upregulated (5.4 to 69-fold change). Although the color-coded mRNA expression patterns of the fourth control sample and the first IGF2-treated sample in Fig. 2 and Fig. 3 deviated from the other color patterns all samples were included for analyses. Real-time PCR analysis indicated variations in the array-derived mRNA expression patterns were caused during microarray processing. The downregulated genes included insulin induced protein 2 (0.29-fold), insulin receptor substrate 2 (0.30-fold) and phospholipase D1 (0.30-fold) and the list of the upregulated genes had EGF receptor pathway substrate homolog (5.4-fold), FGF1 receptor-like precursor (6.4-fold), Ras related protein Rab5b (8.1-fold) and v-Akt murine viral oncogene homolog 1 (10-fold).
Figure 2.
Top forty genes significantly downregulated by IGF2 administration. The first 4 color-coded columns correspond to 4 control samples and the second 4 columns to 4 IGF2-treated samples, where red and green colors indicate “upregulation” and “downregulation,” respectively. The values next to the color patterns designate fold-changes.
Figure 3.
Top forty genes significantly upregulated by IGF2 administration. The first 4 color-coded columns correspond to 4 control samples and the second 4 columns to 4 IGF2-treated samples, where red and green colors indicate “upregulation” and “downregulation,” respectively. The values next to the color patterns designate fold-changes.
3.2. Identification of PI3K and TGFβ signaling pathways
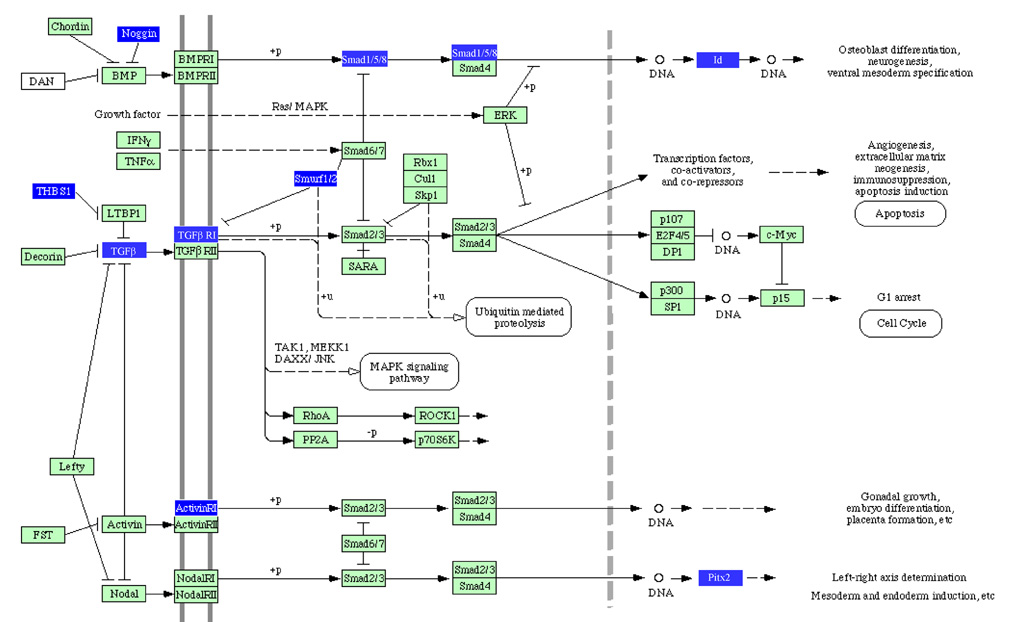
The extreme changers in Fig. 2 and Fig. 3 indicate IGF2-induced alterations ranges in various transcriptional regulatory networks. These alone do not allow us to identify particular signaling pathways, so we employed Pathway-Express to find the most relevant pathways in the context of complex molecular interactions. The two highest ranked were the TGFβ pathway (impact factor: 10.3) and the PI3K pathway (impact factor: 35.7). In the TGFβ pathway three gene members (TGFβ, Noggin and thrombospondin 1 - THBS1) were perturbed at the entry point of the pathway (Fig. 4) and many of the altered genes were linked to BMP. TGFβ was a key stimulator in the pathway whose mRNA expression level was elevated while Noggin and THBS1 were inhibitors and their mRNA levels were reduced. Since those three genes appeared at the very beginning of this TGFβ pathway their perturbations are widely propagated throughout the pathway that exhibit the second highest impact factor.
Figure 4.
TGFβ pathway as affected by IGF2 administration based on Pathway-Express. There are 10 differentially expressed component boxes with an impact factor of 10.3. The upregulated genes include TGFβ (control: 0.57 ± 0.18, mean ± s.d.; IGF2: 2.3 ± 0.94), TGFβ RI (control: 0.85 ± 0.23; IGF2: 7.4 ± 12), Noggin (control: 0.47 ± 0.28; IGF2: 1.9 ± 0.53), THBS1 (control: 0.76 ± 0.25; IGF2: 2.7 ± 1.6), Smurf1 (control: 0.73 ± 0.14; IGF2: 2.0 ± 0.91), Smurf2 (control: 0.75 ± 0.25; IGF2: 1.8 ± 0.79) and Activin RI (control: 0.92 ± 0.12; IGF2: 7.3 ± 12) while the downregulated genes are Smad1 (control: 1.9 ± 0.62; IGF2: 0.53 ± 0.37), Id (control: 1.4 ± 0.41; IGF2: 0.65 ± 0.37) and Pitx2 (control: 1.6 ± 0.70; IGF2: 0.66 ± 0.27).
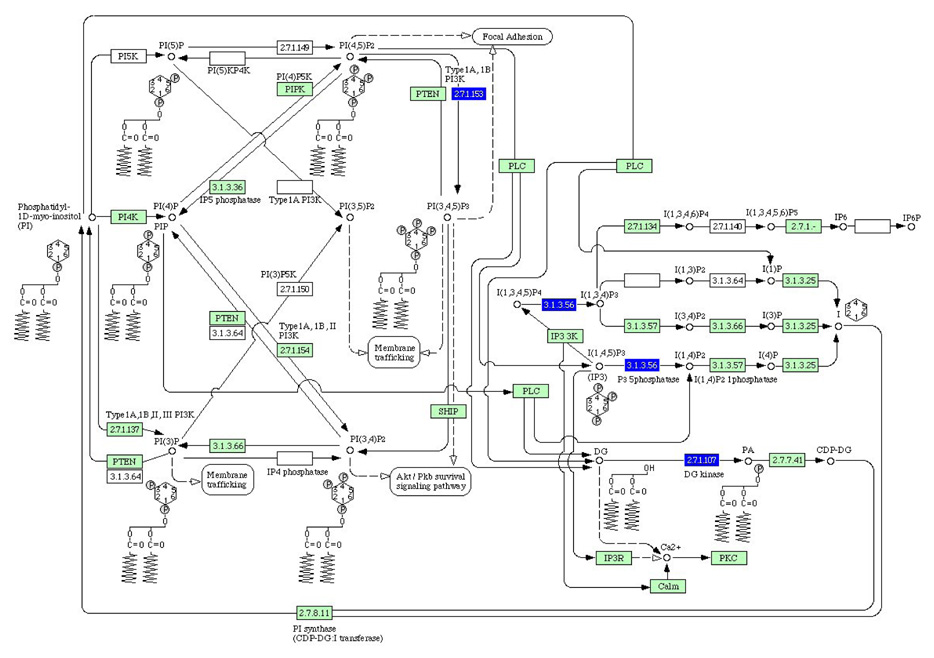
The highest score was given to the PI3K pathway whose impact factor was roughly 3.5 times higher than the TGFβ pathway. Three affected genes in the PI3K pathway were type 1A/1B PI3 kinase, P3 5-phosphatase and DG kinase (Fig. 5). Type 1A/1B PI3 kinase was involved in a phosphorylation process from phosphatidylinositol (5,5)-bisphosphate to phosphatidylinositol (3,4,5)-triphosphate and P3 5-phosphatase conducted a dephosphorylation reaction of Inositol (1,3,4,5)-tetraphosphate and Inositol (1,4,5)-triphosphate.
Figure 5.
PI3K pathway as affected by IGF2 administration based on Pathway-Express. There are 4 differentially expressed component boxes (blue, down-regulated) corresponding to 3 genes with an impact factor of 35.7. Those genes include type 1A/1B PI3 kinase, P3 5-phosphatase and DG kinase.
3.3. IGF2-driven phosphorylation of Akt protein and GSK3β protein
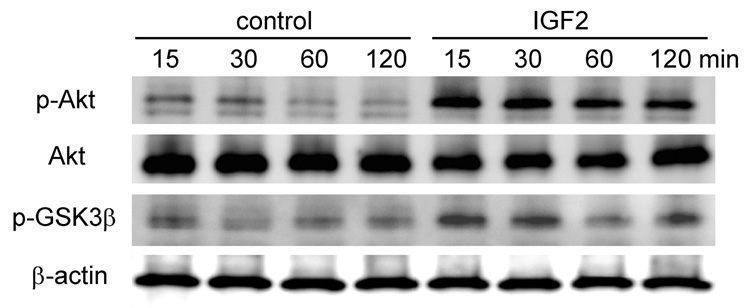
To evaluate the role of the PI3K signaling pathway in the observed responses to IGF2 we examined the phosphorylation state of Akt and GSK3β proteins, two of the critical kinases in the PI3K pathway. Western analysis showed that in 15 min after the onset of IGF2 administration the levels of phosphorylated Akt (p-Akt) and GSK3β (p-GSK3 β) were significantly increased. Their elevated levels were sustained at least for 2 h (Fig. 6), so the PI3K signaling pathway is involved in IGF2-treated chondrocytes.
Figure 6.
Western blots illustrating elevated phosphorylation of Akt and GSKβ in response to 100 ng/ml IGF2 at 4 time-points (15, 30, 60, and 120 min after IGF2 administration). Akt and β-actin proteins were used as control.
3.4. Effects of LY294002 on p-Akt, p-GSK3β, and IGF2-driven genes
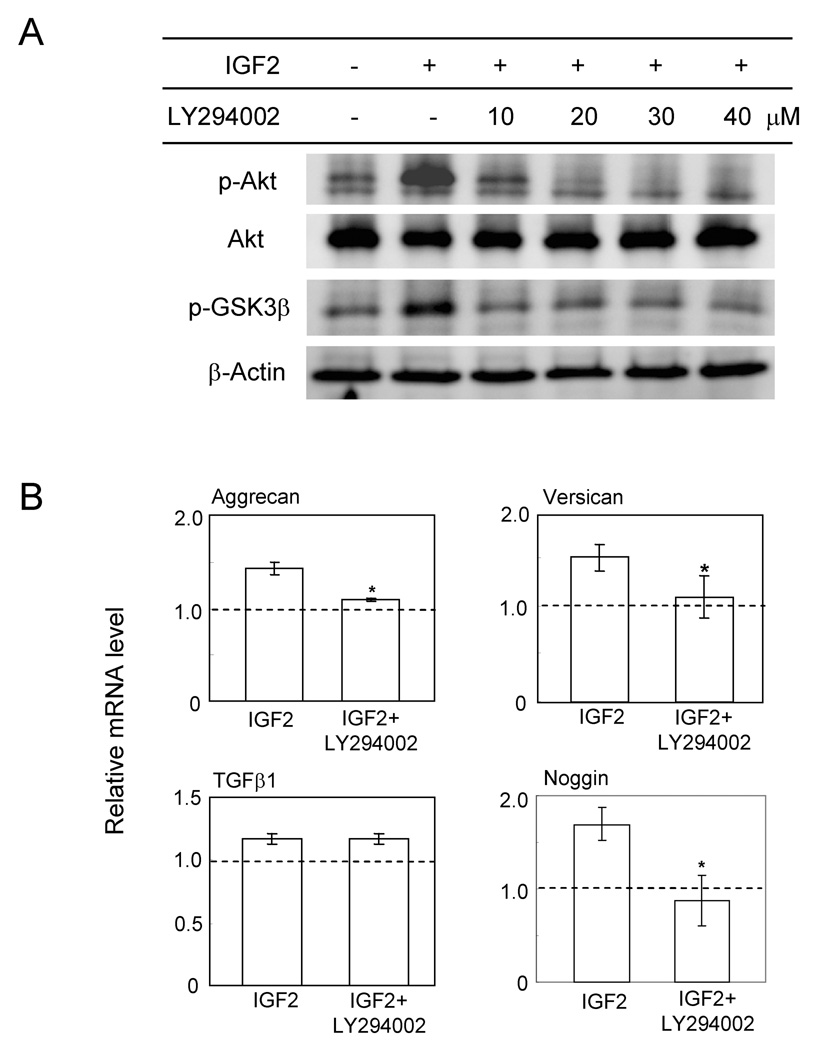
To evaluate the role of the PI3K pathway particularly in regulation of mRNA expression of proteoglycan and TGFβ genes we examined the responses to IGF2 in the presence and absence of LY294002 and the concentration of 20 µM LY294002 was sufficient to block IGF2-induced activation of Akt phosphorylation (Fig.7). Pre-incubation with 10 µM LY294002 and administration of IGF2 revealed IGF2-driven elevation of Aggrecan mRNA, Versican mRNA and Noggin mRNA was suppressed almost completely but IGF2-induced upregulation of TGFβ mRNA or THBS1 mRNA was unchanged. The mRNA levels of two other proteoglycans (Decorin and Biglycan) were not affected by administration of IGF2 (data not shown).
Figure 7.
Effects of blocking the PI3K pathway by LY294002. (A) Dosage response of p-Akt and p-GSK3β to LY294002 at 10, 20, 30 and 40 µM. (B) Relative mRNA levels of Aggrecan, Versican, TGFβ1 and Noggin in response to IGF2 in the presence and absence of LY294002.
4. Discussion
A recently developed systems biology-based tool (Pathway-Express) conducted an impact analysis for identification of IGF2 driven signaling pathways. Two conventional approaches for searching pathways include an “over-representation” method and a “functional class scoring” method such as the gene set enrichment analysis (Subramanian et al., 2005; Hamamura et al. 2007). Unlike those existing ontology tools that consider only the presence and/or fold-change of genes in a given pathway Pathway-Express takes into account the upstream/downstream positions of genes in the pathway. The impact factor, which is used to rank putative signaling pathways, includes summation of the perturbation factors for all genes on the given pathway considering the role of any given gene (+1 for induction and −1 for repression) and the number of the downstream genes, but any in silico prediction from mRNA expression data needs to be verified by biological experiments. We evaluated the role of PI3K focusing on the phosphorylation state of Akt and GSK3β in the presence and absence of LY294002. In the PI3K pathway Akt phosphorylates GSK3β at Ser9 and blocks GS3Kβ-driven degradation of β catenin. As transcription of proteoglycans such as Versican is mediated by β catenin signaling (Rahmani et al. 2005) the results support the critical role of PI3K in chondrogenesis.
Microarray data and protein analysis from this study indicates that administration of IGF2 to human chondrocytes activates the PI3K and TGFβ pathways. IGF2-driven phosphorylation of Akt and GSK3β in the PI3K pathway was shown and inhibition of PI3K by LY294002 revealed that upregulation of Aggrecan mRNA and Versican mRNA was mediated by PI3K. LY294002 did not affect the TGFβ1 mRNA level, but it suppressed the IGF2-driven mRNA elevation of Noggin. Noggin is included as a member in the TGFβ pathway and the results indicate that the PI3K pathway has in part a crosstalk to the TGFβ pathway.
As a response to IGF1 proteoglycan synthesis is considered to be mostly regulated at the translational level. The mRNA levels of Aggrecan and Versican were elevated by IGF2 although the levels of Decorin mRNA and Biglycan mRNA were not affected, so, in response to IGF2 proteoglycans are likely to be regulated at transcriptional and translational levels.
IGF1 and TGFβ have additive effects regarding the effect of IGF1 on chondrogenesis of bone marrow mesenchymal stem cells and ERK mediates the responses to TGFβ and in part to IGF1 (Longobardi et al., 2006). Activation of ERK has been reported as an IGF1 response in chondrocytes but inhibition of ERK did not affect proteoglycan synthesis (Starkman et al., 2005). Further analysis of the IGF2 response is needed to examine changes in the protein level of the TGFβ family and the associated role of ERK in regulation of proteoglycan molecules.
One of the potential clinical applications of IGF1 is lengthening long bones such as tibiae and femora by activating proliferation and differentiation of chondrocytes in the growth plate (Abbaspour et al., 2007). Administration of human recombinant IGF1 alone causes side effects including lymphoid hyperplasia, coarsening of the face and increased body fat. A combinatory administration of IGF1, IGFBP3 and/or growth hormone is therefore suggested (Rosenbloom, 2007). Injection of IGF2 to a mouse hind limb stimulated a longitudinal growth of femora (personal communication) and a combinatory administration including IGF2 could be considered to improve the current IGF1-based treatment. In summary, administration of IGF2 to human chondrocytes induced the PI3K and TGFβ pathways and transcriptional activation of chondrogenic genes such as Aggrecan and Versican was mediated by the PI3K pathway.
Acknowledgements
We thank GM Malacinski for the critical reading of this manuscript. This study was in part supported by NIH grant R01-AR50008 (HY).
Footnotes
Publisher's Disclaimer: This is a PDF file of an unedited manuscript that has been accepted for publication. As a service to our customers we are providing this early version of the manuscript. The manuscript will undergo copyediting, typesetting, and review of the resulting proof before it is published in its final citable form. Please note that during the production process errors may be discovered which could affect the content, and all legal disclaimers that apply to the journal pertain.
References
- Abbaspour A, Takata S, Matsui Y, Katoh S, Takahashi M, Yasui N. Continuous infusion of insulin-like growth factor-1 into the epiphysis of the tibia. Int Orthop. 2007 doi: 10.1007/s00264-007-0336-7. Epub ahead of print. [DOI] [PMC free article] [PubMed] [Google Scholar]
- Bonassar LJ, Trippel SB. Interaction of epidermal growth factor and insulin-like growth factor-1 in the regulation of growth plate chondrocytes. Exp Cell Res. 1997;234:1–6. doi: 10.1006/excr.1997.3574. [DOI] [PubMed] [Google Scholar]
- Ciarmatori S, Kiepe D, Haarmann A, Huegel U, Tonshoff B. Signaling mechanisms leading to regulation of proliferation and differentiation of the mesenchymal chondrogenic cell line RCJ3.1C5.18 in response to IGF-I. J Mol Endocrinol. 2007;38:493–508. doi: 10.1677/jme.1.02179. [DOI] [PubMed] [Google Scholar]
- Dailey L, Laplantine E, Priore R, Basilico C. A network of transcriptional and signaling events is activated by FGF to induce chondrocyte growth arrest and differentiation. J Cell Biol. 2003;161:1053–1066. doi: 10.1083/jcb.200302075. [DOI] [PMC free article] [PubMed] [Google Scholar]
- Denley A, Cosgrove LJ, Booker GW, Wallace JC, Forbes BE. Molecular interactions of the IGF system. Cytokine Growth Factor Rev. 2005;16:421–439. doi: 10.1016/j.cytogfr.2005.04.004. [DOI] [PubMed] [Google Scholar]
- Draghici S, Khatri P, Tarca AL, Amin K, Done A, Voichita C, et al. A systems biology approach for pathway level analyasis. Genome Res. 2007;17:1537–1545. doi: 10.1101/gr.6202607. [DOI] [PMC free article] [PubMed] [Google Scholar]
- Fiedler J, Brill C, Blum WF, Brenner RE. IGF-I and IGF-II stimulate directed cell migration of bone-marrow-derived human mesenchymal progenitor cells. Biochem. Biophy. Res. Comm. 20066;345:1177–1183. doi: 10.1016/j.bbrc.2006.05.034. [DOI] [PubMed] [Google Scholar]
- Gaunt TR, Cooper JA, Miller GJ, Day IN, O’Dell SD. Positive associations between single nucleotide polymorphisms in the IGF2 gene region and body mass index in adult males. Hum Mol Genet. 2001;10:1491–1501. doi: 10.1093/hmg/10.14.1491. [DOI] [PubMed] [Google Scholar]
- Goldring MB, Birkhead JR, Suen LF, Yamin R, Mizuno S, Glowacki J, et al. Interleukin-1β-modulated gene expression in immortalized human chondrocytes. J Clin Invest. 1994;94:2307–2316. doi: 10.1172/JCI117595. [DOI] [PMC free article] [PubMed] [Google Scholar]
- Hamamura K, Liu Y, Yokota H. Microarray analysis of thapsigargin-induced stress to endoplasmic reticulum of mouse osteoblast. J Bone Miner Metab. 2007 doi: 10.1007/s00774-007-0825-1. Epub ahead of print. [DOI] [PubMed] [Google Scholar]
- Han F, Adams CS, Tao Z, Williams CJ, Zaka R, Tuan RS, et al. Transforming growth factor-β1 (TGF-β1) regulates ATDC5 chondrogenic differentiation and fibronectin isoform expression. J Cell Biochem. 2005;95:750–762. doi: 10.1002/jcb.20427. [DOI] [PubMed] [Google Scholar]
- Humbel RE. Insulin-like growth factors I & II. Eur J Biochem. 1990;190:445–462. doi: 10.1111/j.1432-1033.1990.tb15595.x. [DOI] [PubMed] [Google Scholar]
- Iannotti JP, Brighton CT, Iannotti V, Ohishi T. Mechanism of action parathyroid hormone-induced proteoglycan synthesis in the growth plate chondrocyte. J Orthop Res. 1990;8:136–145. doi: 10.1002/jor.1100080118. [DOI] [PubMed] [Google Scholar]
- Kamiya N, Watanabe H, Habuchi H, Takagi H, Shinomura T, Shimizu K, et al. Versican/PG-M regulates chondrogenesis as an extracellular matrix molecule crucial for mesenchymal condensation. J Biol Chem. 2006;281:2390–2400. doi: 10.1074/jbc.M509341200. [DOI] [PubMed] [Google Scholar]
- Khatri P, Voichita C, Kattan K, Ansari N, Khatri A, Georgescu C, et al. Onto-tools: new additions and improvements in 2006. Nucleic Acids Res. 2007;35 doi: 10.1093/nar/gkm327. W206-11doi:10.1093/nar/gkm327. [DOI] [PMC free article] [PubMed] [Google Scholar]
- Kiepe D, Ciarmatori S, Hoeflich A, Wolf E, Tonshoff B. Insulin-like growth factor (IGF)-I stimulates cell proliferation and induces IGF binding protein (IGFBP)-3 and IGFBP-5 gene expression in cultured growth plate chondrocytes via distinct signaling pathways. Endocrinology. 2005;146:3096–3104. doi: 10.1210/en.2005-0324. [DOI] [PubMed] [Google Scholar]
- Koike M, Yamanaka Y, Inoue Y, Tanaka H, Nishimura R, Seino Y. Insulin-like growth factor-1 rescues the mutated FGF receptor 3 (G380R) expressing ATDC5 cells from apoptosis through phosphatidylinositol 3-kinase and MAPK. J Bone Miner Res. 2003;18:2043–2051. doi: 10.1359/jbmr.2003.18.11.2043. [DOI] [PubMed] [Google Scholar]
- Longobardi L, O’Rear L, Aakula S, Johnstone B, Shimer K, Chytil A, et al. Effect of IGF-I in the chondrogenesis of bone marrow mesenchymal stem cells in the presence or absence of TGF-β signaling. J Bone Miner Res. 2006;21:626–636. doi: 10.1359/jbmr.051213. [DOI] [PubMed] [Google Scholar]
- Matsumoto K, Kamiya N, Suwan K, Atsumi F, Shimizu K, Shinomura T, et al. Identification and characterization of versican/PG-M aggregates in cartilage. J Biol Chem. 2006;281:18257–18263. doi: 10.1074/jbc.M510330200. [DOI] [PubMed] [Google Scholar]
- Nasatzky E, Azran E, Dean DD, Boyan BD, Schwartz Z. Parathyroid hormone and transforming growth factor-beta1 coregulate chondrocyte differentiation in vitro. Endocrine. 2000;13:305–313. doi: 10.1385/ENDO:13:3:305. [DOI] [PubMed] [Google Scholar]
- O’Dell SD, Day INM. Molecules in focus insulin-like growth factor II (IGFII) Int J Biochem Cell Biol. 1998;30:767–771. doi: 10.1016/s1357-2725(98)00048-x. [DOI] [PubMed] [Google Scholar]
- Rahmani M, Read JT, Carthy JM, McDonald PC, Wong BW, Esfandiarei M, et al. Regulation of the versican promoter by the beta-catenin-T-cell factor complex in vascular smooth muscle cells. J Biol Chem. 2005;280:13019–13028. doi: 10.1074/jbc.M411766200. [DOI] [PubMed] [Google Scholar]
- Rosenbloom AL. The role recombinant insulin-like growth factor I in the treatment of the short child. Curr Opin Pediatr. 2007;19:458–464. doi: 10.1097/MOP.0b013e3282094126. [DOI] [PubMed] [Google Scholar]
- Schmid C. Insulin-like growth factors. Cell Biol Int. 1995;19:445–457. doi: 10.1006/cbir.1995.1088. [DOI] [PubMed] [Google Scholar]
- Schneiderbauer MM, Dutton CM, Sully SP. Signaling ‘cross-talk’ between TGF-β1 and ECM signals in chndrocytic cells. Cell Signal. 2004;16:1133–1140. doi: 10.1016/j.cellsig.2004.03.004. [DOI] [PubMed] [Google Scholar]
- Shinar DM, Endo N, Halperin D, Rodan GA, Weinreb M. Differential expression of insulin-like growth factor-I (IGF-I) and IGF-II messenger ribonucleic acid in growth rat bone. Endocrinology. 1993;132:1158–1167. doi: 10.1210/endo.132.3.8440176. [DOI] [PubMed] [Google Scholar]
- Smith CW, Klaasmeyer JG, Woods TL, Jones SJ. Effects of IGF-I, IGF-II, bFGF and PDGF on the initiation of mRNA translation in C2C12 myoblasts and differentiating myoblasts. Tissue & Cell. 1999;31:403–412. doi: 10.1054/tice.1999.0033. [DOI] [PubMed] [Google Scholar]
- Starkman BG, Cravero JD, DelCarlo M, Loeser RF. IGF-I stimulation of proteoglycan synthesis by chondrocytes requires activation of PI 3-kinase patyway but not ERK MAPK. Biochem J. 2005;389:723–729. doi: 10.1042/BJ20041636. [DOI] [PMC free article] [PubMed] [Google Scholar]
- Subramanian A, Tamayo P, Mootha VK, Mukherjee S, Eber BL, Gillette MA, et al. Gene set enrichment analysis: A knowledge-based approach for interpreting genome-wide expression profiles. Proc Natl Acad Sci USA. 2005;102:12545–12550. doi: 10.1073/pnas.0506580102. [DOI] [PMC free article] [PubMed] [Google Scholar]
- Sugimori K, Matsui K, Motomura H, Tokoro T, Wang J, Higa S, et al. BMP-2 prevents apoptosis of the N1511 chondrocytic cell line through PI3K/Akt-mediated NF-kappaB activation. J Bone Miner Metab. 2005;23:411–419. doi: 10.1007/s00774-005-0622-7. [DOI] [PubMed] [Google Scholar]
- Wang YJ, Shi Q, Sun P, Zhou Q, Darowish M, Li TF, et al. Insulin-like growth factor-1 treatment prevents anti-Fas antibody-induced apoptosis in endplate chondrocytes. Spine. 2006;31:736–741. doi: 10.1097/01.brs.0000208128.49912.64. [DOI] [PubMed] [Google Scholar]
- Watanabe H, Yamada Y, Kimata K. Roles of aggrecan, a large chondroitin sulfate proteoglycan, in cartilage structure and function. J Biochem (Tokyo) 1998;124:687–693. doi: 10.1093/oxfordjournals.jbchem.a022166. [DOI] [PubMed] [Google Scholar]
- Watanabe H, Kimata K, Line S, Strong D, Gao LY, Kozak CA, et al. Mouse cartilage matrix deficiency (cmd) caused by a 7 bp deletion in the aggrecan gene. Nat Genet. 1994;7:154–157. doi: 10.1038/ng0694-154. [DOI] [PubMed] [Google Scholar]
- Yonekura A, Osaki M, Hirota Y, Tsukazaki T, Miyazaki Y, Matsumoto T, et al. Transforming growth factor-bata stimulates articular chondrocyte cell growth through p44/42 MAP kinase (ERK) activation. Endocr J. 1999;46:545–553. doi: 10.1507/endocrj.46.545. [DOI] [PubMed] [Google Scholar]
- Yoon BS, Lyons KM. Multiple functions of BMPs in chondrogenesis. J Cell Biochem. 2004;93:93–103. doi: 10.1002/jcb.20211. [DOI] [PubMed] [Google Scholar]


