

Abstract
Background:
Although the influence of VKORC1 and CYP2C9 polymorphisms on warfarin response has been studied, variability in dose explained by CYP2C9 and VKORC1 is lower among African–Americans compared with European–Americans. This has lead investigators to hypothesize that assessment of VKORC1 haplotypes may help capture a greater proportion of the variability in dose for this under-represented group. However, the inadequate representation of African–Americans and the assessment of a few VKORC1 polymorphisms have hindered this effort.
Methods:
To determine if VKORC1 haplotypes or haplotype groups explain a higher variability in warfarin dose, we comprehensively assessed VKORC1 polymorphisms in 273 African–Americans and 302 European–Americans. The influence of VKORC1 polymorphisms, race-specific haplotypes and haplotype groups on warfarin dose was evaluated in race-stratified multivariable analyses after accounting for CYP2C9 (*2, *3, *5, *6 and *11) and clinical covariates.
Results:
VKORC1 explained 18% (30% with CYP2C9) variability in warfarin dose among European–Americans and 5% (8% with CYP2C9) among African–Americans. Four common haplotypes in European–Americans and twelve in African–Americans were identified. In each race VKORC1 haplotypes emerged into two groups: low-dose (Group A) and high-dose (Group B). African–Americans had a lower frequency of Group A haplotype (10.6%) compared with European–Americans (35%, p < 0.0001).The variability in dose explained by VKORC1 haplotype or haplotype groups was similar to that of a single informative polymorphism.
Conclusions:
Our findings support the use of CYP2C9, VKORC1 polymorphisms (rs9934438 or rs9923231) and clinical covariates to predict warfarin dose in both African– and European–Americans. A uniform set of common polymorphisms in CYP2C9 and VKORC1, and limited clinical covariates can be used to improve warfarin dose prediction for a racially diverse population.
Keywords: African–Americans, cohort study, CYP2C9, European–Americans, pharmacogenetics, VKORC1 haplotypes, warfarin
Although investigations have identified the influence of several genes on warfarin response, the bulk of the evidence supports the influence of polymorphisms in two genes; cytochrome P4502C9 (CYP2C9) and vitamin K epoxide reductase complex 1 (VKORC1) [1]. Among European–Americans and Asians these genes have demonstrated a consistently significant influence on warfarin response accounting for up to 35% variability in dose (up to 60% with clinical factors) [2-23]. Among African–Americans their influence has been weaker and less consistent [24-30], leading investigators to hypothesize that assessment of VKORC1 haplotypes may capture the variation in dose explained in this under-represented group. However, the inadequate representation of African–Americans and the assessment of a limited number of VKORC1 polymorphisms have hindered this effort.
Rieder et al. after comprehensively assessing VKORC1 polymorphisms, concluded that haplotypes are no more informative (in predicting warfarin dose) than one of five single segregating SNPs: rs2359612, rs8050894, rs9934438, rs9923231, rs7196161 among European–Americans [13]. The low-dose and high-dose haplotypes identified accounted for 96% of all haplotypes among European–American patients. These haplotypes accounted for only 62% of haplotypes in African–American samples (n = 96, Coriell Cell Repository) [13] highlighting the need for additional studies in African–American patients on warfarin therapy to understand the influence of these (and potentially other) haplotypes on warfarin dose in this population.
Recognizing that the VKORC1 haplotype structure may differ significantly between persons of European versus African descent [31-33], at least partially explaining racial differences in warfarin requirements [34] we comprehensively assessed VKORC1 polymorphisms among African– and European–Americans to determine race-specific haplotypes and haplotype groups. We then evaluated the influence of single VKORC1 polymorphisms, haplotypes and haplotype groups on warfarin dose in race-stratified analyses after adjustment for CYP2C9 (*2, *3, *5, *6 and *11) and clinical variables.
Methods
The Pharmacogenetic Optimization of Anticoagulation Therapy (POAT) study is a prospective cohort study aimed at defining the influence of CYP2C9 and other polymorphisms on warfarin response. The study is being conducted at the University of Alabama at Birmingham (UAB; AL, USA), The Kirklin anticoagulation clinic (TKC-AC; AL, USA) and the Jefferson Clinic PC (AL, USA), Jefferson County Health System (CGH-JC) under the approval of the respective Institutional Review Boards.
Inclusion & exclusion
Patients aged 20 years and over, identified at the initiation of therapy, were considered eligible if the intended duration of therapy was 2 years or longer and the target international normalized ratio (INR) range was 2–3.
Data collection
A structured interview was used at the time of enrolment to obtain a detailed medical (indication for therapy, concomitant medications, and comorbid conditions), sociodemographic (self-reported race, age, gender, education, annual household income, medical insurance, occupation) and lifestyle (smoking, alcohol use, physical activity, height and weight, and dietary vitamin K intake) history. Patients were followed monthly for up to 2 years from initiation of therapy. The frequency of follow-up was dependent on stability of anticoagulation control as required by the clinical standards. Therefore patients with more frequent INRs outside target range were monitored more closely than those with INRs in target range. At each visit factors influencing warfarin response such as dose, INR, concurrent medications, dietary vitamin K, alcohol intake, compliance and level of physical activity were documented as detailed in recent publications [26,27,30].
SNP selection & genotyping
Blood sample collection, DNA extraction and genotyping methodology for CYP2C9 (*2, *3, *5, *6, *11) are detailed in recent manuscripts [26,27]. In order to verify allele frequencies in our population, all SNPs in VKORC1 with reported minor allele frequency (MAF) of 2% or greater [101] were assessed using the Sequenom (CA, USA) iPLEX® technology at the Broad Institute. The 2% cut-off was implemented to ensure the assessment of all potentially significant SNPs. The overall genotyping accuracy was greater than 98%. A total of 4 SNPs (rs17886199, rs17878338, rs7196161 and rs9923231) were assessed using pyrosequencing at the Heflin Center Genomics Core Laboratory at UAB.
PCR and sequencing primers for these four VKORC1 polymorphisms, designed using Assay Design 1.0 program (Biotage, Uppsala, Sweden) are presented in Table 1. For all the SNPs 10 μl of the PCR product was bound to steptavidin (SA) coated sepharose beads (GE Biosciences, UK) via a biotin labeled PCR primer by shaking for 10 min. The SA-sepharose bound DNA was washed using a PyroMark vacuum workstation (Biotage, Uppsala, Sweden) in 70% ethanol, denatured in 0.2 N NaOH with a final wash in 10mM Tris-Acetate pH 7.6. The resulting single stranded DNA was eluted off the vacuum tool into a 96-well plate containing 0.3 μM of sequencing primer; the plate was then heated to 80°C and allowed to cool to 25°C prior to sequence analysis. Sequence analysis was performed by standard pyrosequencing reactions using the PSQHS96A pyrosequencing instrument (Biotage, Uppsala, Sweden).
Table 1.
PCR and sequencing primers for assessing four VKORC1 SNPs by pyrosequencing.
| SNP ID | Primers | Primer sequence |
|---|---|---|
| rs17886199 | Forward | 5′CCCCACTCCTAGCAATCTTGGTG3′ |
| Reverse | Biotin-5′CTCACTTTGGGCAACAGAGCCAG3′ | |
| Sequencing | 5′GTCTTTTAATTGGTTTAAG3′ | |
| rs9923231 | Forward | 5′TGTTGGCCAGGCTTGTCTTAAAC3′ |
| Reverse | Biotin-5′AGCCAGCAGGAGAGGGAAATATC3′ | |
| Sequencing | 5′GCGTGAGCCACCGCA3′ | |
| rs7196161 | Forward | 5′ATGTGAGACAGTCCCACTCTGC3′ |
| Reverse | Biotin-5′TGTAATCCCAGCACTTTAGGAAGCCA3′ | |
| Sequencing | 5′ACTCCTGACCTCATGATC3′ | |
| rs17878338 | Forward | 5′CCGACCTCAGGTGATCTGCC3′ |
| Reverse | Biotin-5′CAGAGGCAGCTGTGGGTAAGG3′ | |
| Sequencing | 5′CTGCTTTGGCCTCCC3′ |
PCR conditions for rs17878338 and rs9923231 were an initial denaturation of 96°C for 5 min followed by 35 cycles of 94°C for 20 s, 56°C for 20 s, and 72°C for 15 s. PCR conditions for rs17886199 were similar except that 60°C was used as the annealing temperature. Amplification of rs7196161 required a two-step ‘touchdown’ PCR reaction. Following denaturation, the annealing temperature was decreased 1°C every two cycles from 63°C down to 57°C. The second phase consisted of 30 cycles with a final annealing temperature of 56°C.
Outcome definitions & statistical methods
Analysis of variance was used to assess group differences for continuous variables and χ2 test of independence for categorical variables. Hardy–Weinberg Equilibrium (HWE) assumption was tested using the χ2 test and exact test which was obtained using a Markov Chain Monte Carlo algorithm (Arlequin version 3.11) [35].
Dose (mg/day) was defined as the average maintenance dose after the attainment of therapeutic anticoagulation (INR range 2–3). The influence of individual VKORC1 SNPs on dose (log transformed to attain normality) effects was evaluated in race-stratified univariate analyses. VKORC1 SNPs explaining 1.0% or more of the variability in dose were then evaluated using multivariable analyses.
Race-stratified linear-regression analysis was conducted to assess the influence of each individual VKORC1 SNP on dose after adjustment for CYP2C9, age, gender, BMI, socio-demographic factors, smoking status, level of physical activity, alcohol, vitamin K intake, presence of comorbid conditions (e.g., congestive heart failure [CHF], renal failure, etc.) and drug interactions (e.g., amiodarone and statins). Backward elimination technique was used to select influential predictors (p < 0.2). Geno-types effects were evaluated in additive (geno-type included as covariates with 3-levels) and dominant models (genotypes included as covariates with 2 levels; wild-type versus variant). All analyses were performed using SAS version 9.1 (SAS Institute, NC, USA) at a nondirectional α of 0.05.
VKORC1 haplotypes for each individual were inferred with use of the PHASE program (version 2.0.2) independently for African–Americans and European–Americans. To ensure robust and stable haplotype inference we included SNPs with MAF greater than or equal to 5% within our cohort. In practice, haplotype phase information is usually unknown and needs to be estimated, where uncertainties (multiple haplotype configurations are possible for each individual) are induced. If such uncertainties from haplotype inference are not taken into account, such as using only the most likely haplotype pairs for each individual in the subsequent analysis, haplotype-based analyses using inferred haplotypes may lose power and may be biased [36,37]. Under a generalized linear model framework, HAPLO.STATS (R package, version 1.3.1) estimates haplotype frequencies and regression parameters jointly, and thus takes the uncertainty from haplotype inference into account [38,39]. To assess the influence of VKORC1 haplotypes, CYP2C9 and clinical covariates on dose we evaluated both additive and dominant models using regression analyses implemented in HAPLO.STATS.
Genealogic trees were constructed on the basis of dissimilarity between haplotypes and with use of the unweighted pair group method with arithmetic mean (UPGMA) clustering method implemented in Phylogeny Inference Package (PHYLIP) version 3.67 [102]. The influence of VKORC1 haplotype groups on dose after adjustment for CYP2C9 and clinical covariates was evaluated in additive and dominant models by regression analyses in HAPLO.STATS. Tukey–Kramer type corrections were made to adjust for multiple testing.
Results
Of the 621 eligible patients asked to participate in the study, 43 (6.9%) declined participation. The enrolled cohort was comprised mainly of African–Americans (47.2%) and European–Americans (52.2%). The cohort characteristics and prevalence of variant CYP2C9 genotypes, detailed in previous reports [26,27,30] are summarized in Table 2. There were no significant differences in the proportion of women, length of follow-up or BMI across race groups. European–Americans were older, more physically active, and more likely to be light drinkers (1–7 drinks/week); to have medical insurance, higher education and higher income. Stroke and venous thromboembolism were more common indications for therapy among African–Americans, while atrial fibrillation and valvular heart disease were more common in European–Americans. More European–Americans had undergone coronary artery bypass grafting or percutaneous coronary angioplasty, had hyperlipidemia and malignancies while the prevalence of end stage renal disease and renal insufficiency was higher among African–Americans. The use of nonsteroidal analgesics, CYP2C9 inhibitors or substrates did not differ across racial groups [26,27,30,40]
Table 2.
Sociodemographic and lifestyle characteristics of the POAT study participants at baseline*.
| Characteristic | African–American (n = 273) | European–American (n = 302) | p-value |
|---|---|---|---|
| Age, mean (SD) | 58.0 (±16.0) | 63.9 (±14.7) | <0.0001 |
| Mean follow-up, months (± SD) | 14.7 (±14.7) | 15.1 (±10.8) | 0.66 |
| Body mass index, mean (SD) | 30.1 (±7.3) | 29.3 (±7.2) | 0.18 |
| Gender | |||
| Female, n (%) | 144 (52.7%) | 136 (45.0%) | 0.065 |
| Male, n (%) | 129 (47.3%) | 166 (55.0%) | |
| Alcohol (drinks per week)§ | |||
| 0, n (%) | 213 (78.0%) | 186 (61.6%) | <0.0001 |
| 1–7, n (%) | 37 (13.6%) | 100 (33.1%) | |
| >8, n (%) | 21 (7.7%) | 16 (5.3%) | |
| Smoking status§ | |||
| Current, n (%) | 51 (18.7%) | 27 (8.9%) | 0.007 |
| Past, n (%) | 90 (33.0%) | 119 (39.4%) | |
| Never, n (%) | 123 (45.0%) | 147 (48.7%) | |
| Site of thromboembolism‡ | |||
| Arterial, n (%) | 109 (39.9%) | 131 (43.4%) | 0.4 |
| Venous, n (%) | 138 (50.5%) | 90 (29.8%) | <0.0001 |
| Both, n (%) | 30 (11.0%) | 21 (6.9%) | 0.09 |
| None, n (%) | 34 (12.4%) | 44 (14.6%) | 0.46 |
| Number of comorbid conditions | |||
| Low (0 or 1), n (%) | 88 (32.2%) | 74 (24.5%) | 0.03 |
| Medium (2 to 4), n (%) | 129 (47.2%) | 141 (46.7%) | |
| High (5 or more), n (%) | 56 (20.5%) | 87 (28.8%) | |
| Concurrent medications | |||
| Antiplatelet agents, n (%) | 133 (49.3%) | 189 (65.6%) | 0.001 |
| NSAIDS, n (%) | 37 (13.7%) | 39 (12.9%) | 0.78 |
| CYP2C9 substrates, n (%) | 91 (33.7%) | 96 (31.8%) | 0.62 |
| CYP2C9 inhibitors, n (%) | 50 (18.3%) | 74 (24.4%) | 0.072 |
| CYP2C9¶ | |||
| CYP2C9 variant genotype, (%) | 11.6% | 33.1% | <0.0001 |
Three Hispanic patients excluded, all significant p-values bolded
All patients had a prescribed target INR range of 2–3. Patients with orthopedic surgery excluded due to short (3–6 month) treatment duration, patients with mechanical heart valve and hypercoagulable state excluded due to higher intensity of anticoagulation required.
Arterial thromboembolism includes patients with MI, stroke and TIA. Venous thromboembolism includes patients with DVT and PE. Both include patients with venous and arterial events. None includes patients with no thromboembolic events (e.g., atrial fibrillation).
Mean (SD) displayed for continuous variables and frequency counts (column percent) for categorical variables.
Missing information on smoking (n = 18) and alcohol (n = 2).
CYP2C9 (variant includes *2, *3, *5, *6 and *11 alleles for African–Americans; *2 and *3 for European–Americans) genotype. CYP2C9 genotype not available in 15 patients.
Patients can have more than one indication for therapy and comorbid conditions. CYP2C9 inhibitors included amiodarone, metronidazole, tamoxifen, propxyphene, co-trimoxazole and so on.
DVT: Deep vein thrombosis; INR: International normalized ratio; MI: Myocardial infarction; NSAID: Nonsteriodal anti-inflammatory drug;
PE: Pulmonary embolism; POAT: Pharmacogenetic optimization of anticoagulation therapy; SD: Standard deviation; TIA: Transient ischemic attack.
VKORC1 polymorphisms
Although we planned to assess all polymorphic VKORC1 SNPs with reported MAF greater than or equal to 2%, four SNPs (rs13337470, rs17881535, rs17878521, rs17880887) could not be assessed due to assay limitations/failure. The influence of these SNPs was captured through assessment of other SNPs in strong linkage disequilibrium (LD) (rs17878521 = rs17878338 – r2 = 0.8; rs17881535 and rs17880887 = rs17708472 – r2 = 0.7; rs13337470 = rs13336384 – r2 = 0.6). Two additional African–American specific SNPs (rs17883590, rs17884766) were not assessed. An additional four SNPs (rs17882023, rs17878259, rs17884388, rs17884982) with reported MAF greater than or equal to 2% were found to be monomorphic in both race groups in our population. One SNP (rs17883590) with a reported MAF of 9% was found to have a lower prevalence (MAF 1.8%) in our cohort. HWE assumptions were met for all SNPs assessed in both race groups (all p-values >0.5). The distribution of SNPs (MAF ≥2%) varied significantly by race group (Table 3). The influence of eight common VKORC1 SNPs (MAF ≥5%) among European–Americans and eleven SNPs among African–Americans on warfarin dose was statistically evaluated.
Table 3.
Minor allele frequencies of VKORC1 variants by race among European–Americans and African–American participants of the POAT cohort.
| SNP-ID | Standard coordinate* |
PGA |
POAT |
p-value | ||||
|---|---|---|---|---|---|---|---|---|
| EA | AA |
EA (n = 302) |
AA (n = 273) |
|||||
| MAF | MAF | MAF | n | MAF | n | |||
| rs17882368 | 5729T/C | M | 2% | M | 279 | 5.2% | 261 | <0.0001 |
| rs17883591 | 5408C/G | M | 9% | M | 271 | 3.5% | 255 | 0.0002 |
| rs17878338 | 5133A/G | M | 11% | M | 276 | 3.5% | 254 | <0.0001 |
| rs7294 | 3730G/A | 33% | 44% | 38.2% | 275 | 46.4% | 261 | 0.023 |
| rs7200749 | 3462T/C | M | 21% | M | 278 | 21.1% | 259 | <0.0001 |
| rs17882023 | 2715G/A | M | 5% | M | 279 | M | 262 | |
| rs2359612 | 2255C/T | 45% | 25% | 36.7% | 278 | 20.3% | 259 | <0.0001 |
| rs17886199 | 1604C/T | M | 8% | M | 280 | 3.7% | 258 | <0.0001 |
| rs8050894 | 1542G/C | 46% | 19% | 36.7% | 278 | 27.8% | 259 | 0.0113 |
| rs9934438 | 1173C/T | 48% | 14% | 36.5% | 278 | 10.6% | 259 | <0.0001 |
| rs13336384 | 880T/C | M | 7% | M | 278 | 5.7% | 259 | <0.0001 |
| rs17708472 | 698C/T | 21% | 7% | 22.9% | 247 | 5% | 240 | <0.0001 |
| rs2884737 | 497T/G | 30% | 6% | 25% | 278 | 3.5% | 260 | <0.0001 |
| rs17878259 | −593C/T | M | 5% | M | 278 | M | 262 | |
| rs9923231 | −1639G/A | 43% | 13% | 36.1% | 277 | 10.9% | 256 | <0.0001 |
| rs17878544 | −1877G/A | M | 30% | M | 275 | 36.8% | 258 | <0.0001 |
| rs7196161 | −4931T/C | 46% | 48% | 36.4% | 276 | 48.6% | 248 | <0.0001 |
p-value designates significant differences in MAF between African–American and European–American participants in the POAT cohort.
Relative to the ATG start codon defined as +1 in Genbank Accession No. AY587020.
PGA data is presented as reference. The differences in MAF could potentially be indicative of differences in population substructure among the African–Americans across geographic regions within the USA. Also, since the POAT cohort has genotyped the highest number of African–Americans – it provides a more robust estimate of the MAF. The differences in the MAF between the two cohorts also provide a measure of variability in MAF that may be encountered among populations of the same ‘race’ within the USA.
AA: African–American; EA: European Americans; M: Monomorphic; MAF: Minor allele frequency; n: Number of POAT participants with genotype determined; PGA: Frequencies for VKORC1 SNPs from the Program for Genomics Application website are presented for the readers' reference [101]; POAT: Pharmacogenetic Optimization of Anticoagulation Therapy cohort; SNP: Single nucleotide polymorphism with MAF ≤2% reported.
Missing genotype information did not differ by race (all p-values >0.2) among POAT participants.
Influence of individual VKORC1 SNPs on warfarin maintenance dose
Univariate associations for each common VKORC1 SNP (MAF ≥5%) revealed that among European–Americans all eight SNPs (with MAF ≥5%) were significantly associated with dose (p < 0.0002). Among African–Americans only four (rs17882368, rs2359612, rs9934438, rs9923231) of the eleven SNPs were significantly associated with dose (p < 0.001). The striking variation of MAF and differences in predictive power of individual VKORC1 SNPs across racial groups supports the use of race-stratified multivariable analyses. For both race groups the variability in warfarin dose explained was higher when VKORC1 or CYP2C9 genotype was modeled on an additive scale compared with dominant scale (Table 4). The variability in dose explained by VKORC1 (all SNPs) and CYP2C9 was significantly higher among European–Americans compared with African–Americans after adjustment for clinical covariates. The VKORC1 1173C/T (rs9934438) explained the highest variability in warfarin dose among both African– and European–Americans in the multivariable model with CYP2C9 and clinical covariates.
Table 4.
Multivariable evaluation of the association of individual VKORC1 SNPs with log warfarin maintenance dose among POAT participants by race.
| SNP-ID* | Standard coordinates |
Additive model‡ |
Dominant model§ |
||||
|---|---|---|---|---|---|---|---|
| r2model (%) | r2vkor (%) | r22C9 (%) | r2model (%) | r2vkor (%) | r22C9 (%) | ||
| European–Americans | |||||||
| rs7294 | 3730G/A | 34.0 | 5.2 | 12.2 | 30.3 | 5.3 | 8.8 |
| rs2359612 | 2255C/T | 46.5 | 18.1 | 12.4 | 37.2 | 12.8 | 8.3 |
| rs8050894 | 1542G/C | 47.5 | 19.1 | 12.2 | 38.0 | 13.6 | 8.1 |
| rs9934438 | 1173C/T | 46.8 | 18.4 | 12.3 | 37.3 | 12.8 | 8.6 |
| rs17708472 | 698C/T | 33.1 | 5.2 | 11.3 | 28.8 | 4.4 | 7.0 |
| rs2884737 | 497T/G | 36.3 | 7.9 | 12.5 | 31.0 | 6.6 | 8.6 |
| rs9923231 | −1639G/A | 46.0 | 17.2 | 12.3 | 36.3 | 12.2 | 8.0 |
| rs7196161 | −4931T/C | 45.7 | 16.8 | 11.6 | 35.1 | 10.6 | 8.1 |
| African–Americans | |||||||
| rs17882368 | 5729T/C | 38.1 | 4.3 | 3.2 | 36.5 | 4.2 | 1.6 |
| rs7294 | 3730G/A | 35.0 | 1.3 | 2.2 | 33.4 | 1.1 | 1.0 |
| rs2359612 | 2255C/T | 39.0 | 5.4 | 2.4 | 37.3 | 5.0 | 0.9 |
| rs9934438 | 1173C/T | 38.6 | 4.9 | 3.2 | 36.9 | 4.7 | 1.5 |
| rs9923231 | −1639G/A | 38.9 | 4.3 | 3.2 | 37.2 | 3.9 | 1.5 |
SNPs explaining <1.0% variability in warfarin dose were not evaluated in multivariable analyses.
Standard coordinate is relative to the ATG start codon defined as +1 in Genbank Accession No. AY587020.
Multivariable model adjusted for significant (p < 0.2) clinical covariates (age, gender BMI, average vitamin K intake, presence of CHF, use of HMG-coenzyme A inhibitors, use of amiodarone) and CYP2C9 and the single VKORC1 SNP for European–Americans.
Multivariable model adjusted for significant (p < 0.2) clinical covariates (age, gender BMI, smoking, average vitamin K intake, average alcohol intake, presence of renal failure, presence of CHF, use of HMG-coenzyme A inhibitors, use of amiodarone) and CYP2C9 and the single VKORC1 SNP for African–Americans.
VKORC1 and CYP2C9 genotypes were included as covariates with three levels in the additive models.
VKORC1 and CYP2C9 genotypes were included as covariates with two levels (wild-type vs variant) in the dominant models.
Statistically nonsignificant at α = 0.05. All other associations were significant at α <0.05.
r2model: Percent variation in warfarin dose explained by the model containing clinical and genetic covariates; r2vkor: Semi-partial r2 denoting percent variation in warfarin dose explained by VKORC1 SNP; r22C9 :Semi-partial r2 denoting percent variation in warfarin dose explained by CYP2C9 (variant includes *2, *3, *5, *6 and *11 alleles for African–Americans; *2 and *3 for European–Americans) genotype.
CHF: Congestive heart failure; HMG: 3-hydroxy-3-methylglutaryl; POAT: Pharmacogenetic Optimization of Anticoagulation Therapy.
Among European–Americans regression analyses identified five highly correlated (r2 >0.9) VKORC1 SNPs (rs2359612, rs8050894, rs9934438, rs9923231, rs7196161) that explained 17–19% of the variability (10.6–13.6% for dominant model) in warfarin dose. The addition of CYP2C9 improved the explanatory power to 28–31% (18.7–21.7% for dominant model, Table 4.
Among African–Americans two sets of SNPs (rs9934438 and rs9923231; rs17883591 and rs17886199) analyzed in this study were in strong LD (r2 > 0.9) while the LD between the other SNPs was weaker (r2 ranging from 0.2 to 0.6). In multivariable regression analyses VKORC1 variants were significantly associated with warfarin dose, explaining 1–5% of the variability in dose. Addition of CYP2C9 genotype improved the explanatory power up to 8% (6.2% for dominant model, Table 4).
Influence of VKORC1 haplotypes & haplotype groups on maintenance dose
Among European–Americans, six haplotypes inferred from eight common SNPs accounted for 97.5% of all haplotypes. Four haplotypes with frequency of 5% or greater, assessed in multivariable analyses explained 16.3% of the variability in warfarin dose (p < 0.0001). Adjusted mean doses (and 95% CI) for each haplotype are presented in Table 5. Two haplotypes (WHT3 and WHT4) were found to be independently associated with low warfarin dose after adjustment for CYP2C9 and clinical covariates. Pairwise comparisons demonstrate the emergence of two distinct haplotype groups with WHT3 and WHT4 haplotypes associated with significantly lower warfarin dose compared with WHT1 and WHT2. Tukey–Kramer adjustments for multiple comparisons did not alter the significance of this association (p < 0.0001).
Table 5.
VKORC1 haplotype frequency and influence on warfarin dose among European–American and African–American participants.
| Identification code |
Haplotype sequence |
Haplotype frequency (%) |
p-value | Mean maintenance dose (mg/day) (95% CI)* |
|
|---|---|---|---|---|---|
| Number of copies of VKORC1 haplotype | |||||
| 2 copies¶ | 1 or 2 copies# | ||||
| European-Americans‡ | |||||
| WHT1 | TGTCCGCA | 37.1 | Referent | 6.0 (5.4, 6.6) | 5.5 (5.2, 5.8) |
| WHT2 | TGTTCGCG | 23.9 | 0.99 | 5.2 (4.1, 6.2) | 5.6 (5.3, 6.0) |
| WHT3* | CAGCTCTG | 23.3 | <0.0001 | 3.1 (2.1, 4.1) | 4.5 (4.1, 4.9) |
| WHT4* | CATCTCTG | 11.3 | <0.0001 | 3.2 (1.8, 4.7) | 4.0 (3.5, 4.6) |
| WHT5 | TAGCTCTG | 1.1 | NA | NA | NA |
| WHT6 | CGTTCGCG | 0.7 | NA | NA | NA |
| African–Americans§ | |||||
| BHT1 | TTGCGCGCCAC | 24.4 | Referent | 6.3 (5.4, 7.3) | 6.1 (5.8, 6.6) |
| BHT2 | CCGCGCCCCGC | 16.2 | 0.96 | 6.5 (4.6, 8.4) | 6.1 (5.7, 6.6) |
| BHT3 | TCGCGCGCTAC | 15.3 | 0.73 | 5.7 (4.4, 7.1) | 6.1 (5.6, 6.6) |
| BHT4 | CTGCGCGTCGC | 9.6 | 0.018 | 5.8 (3.6, 8.1) | 5.4 (4.8, 6.0) |
| BHT5 | CTGCACGCCGC | 6.8 | 0.28 | NA | 5.9 (5.2, 6.6) |
| BHT6* | CTACGTCTCGC | 5.6 | 0.0028 | NA | 4.8 (4.2, 5.7) |
| BHT7 | TTGTGCGCCGC | 5.1 | 0.63 | NA | 6.0 (5.3, 6.7) |
| BHT8 | TTGCGCGCCGC | 4.9 | NA | NA | NA |
| BHT9 | CCGCGCGCTAC | 4.2 | NA | NA | NA |
| BHT10 | CTACGTCTCGT | 3.9 | NA | NA | NA |
| BHT11 | TTACGTCTCGT | 1.1 | NA | NA | NA |
| BHT12 | CTGCGCGCCAC | 1.1 | NA | NA | NA |
Five European–Americans and eight African–Americans individuals with more than 50% missing genotypes were excluded from the analysis.
For European–Americans each haplotype sequence SNPs are listed in the sequential order along the VKORC1 gene (rs7196161, rs9923231, rs2884737, rs17708472, rs9934438, rs8050894, rs2359612, rs7294). For African–Americans each haplotype sequence SNPs are listed in the sequential order along the VKORC1 gene (rs7196161, rs17878544, rs9923231, rs17708472, rs13336384, rs9934438, rs8050894, rs2359612, rs7200749, rs7294, rs17882368). Haplotypes with frequencies <0.5% are not presented.
The low prevalence did not allow multivariable evaluation.
Haplotypes independently predictive of warfarin dose are bolded.
Haplotypes independently predictive of warfarin dose after Tukey–Kramer adjustment for multiple comparisons.
For European–Americans multivariable model adjusted for significant (p < 0.2) clinical covariates (age, gender BMI, average vitamin K intake, use of amiodarone) and CYP2C9 (variant vs wild-type) and VKORC1 haplotype. CYP2C9 variant alleles assessed include *2 *3.
For African–Americans multivariable model adjusted for significant (p < 0.2) clinical covariates (age, gender BMI, average alcohol intake, presence of renal failure, presence of CHF, use of amiodarone) and CYP2C9 (variant vs wild-type) and VKORC1 haplotype. CYP2C9 variant alleles assessed include *2, *3, *5, *6 and *11.
Mean warfarin dose requirements among patients possessing two copies of VKORC1 haplotype.
Mean warfarin dose requirements among patients possessing one or two copies of VKORC1 haplotype.
Each haplotype is represented as a covariate.
Numbering of SNPs varies by race as we constructed race-specific haplotypes and haplotype groups.
CHF: Congestive heart failure; NA: Not analyzed as haplotype frequencies <5%.
Among European–Americans the genealogic tree showing the relationship among the four common haplotypes indicates the emergence of two divergent haplotype groups (Figure 1A) differentiated by a set of five SNPs (rs2359612, rs8050894, rs9934438, rs9923231 and rs7196161). Haplotypes WHT3 and WHT4 (Group A: low-dose haplotype group) were associated with lower warfarin dose compared with WHT1 and WHT2 (Group B: high-dose haplotype group) after adjustment for CYP2C9 and clinical covariates (Figure 1b). VKORC1 haplotype groups accounted for 16.2% variability in warfarin dose (p < 0.0001) in multivariable regression analyses.
Figure 1. Effect of VKORC1 haplotype groups on warfarin dose among EuropeanAmerican and AfricanAmerican patients.
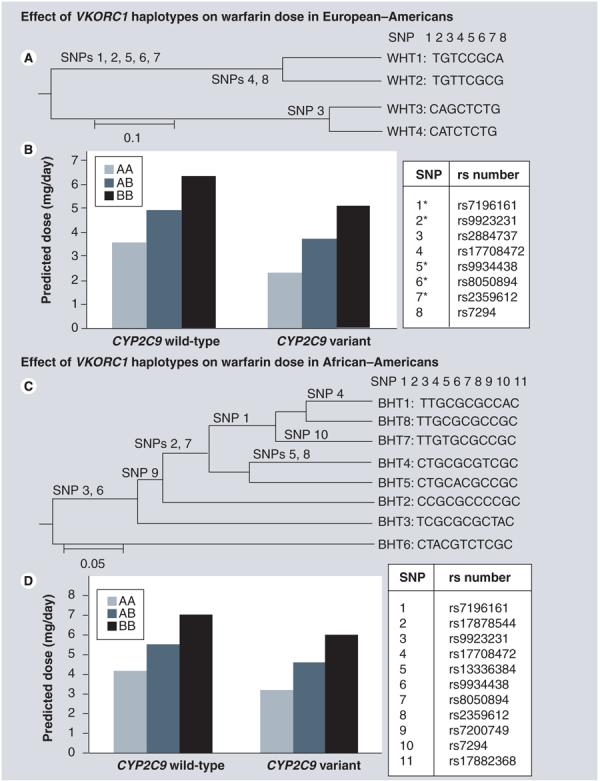
(A) Depicts the four common haplotypes clustered using UPGMA method, forming two distinct phenotypic groups; Group A (comprising of WHT3 and WHT4) and Group B (comprising of WHT1 and WHT2). *Highly correlated SNPs (r2 > 0.9) significantly associated with warfarin dose. (B) European–American patients assigned haplotype combination AA and AB require lower doses that those assigned BB independent of CYP2C9 genotype and clinical covariates. (C) Depicts the eight common haplotypes clustered using UPGMA method, forming two distinct phenotypic groups; Group A (comprising of BHT6) and Group B (comprising of BHT1, BHT2, BHT3, BHT4, BHT5, BHT7 and BHT8). (D) African–American patients assigned haplotype combination AA and AB require lower doses that those assigned BB independent of CYP2C9 genotype and clinical covariates. Numbering of SNPs varies by race as we constructed race-specific haplotypes and haplotype groups.
BHT: Haplotype for African–Americans; UPGMA: Unweighted pair-group method with arithmetic mean; WHT: Haplotype for European Americans.
Among African–Americans, twelve haplotypes inferred from 11 common SNPs accounted for 98.4% of all haplotypes. Eight haplotypes with frequency of 5% or greater, assessed in multivariable analyses explained 4.7% of the variability in warfarin dose (p < 0.05). Adjusted mean doses (and 95% CI) for each haplotype are presented in Table 5. Two haplotypes (BHT4, BHT6) were found to be independently associated with lower warfarin dose after adjustment for CYP2C9 genotype and clinical covariates (Table 5). However, after Tukey–Kramer adjustments only BHT6 was significantly associated with warfarin dose (p < 0.05).
Among African–Americans the genealogic tree showing the relationship among the eight common haplotypes is presented in Figure 1C. Haplotypes BHT4 and BHT6 were associated with lower warfarin dose, with haplotype BHT6 demonstrating the strongest influence. We designated the BHT6 group as low-dose haplotype group (Group A) and the others as high-dose haplotype group (Group B). As shown in Figure 1C, a set comprised of two SNPs (rs9934438 and rs9923231) distinguished the two haplotype groups. Multivariable analyses adjusting for clinical covariates and CYP2C9 indicated significantly lower dose requirements by the presence of the low-dose Group A haplotype (Figure 1D) accounting for 7.0% of the variability in warfarin dose (p < 0.0001).
Comparison of predictive power of single VKORC1 polymorphisms haplotypes & haplotype groups on warfarin dose
Percent variability in warfarin dose explained by VKORC1 haplotypes and haplotype groups was similar to that explained by a multivariable model with a single informative VKORC1 SNP (Table 6) for both African–Americans and European–Americans. Based on these results the most parsimonious model includes a single informative VKORC1 SNP model (rs9934438 or rs9923231) along with CYP2C9 and a limited set of clinical variables.
Table 6.
Multivariable evaluation of the association of VKORC1 and warfarin maintenance dose.
|
VKORC1 covariate in multivariable model |
Additive model* |
Dominant model‡ |
||||
|---|---|---|---|---|---|---|
| r2model (%) | r2vkor (%) | r22C9 (%) | r2model (%) | r2vkor (%) | r22C9 (%) | |
| European–Americans | ||||||
| rs9934438 (1173C/T) | 46.8 | 18.4 | 12.3 | 37.3 | 12.8 | 8.6 |
| VKORC1 haplotype | 35.5 | 16.3 | 6.3 | 34.0 | 12.6 | 5.3 |
| VKORC1 haplotype group | 35.6 | 16.2 | 6.4 | 31.2 | 11.8 | 5.6 |
| African–Americans | ||||||
| rs9934438 (1173C/T) | 38.6 | 4.9 | 3.2 | 36.9 | 4.7 | 1.5 |
| VKORC1 haplotype | 34.6 | 4.7 | 0.7 | 34.6 | 4.5 | 0.7 |
| VKORC1 haplotype group | 37.1 | 7.0 | 1.7 | 37.1 | 7.0 | 1.8 |
VKORC1 covariate was included as covariate with three levels in the additive models.
VKORC1 covariate was included as covariate with two levels (wild-type vs variant) in the dominant models.
r2model: Percent variation in warfarin dose explained by the model containing clinical and genetic covariates; r2vkor: Semi-partial r2 denoting percent variation in warfarin dose explained by VKORC1 SNP; r22C9: Semi-partial r2 denoting percent variation in warfarin dose explained by CYP2C9 (variant vs wild-type; variant includes *2, *3, *5, *6 and *11 alleles for African–Americans; *2, *3 for European–Americans) genotype.
We utilize this model to demonstrate the dose reductions associated with genetic and clinical covariates in Table 7. The presence of CYP2C9 and VKORC1 1173C/T variants is associated with warfarin dose reduction among both African–Americans and European–Americans.
Table 7.
Influence of genetic and nongenetic covariates on warfarin dose among European–Americans and African–Americans.
| Fold change |
||||
|---|---|---|---|---|
| Characteristic | Additive model |
Dominant model |
||
| European–American | African–American | European–American | African–American | |
| Age* | 0.99 | 0.99 | 0.99 | 0.99 |
| Female | 0.87 | 0.81 | 0.88 | 0.81 |
| BMI‡ | 1.01 | 1.01 | 1.01 | 1.01 |
| Current drinker | – | 1.01 | – | 1.01 |
| Intake of vitamin K-rich foods§ | 1.04 | 1.03 | 1.05 | 1.03 |
| Congestive heart failure | 0.93 | 0.94 | 0.92 | 0.94 |
| Renal failure | – | 0.85 | – | 0.84 |
| HMG coenzyme A inhibitor | 1.10 | 0.94 | 1.10 | 0.94 |
| Amiodarone | 0.81 | 0.78 | 0.82 | 0.79 |
| CYP2C9 genotype¶ | 0.75 | 0.83 | 0.75 | 0.84 |
| VKORC1 1173C/T genotype | 0.74 | 0.80 | 0.71 | 0.79 |
| Average dose (mg/day) | 6.3 | 6.7 | 6.0 | 6.7 |
Log transformation of dose was performed for analyses. Above we present the re-transformed (back-transformed) dose. The fold changes are to be applied to the back-transformed dose. Multivariable model adjusted for significant (p < 0.2) clinical covariates (age, gender BMI, average vitamin K intake, presence of CHF, use of HMG-coenzyme A inhibitors, use of amiodarone) and CYP2C9 and the single VKORC 1173C/T for European–Americans. Multivariable model adjusted for significant (p < 0.2) clinical covariates (age, gender BMI, smoking, average vitamin K intake, average alcohol intake, presence of renal failure, presence of CHF, use of HMG-coenzyme A inhibitors, use of amiodarone) and CYP2C9 and the single VKORC1 1173C/T for African–Americans
VKORC1 and CYP2C9 genotypes were included as covariates with three levels in the additive models. Fold change is per copy of variant allele.
VKORC1 and CYP2C9 genotypes were included as covariates with two levels (wild-type versus variant) in the dominant models.
Per year increase over 61 years.
Per unit increase over BMI of 30.
Per serving of vitamin K-rich foods.
CYP2C9 variant genotype includes *2, *3 alleles among European–Americans and *2, *3, *5, *6 and *11 alleles among African–Americans. The referent patient is a 61-year-old man with BMI of 30, who is wild-type for CYP2C9 and VKORC1, a current nonsmoker and nondrinker, with no comorbidities (e.g., CHF, cancer) and no inhibitors of CYP2C9 (e.g., amiodarone), HMG coenzyme A inhibitors (patients were not on fluvastatin).
CHF: Congestive heart failure; HMG: 3-hydroxy-3-methylglutaryl.
Discussion
In this prospective study, we comprehensively assessed the influence of all common CYP2C9 and VKORC1 polymorphisms and VKORC1 haplotypes on warfarin dose in both European and African–Americans. Although CYP2C9 and VKORC1 variants influence on warfarin dose among both African– and European–Americans, their contribution to explaining variability in dose is higher among European–Americans. In both race groups, VKORC1 explained a higher percent variability in warfarin dose compared with CYP2C9. Although the set of VKORC1 polymorphisms associated with warfarin dose was different between populations, two polymorphisms (rs9934438, rs9923231) were conjointly informative.
Influence of VKORC1 SNPs & CYP2C9 on warfarin dose
Among European–Americans, the variability in warfarin dose explained by CYP2C9 and VKORC1 (30%) was consistent with prior reports [3,5,6,8,14,19,22,23,41,42]. In racially diverse cohorts, the variability in warfarin dose explained by CYP2C9, a single VKORC1 SNP and a limited set of clinical covariates is reported to be lower [24-26,29] compared with studies involving racially homogenous cohorts [3,5,6,8,14,19,22,23,41,42]. Differences in racial diversity, study design (prospective versus retrospective) and clinical covariates perhaps contribute to the discrepant results [1]. We provide yet another reason. In racially diverse cohorts, the limited number of African–Americans and the rarity of patients homozygous for the variant CYP2C9 and VKORC1 alleles necessitated re-categorization of all genotypes as wild-type versus variant (geno-type effects evaluated on a dominant scale) [24-26,29]. While this strategy improves analytic efficiency, combining variant genotype categories may mask or diminish the strength of gene–dose associations. By evaluating both additive and dominant effects of VKORC1 and CYP2C9 we demonstrate the variability in warfarin dose explained is higher when VKORC1 and CYP2C9 genotype covariates were modeled on an additive scale compared with dominant scale. This finding was consistent among both European–Americans and African–Americans. Among African–Americans, the variability in warfarin dose explained by CYP2C9 and VKORC1 (dominant model) was consistent with prior reports [24,27,29]. Assessing gene effects on an additive scale revealed statistically significant effects of CYP2C9 on warfarin dose among African–Americans.
As previously reported, five highly correlated VKORC1 SNPs (rs2359612, rs8050894, rs9934438, rs9923231 and rs7196161) were best predictors of warfarin dose among European–Americans [13]. A similar set of correlated of SNPs are predictive of warfarin dose in the Chinese population [18,43]. We found two polymorphisms (rs9934438 or rs9923231) were best predictors among African–Americans. The informativeness of these two VKORC1 polymorphisms across populations enables the derivation of a common and limited set of polymorphisms that can improve warfarin dose prediction in a racially diverse population.
Influence of VKORC1 haplotypes (haplotype groups) & CYP2C9 on warfarin dose
Among European–Americans the distribution of VKORC1 haplotypes is concordant with that reported by Rieder et al. [13]. The prevalence of VKORC1 low-dose haplotype group (Group A, 34.9%) among European–Americans in our cohort was consistent with that reported by Rieder et al. (37%) [13].
To our knowledge this is the first effort to estimate VKORC1 haplotypes among African–American patients on chronic warfarin therapy. Consistent with the higher genomic sequence diversity in populations of African descent [31,33,44] African–Americans in our cohort demonstrated a more diverse distribution of haplotypes compared with European–Americans. However, the limited number of African–Americans homozygous for the low-dose haplotypes did not facilitate assessment of the degree of reduction in dose requirements among these participants. The significantly lower frequency of the low-dose haplotype group (5.6%, p < 0.0001), the limited number of patients homozygous for the low-dose haplotype groups together with a lower frequency of CYP2C9 variants may account for the higher dose requirements in African–Americans at a population level. Our results replicate the findings of Rieder et al. for European–Americans [13]. However, validation of our results in an independent cohort of African–Americans is required to verify our results and provide further insight into the influence of variation in the VKORC1 gene in warfarin response in this under-represented racial group.
Of note; the VKORC1 SNP, rs2359612 is present in all low-dose haplotypes for European–Americans (WHT3, WHT4) and (BHT4 and BHT6) for African–Americans. However after correction for multiple comparisons BHT4 was no longer significantly associated with dose. Given the uncertainty in haplotype estimation, we are more confident in using LD (r2) to identify informative SNP(s). Among European–Americans the three SNPs (rs2359612, rs9934438 and rs9923231) are in strong LD (r2 > 0.9). Among African–Americans r2 for rs9934438 and rs9923231 is 0.94, for rs9934438 and rs2359612 is 0.47 and for rs9923231 and rs2359612 is 0.42, supporting our conclusion that two SNPs (rs9934438 and rs9923231) are common across African–Americans and European–Americans.
Implications of findings for the implementation of genotype-based therapy
Although both VKORC1 and CYP2C9 influence on warfarin dose among individual patients of African and European descent, their contribution to explaining variability in dose is higher in the latter race group at the population level. This differential influence raises the concern of confounding due to population stratification. Although participants were recruited from a relatively defined geographic region, which is the third least migratory region of the USA [45], we may still need to account for admixture. However, the evaluation of only two genes did not allow us to conduct admixture studies. The differential influence also suggests that perhaps other genetic, environmental and clinical factors may play a differential role in African–Americans. Other genes such as γ-glutamyl carboxylase, calumenin, ApoE [25] and CYP4F2 [46] may influence warfarin dose in this race group. However, the extent to which variability in other genes in the warfarin pathways influences warfarin response and explains ethnic/ racial differences in response is yet to be resolved.
Conclusion
Recently, the US FDA updated the warfarin package insert encouraging, but not requiring the use of pharmacogenetic information in dosing patients initiating warfarin therapy [103]. As upcoming research efforts are initiated (such as the Randomized Trial of Genotype-Guided Dosing of Warfarin Therapy by the National Institutes of Health) and pre-pre-scription genotyping is implemented, it will be critical to select a common and limited set of polymorphisms that can improve prediction of warfarin dose requirements for a racially diverse population.
Our findings support the use of a single VKORC1 SNP (rs9934438 or rs9923231) along with CYP2C9 and a limited set of clinical covariates to predict warfarin dose in both African–Americans and European–Americans.
Future perspective
Warfarin pharmacogenomics has become an important case study for genomic technologies. It holds great promise to improve management of this challenging therapy with the potential to improve outcomes. However, the excitement surrounding this potential has been tempered by our limited understanding of other genetic and environmental influences and the interaction between them. Ongoing and future efforts must focus on identifying such factors to improve dose prediction, anticoagulation control and, finally, outcomes for patients of all racial/ethnic groups.
Executive summary.
The limited representation of African–Americans has hindered our understanding of genetic influences on warfarin response in this racial group.
To determine if VKORC1 haplotypes or haplotype groups explain a higher variability in warfarin dose, we comprehensively assessed VKORC1 polymorphisms in 273 African–Americans and 302 European–Americans and evaluated their influence on warfarin dose (after adjustment for CYP2C9 *2, *3, *5, *6 and *11 and clinical covariates).
The variability in dose explained by VKORC1 haplotype or haplotype groups was similar to that of a single informative VKROC1 polymorphism in both race-groups.
Our findings support the use of a single VKORC1 SNP (rs9934438 or rs9923231) along with CYP2C9 and a limited set of clinical covariates to predict warfarin dose in both African–Americans and European–Americans.
Although CYP2C9 and VKORC1 variants influence warfarin dose in both African– and European–Americans, the lower variability explained in African–Americans highlights the need for further research to identify other genetic and environmental determinants that influence warfarin response in this under-represented race group.
Financial & competing interests disclosure
Supported in part by a grant from the National Institute of Neurological Disorders and Stroke (Grant Number: K23NS45598–01) and in part by the Intramural Research Program of the NIH, National Institute of Environmental Health Sciences. The authors have no other relevant affiliations or financial involvement with any organization or entity with a financial interest in or financial conflict with the subject matter or materials discussed in the manuscript apart from those disclosed.
No writing assistance was utilized in the production of this manuscript
Footnotes
Ethical conduct of research
The authors state that they have obtained appropriate institutional review board approval or have followed the principles outlined in the Declaration of Helsinki for all human or animal experimental investigations. In addition, for investigations involving human subjects, informed consent has been obtained from the participants involved.
Bibliography
Papers of special note have been highlighted as either of interest (•) or of considerable interest (••) to readers.
- 1•.Wadelius M, Pirmohamed M. Pharmacogenetics of warfarin: current status and future challenges. Pharmacogenomics J. 2007;7:99–111. doi: 10.1038/sj.tpj.6500417. Reviews all potential candidate genes in the warfarin pharmacodynamic and pharmacokinetic pathway. [DOI] [PubMed] [Google Scholar]
- 2.Anderson JL, Horne BD, Stevens SM, et al. Randomized trial of genotype-guided versus standard warfarin dosing in patients initiating oral anticoagulation. Circulation. 2007;116:2563–2570. doi: 10.1161/CIRCULATIONAHA.107.737312. [DOI] [PubMed] [Google Scholar]
- 3.Aquilante CL, Langaee TY, Lopez LM, et al. Influence of coagulation factor, vitamin K epoxide reductase complex subunit 1, and cytochrome P450 2C9 gene polymorphisms on warfarin dose requirements. Clin. Pharmacol. Ther. 2006;79:291–302. doi: 10.1016/j.clpt.2005.11.011. [DOI] [PubMed] [Google Scholar]
- 4.Borgiani P, Ciccacci C, Forte V, Romano S, Federici G, Novelli G. Allelic variants in the CYP2C9 and VKORC1 loci and interindividual variability in the anticoagulant dose effect of warfarin in Italians. Pharmacogenomics. 2007;8:1545–1550. doi: 10.2217/14622416.8.11.1545. [DOI] [PubMed] [Google Scholar]
- 5.Caldwell MD, Berg RL, Zhang KQ, et al. Evaluation of genetic factors for warfarin dose prediction. Clin. Med. Res. 2007;5:8–16. doi: 10.3121/cmr.2007.724. [DOI] [PMC free article] [PubMed] [Google Scholar]
- 6.Carlquist JF, Horne BD, Muhlestein JB, et al. Genotypes of the cytochrome p450 isoform, CYP2C9, and the vitamin K epoxide reductase complex subunit 1 conjointly determine stable warfarin dose: a prospective study. J. Thromb. Thrombolysis. 2006;22:191–197. doi: 10.1007/s11239-006-9030-7. [DOI] [PubMed] [Google Scholar]
- 7.Cho HJ, Sohn KH, Park HM, et al. Factors affecting the interindividual variability of warfarin dose requirement in adult Korean patients. Pharmacogenomics. 2007;8:329–337. doi: 10.2217/14622416.8.4.329. [DOI] [PubMed] [Google Scholar]
- 8.D'Andrea G, D'Ambrosio RL, Di Perna P, et al. A polymorphism in the VKORC1 gene is associated with an interindividual variability in the dose-anticoagulant effect of warfarin. Blood. 2005;105:645–649. doi: 10.1182/blood-2004-06-2111. [DOI] [PubMed] [Google Scholar]
- 9.Gage BF, Eby C, Johnson JA, et al. Use of pharmacogenetic and clinical factors to predict the therapeutic dose of warfarin. Clin. Pharmacol. Ther. 2008;84(3):326–331. doi: 10.1038/clpt.2008.10. [DOI] [PMC free article] [PubMed] [Google Scholar]
- 10.Herman D, Locatelli I, Grabnar I, et al. Influence of CYP2C9 polymorphisms, demographic factors and concomitant drug therapy on warfarin metabolism and maintenance dose. Pharmacogenomics J. 2005;5:193–202. doi: 10.1038/sj.tpj.6500308. [DOI] [PubMed] [Google Scholar]
- 11.Kimura R, Miyashita K, Kokubo Y, et al. Genotypes of vitamin K epoxide reductase, γ-glutamyl carboxylase, and cytochrome P450 2C9 as determinants of daily warfarin dose in Japanese patients. Thromb. Res. 2007;120:181–186. doi: 10.1016/j.thromres.2006.09.007. [DOI] [PubMed] [Google Scholar]
- 12.Miao L, Yang J, Huang C, Shen Z. Contribution of age, body weight, and CYP2C9 and VKORC1 genotype to the anticoagulant response to warfarin: proposal for a new dosing regimen in Chinese patients. Eur. J. Clin. Pharmacol. 2007;63:1135–1141. doi: 10.1007/s00228-007-0381-6. [DOI] [PubMed] [Google Scholar]
- 13•.Rieder MJ, Reiner AP, Gage BF, et al. Effect of VKORC1 haplotypes on transcriptional regulation and warfarin dose. N. Engl. J. Med. 2005;352:2285–2293. doi: 10.1056/NEJMoa044503. [DOI] [PubMed] [Google Scholar]
- 14.Sconce EA, Khan TI, Wynne HA, et al. The impact of CYP2C9 and VKORC1 genetic polymorphism and patient characteristics upon warfarin dose requirements: proposal for a new dosing regimen. Blood. 2005;106:2329–2333. doi: 10.1182/blood-2005-03-1108. [DOI] [PubMed] [Google Scholar]
- 15.Takahashi H, Wilkinson GR, Nutescu EA, et al. Different contributions of polymorphisms in VKORC1 and CYP2C9 to intra- and inter-population differences in maintenance dose of warfarin in Japanese, Caucasians and African–Americans. Pharmacogenet. Genomics. 2006;16:101–110. doi: 10.1097/01.fpc.0000184955.08453.a8. [DOI] [PubMed] [Google Scholar]
- 16.Tham LS, Goh BC, Nafziger A, et al. A warfarin-dosing model in Asians that uses single-nucleotide polymorphisms in vitamin K epoxide reductase complex and cytochrome P450 2C9. Clin. Pharmacol. Ther. 2006;80:346–355. doi: 10.1016/j.clpt.2006.06.009. [DOI] [PubMed] [Google Scholar]
- 17.Vecsler M, Loebstein R, Almog S, et al. Combined genetic profiles of components and regulators of the vitamin K-dependent γ-carboxylation system affect individual sensitivity to warfarin. Thromb. Haemost. 2006;95:205–211. doi: 10.1160/TH05-06-0446. [DOI] [PubMed] [Google Scholar]
- 18.Veenstra DL, You JH, Rieder MJ, et al. Association of vitamin K epoxide reductase complex 1 (VKORC1) variants with warfarin dose in a Hong Kong Chinese patient population. Pharmacogenet. Genomics. 2005;15:687–691. doi: 10.1097/01.fpc.0000174789.77614.68. [DOI] [PubMed] [Google Scholar]
- 19.Wadelius M, Chen LY, Downes K, et al. Common VKORC1 and GGCX polymorphisms associated with warfarin dose. Pharmacogenomics J. 2005;5:262–270. doi: 10.1038/sj.tpj.6500313. [DOI] [PubMed] [Google Scholar]
- 20.Wu AH. Use of genetic and nongenetic factors in warfarin dosing algorithms. Pharmacogenomics. 2007;8:851–861. doi: 10.2217/14622416.8.7.851. [DOI] [PubMed] [Google Scholar]
- 21.Zhu Y, Shennan M, Reynolds KK, et al. Estimation of warfarin maintenance dose based on VKORC1 (−1639 G>A) and CYP2C9 genotypes. Clin. Chem. 2007;53(7):1199–1205. doi: 10.1373/clinchem.2006.078139. [DOI] [PubMed] [Google Scholar]
- 22.Schalekamp T, Brasse BP, Roijers JF, et al. VKORC1 and CYP2C9 genotypes and acenocoumarol anticoagulation status: interaction between both genotypes affects overanticoagulation. Clin. Pharmacol. Ther. 2006;80:13–22. doi: 10.1016/j.clpt.2006.04.006. [DOI] [PubMed] [Google Scholar]
- 23.Schalekamp T, Brasse BP, Roijers JF, et al. VKORC1 and CYP2C9 genotypes and phenprocoumon anticoagulation status: interaction between both genotypes affects dose requirement. Clin. Pharmacol. Ther. 2007;81:185–193. doi: 10.1038/sj.clpt.6100036. [DOI] [PubMed] [Google Scholar]
- 24.Kealey C, Chen Z, Christie J, et al. Warfarin and cytochrome P450 2C9 genotype: possible ethnic variation in warfarin sensitivity. Pharmacogenomics. 2007;8:217–225. doi: 10.2217/14622416.8.3.217. [DOI] [PubMed] [Google Scholar]
- 25.Kimmel SE, Christie J, Kealey C, et al. Apolipoprotein E genotype and warfarin dosing among Caucasians and African Americans. Pharmacogenomics J. 2008;8:53–60. doi: 10.1038/sj.tpj.6500445. [DOI] [PubMed] [Google Scholar]
- 26•.Limdi N, McGwin G, Goldstein J, et al. Influence of CYP2C9 and VKORC1 1173C/T genotype on the risk of hemorrhagic complications in African–American and European–American patients on warfarin. Mol. Ther. 2008;83:312–321. doi: 10.1038/sj.clpt.6100290. Demonstrates influence of CYP2C9 on risk of hemorrhagic complications among African–Americans and European–Americans. [DOI] [PMC free article] [PubMed] [Google Scholar]
- 27.Limdi NA, Goldstein JA, Blaisdell JA, Beasley TM, Rivers CA, Acton RT. Influence of CYP2C9 genotype on warfarin dose among African American and European Americans. Pers. Med. 2007;4:157–169. doi: 10.2217/17410541.4.2.157. [DOI] [PMC free article] [PubMed] [Google Scholar]
- 28.Momary KM, Shapiro NL, Viana MA, Nutescu EA, Helgason CM, Cavallari LH. Factors influencing warfarin dose requirements in African–Americans. Pharmacogenomics. 2007;8:1535–1544. doi: 10.2217/14622416.8.11.1535. [DOI] [PubMed] [Google Scholar]
- 29.Schelleman H, Chen Z, Kealey C, et al. Warfarin response and vitamin K epoxide reductase complex 1 in African–Americans and Caucasians. Clin. Pharmacol. Ther. 2007;81(5):742–747. doi: 10.1038/sj.clpt.6100144. [DOI] [PubMed] [Google Scholar]
- 30.Limdi NA, Arnett DK, Goldstein JA, et al. Influence of CYP2C9 and VKORC1 polymorphisms on warfarin dose, anticoagulation attainment and maintenance among European–American and African–Americans. Pharmacogenomics. 2008;9:511–526. doi: 10.2217/14622416.9.5.511. [DOI] [PMC free article] [PubMed] [Google Scholar]
- 31.Przeworski M, Hudson RR, Di Rienzo A. Adjusting the focus on human variation. Trends Genet. 2000;16:296–302. doi: 10.1016/s0168-9525(00)02030-8. [DOI] [PubMed] [Google Scholar]
- 32.Kuffner T, Whitworth W, Jairam M, McNicholl J. HLA class II and TNF genes in African Americans from the Southeastern United States: regional differences in allele frequencies. Hum. Immunol. 2003;64:639–647. doi: 10.1016/s0198-8859(03)00056-9. [DOI] [PubMed] [Google Scholar]
- 33.Crawford DC, Carlson CS, Rieder MJ, et al. Haplotype diversity across 100 candidate genes for inflammation, lipid metabolism, and blood pressure regulation in two populations. Am. J. Hum. Genet. 2004;74:610–622. doi: 10.1086/382227. [DOI] [PMC free article] [PubMed] [Google Scholar]
- 34.Dang MT, Hambleton J, Kayser SR. The influence of ethnicity on warfarin dosage requirement. Ann. Pharmacother. 2005;39:1008–1012. doi: 10.1345/aph.1E566. [DOI] [PubMed] [Google Scholar]
- 35.Guo SW, Thompson EA. Performing the exact test of Hardy–Weinberg proportion for multiple alleles. Biometrics. 1992;48:361–372. [PubMed] [Google Scholar]
- 36.Schaid DJ. Evaluating associations of haplotypes with traits. Genet. Epidemiol. 2004;27:348–364. doi: 10.1002/gepi.20037. [DOI] [PubMed] [Google Scholar]
- 37.Tanck MW, Klerkx AH, Jukema JW, De Knijff P, Kastelein JJ, Zwinderman AH. Estimation of multilocus haplotype effects using weighted penalised log-likelihood: analysis of five sequence variations at the cholesteryl ester transfer protein gene locus. Ann. Hum. Genet. 2003;67:175–184. doi: 10.1046/j.1469-1809.2003.00021.x. [DOI] [PubMed] [Google Scholar]
- 38.Schaid DJ, Rowland CM, Tines DE, Jacobson RM, Poland GA. Score tests for association between traits and haplotypes when linkage phase is ambiguous. Am. J. Hum. Genet. 2002;70:425–434. doi: 10.1086/338688. [DOI] [PMC free article] [PubMed] [Google Scholar]
- 39.Sinnewell JP, Schaid DJ, Yu Z. Statistical analysis of haplotypes with traits and covariates when linkage phase is ambiguous. R package version 1.3.1. 2007 [Google Scholar]
- 40.Limdi NA, Beasley TM, Allison DB, Rivers CA, Acton RT. Racial differences in the prevalence of Factor V Leiden mutation among patients on chronic warfarin therapy. Blood Cells Mol. Dis. 2006;37:100–106. doi: 10.1016/j.bcmd.2006.06.003. [DOI] [PMC free article] [PubMed] [Google Scholar]
- 41.Bodin L, Verstuyft C, Tregouet DA, et al. Cytochrome P450 2C9 (CYP2C9) and vitamin K epoxide reductase (VKORC1) genotypes as determinants of acenocoumarol sensitivity. Blood. 2005;106:135–140. doi: 10.1182/blood-2005-01-0341. [DOI] [PubMed] [Google Scholar]
- 42.Osman A, Enstrom C, Arbring K, Soderkvist P, Lindahl TL. Main haplotypes and mutational analysis of vitamin K epoxide reductase (VKORC1) in a Swedish population: a retrospective analysis of case records. J. Thromb. Haemost. 2006;4:1723–1729. doi: 10.1111/j.1538-7836.2006.02039.x. [DOI] [PubMed] [Google Scholar]
- 43.Lee SC, Ng SS, Oldenburg J, et al. Interethnic variability of warfarin maintenance requirement is explained by VKORC1 genotype in an Asian population. Clin. Pharmacol. Ther. 2006;79:197–205. doi: 10.1016/j.clpt.2005.11.006. [DOI] [PubMed] [Google Scholar]
- 44.Conrad DF, Jakobsson M, Coop G, et al. A worldwide survey of haplotype variation and linkage disequilibrium in the human genome. Nat. Genet. 2006;38:1251–1260. doi: 10.1038/ng1911. [DOI] [PubMed] [Google Scholar]
- 45.Hacker A. U/S A Statistical Portrait of the American People. First edition Viking Press; NY, USA: 1983. [Google Scholar]
- 46.Caldwell MD, Awad T, Johnson JA, et al. CYP4F2 genetic variant alters required warfarin dose. Blood. 2008;111(8):4106–4112. doi: 10.1182/blood-2007-11-122010. [DOI] [PMC free article] [PubMed] [Google Scholar]
Websites
- 101.SeattleSNPs – Variation Discovery Resource. http://pga.gs.washington.edu/
- 102. PHYLIP Home Page http://evolution.genetics.washington.edu/phylip.html.
- 103.US FDA: New labeling information for warfarin. www.fda.gov/cder/drug/infopage/warfarin/default.htm.