

Abstract
We have investigated the contributions of hydrophobic residues, the conserved and variable proline residues, and the conserved lysine residues to the affinity and kinetics of thymosin β4 (Tβ4) binding to MgATP-actin monomers. Pro4, Lys18, Lys19, Pro27, Leu28, Pro29, and Ile34 were substituted with alanine residues. Mutagenesis of Pro4 or Pro27 has little effect (≤3-fold reduction) on the actin binding affinity of Tβ4. Substitution of Lys18 and Lys19, Leu28, Pro29, or Ile34 weakens the affinity of the actin-Tβ4 complex ≥ 10-fold, but the kinetic basis of the lower stability varies among the mutants. Substitution of the conserved lysine residues weakens the affinity by slowing association and accelerating dissociation. Substitution of hydrophobic residue Leu28 or Ile34 weakens the affinity by accelerating dissociation. These results favor a reaction mechanism in which Tβ4 binds actin monomers following a two-step mechanism in which the formation of a bimolecular complex is followed by isomerization to a strong binding state that is coupled to the formation of widely distributed hydrophobic contacts. The isomerization equilibrium is slowed by mutagenesis of Pro29, as revealed by the double-exponential time course of association. Mutagenesis of Pro4 or Pro27 accelerates binding and dissociation but minimally affects the binding affinity (≤ 3-fold reduction), suggesting that cis-trans isomerization of these proline residues contributes to the slow association rate constant of wild-type Tβ4.
Actin filament assembly and disassembly in cells are regulated by several families of proteins, which interact preferentially with actin monomers or filaments (1-3). Many regulatory proteins that bind monomers also sever, cap, or nucleate actin filaments (e.g., gelsolin or the ADF/cofilin family) or promote addition of the monomer to growing filaments (e.g., profilin). The β-thymosins make up the only known family of actin binding proteins whose sole activity under physiological conditions is to sequester actin monomers, thereby generating a pool of unpolymerized actin that can be used for rapid barbed-end elongation. The most thoroughly studied β-thymosin is Tβ4,1 which is the predominant isoform in most vertebrate species (4, 5).
Cross-linking and spectroscopic studies showed that Tβ4 binds actin monomers in a predominantly extended conformation and retains considerable segmental mobility when bound (6). These early findings and later structural studies (7-10) indicate that the interface between actin and Tβ4 consists of multiple small, separate contacts, which constitute a distributed binding site, rather than a compact, solvent-excluding interface. The predominantly unfolded and extended structure of Tβ4 would allow different segments to bind sequentially.
Several studies have used mutagenesis or chemical modification in investigating the contributions of specific Tβ4 residues to actin binding affinity (11-15). Initial studies focused on the six-amino acid sequence LKKTET at positions 17-22, because of its homology to a well-characterized actin-binding sequence in actobindin (15) and because mutations in this region reduce the actin affinity of Tβ4 (15). Truncation at the N- or C-terminus, mutations in the α-helical region, or oxidation of M6 (11-13, 16) weakens actin monomer binding. In addition, cross-linking studies implicated K3, K18, K38, and the C-terminus of Tβ4 in forming contacts with actin (6). However, these early studies provided only semiquantitative data and did not address the contributions of specific Tβ4 residues to binding strength and mechanism or provide data about the effects of mutations on the kinetics of complex formation and dissociation.
Tβ4 binding quenches the fluorescence intensity of AEDANS conjugated to cysteine 374 of actin (17) and enhances the fluorescence of nearby tryptophan residues W330 and W355 (17, 18). These spectroscopic changes were attributed to contact between the α-helical segment of Tβ4 (residues D5-L16) and the hydrophobic pocket on the barbed end of actin monomers. The decrease in AEDANS fluorescence upon binding suggests that Tβ4 displaces the fluorophore from contact with hydrophobic side chains on actin, forcing it into a more solvent-exposed environment.
In this study, we investigate the effects of mutations outside the α-helical region on the kinetics and stability of actin binding, using the signal arising from contact between the α-helical region of Tβ4 and the AEDANS fluorophore. We evaluate the contributions of hydrophobic residues outside the α-helical region (L28 and I34) and of the highly conserved proline (P4, P27, and P29) and lysine (K18 and K19) residues.
EXPERIMENTAL PROCEDURES
Proteins
Rabbit skeletal muscle actin was purified, labeled with AEDANS (17), and gel filtered over Sephacryl S300 at 4 °C in G buffer [5 mM Tris (pH 8.0), 0.2 mM ATP, 0.5 mM DTT, 1 mM NaN3, and 0.1 mM CaCl2]. Actin concentrations were determined by the absorbance at 290 nm and corrected for AEDANS labeling. The labeling efficiency was ≥0.9 AEDANS per actin. Mg2+-actin monomers were prepared from Ca2+-actin monomers with 0.2 mM EGTA and 50 μM MgCl2 immediately before use. All experimental measurements were made in G buffer supplemented with 0.2 mM EGTA and 50 μM MgCl2. Wild-type Tβ4 was isolated from bovine spleen (6).
Thymosin β4 Mutagenesis, Purification, and Labeling
Tβ4 mutants were constructed by the Quik-Change procedure (StrataGene), using the human Tβ4 gene originally provided by C. Pannerselvam and B. L. Horecker in the pT7-7 plasmid. Tβ4 mutants were expressed and purified essentially as described previously (17), except that the BL21Star(DE3) strain (Invitrogen) was used for expression, and cells were grown in Luria-Bertani medium. Mass spectrometry showed that the N-formyl methionine is cleaved from bacterially expressed Tβ4, leaving a free amino-terminal serine, in contrast to N-acetyl serine in mammalian Tβ4; the mutants are therefore designated desacetyl-Tβ4. Alexa-desacetyl-Tβ4 was prepared by incubating 200 μM desacetyl-Tβ4-S43C and 1.3 mM Alexa488-C5-maleimide in 0.1 M Hepes (pH 7.5) buffer supplemented with 5 mM TCEP at room temperature in the dark for 4 h. The reaction mixture was diluted 8-fold with 0.2% acetic acid and applied to a column (0.25 mL bed) of CM-Sepharose pre-equilibrated with acetate buffer (20 mM acetic acid and 20 mM ammonium acetate). The excess dye was flushed with acetate buffer, and the labeled Tβ4 was eluted with 1 M ammonium acetate. The final purification was carried out by high-performance chromatography (HPLC) on a C18 column [Vydac 218TP54; solvent A, 50 mM ammonium acetate (pH 6.5); solvent B, CH3CN] with a resolving gradient from 12 to 20% CH3CN at a rate of 1 mL/min over 48 min. Fractions were collected at 1 min intervals. The labeled Tβ4 was dialyzed against deionized H2O and lyophilized. The concentration of Tβ4 was determined using the bicinchonic acid procedure as previously described (19).
Equilibrium Binding to Actin Monomers
Equilibrium binding of Tβ4 and actin monomers was monitored from the fluorescence intensity of AEDANS-actin or the anisotropy of Alexa-desacetyl-Tβ4 using a Photon Technologies International (South Brunswick, NJ) Quantamaster fluorimeter thermostated at 22 ± 0.1 °C. AEDANS-actin samples were excited at 366 nm, and the fluorescence emission at 90° was scanned from 390 to 600 nm. The observed fluorescence intensities at 470 nm (FI) were used for analysis by least-squares fitting to the following equation:
| (1) |
where FIo is the fluorescence intensity in the absence of Tβ4, FI∞ is the fluorescence intensity at saturating Tβ4 concentrations, Kd is the dissociation equilibrium constant for Tβ4 binding to actin, and [A]tot and [T]tot are the total actin and Tβ4 concentrations, respectively. This equation assumes a 1:1 binding stoichiometry, which has been confirmed for Tβ4-actin binding (20).
Binding of Alexa-desacetyl-Tβ4 to unlabeled actin monomers was assessed by fluorescence anisotropy. The excitation was set to 475 nm, and emission was collected at 515 nm. The total fluorescence intensity of Alexa-desacetyl-Tβ4 is independent of actin concentration and binding (not shown). Therefore, the experimental anisotropy values can be used to calculate the fraction of bound Tβ4. Equilibrium binding affinities were obtained by fitting the actin concentration dependence of the observed anisotropy (robs) to a modified form of eq 1.
Stopped-Flow Measurement
Transient kinetic measurements were taken at 22 ± 0.1 °C with an Applied Photo-physics (Surrey, U.K.) SX.18MV-R stopped-flow apparatus. AEDANS-actin fluorescence was monitored at 90° through a 400 nm long-pass colored glass filter with the excitation wavelength set to 366 nm. Alexa-Tβ4 anisotropy was measured using quartz polarizers with an excitation wavelength of 475 nm and 495 nm long-pass colored glass emission filters.
Time courses of association were measured under pseudo-first-order conditions with the Tβ4 concentration being much greater than the AEDANS-actin concentration by mixing 0.1-0.5 μM actin monomers with a range of Tβ4 concentrations (AEDANS-actin signal) or with the actin concentration being much greater than Tβ4 concentration by mixing 400 nM Alexa-desacetyl-Tβ4 with a range of unlabeled actin concentrations (Alexa-Tβ4 signal). Dissociation time courses were measured by mixing an equilibrated mixture of Tβ4 and actin monomers with a 40-60-fold excess of unlabeled actin monomers or unlabeled Tβ4 (17). The concentrations stated are final after mixing.
Time courses were fitted to a sum of exponentials (eq 2) by nonlinear least-squares fitting using Pro-K software provided with the instrument:
| (2) |
where F(t) is the fluorescence at time t, F∞ is the final fluorescence intensity, Ai is the amplitude, ki is the observed rate constant characterizing the ith relaxation process, and n is the total number of observed relaxations. Uncertainties are reported as standard errors in the fits unless stated otherwise.
RESULTS
Equilibrium Titrations
Wild-type and all mutant Tβ4 peptides quench the fluorescence intensity of actin monomers labeled at Cys374 with AEDANS (Figure 1). A red shift in the emission maximum (17) was also observed in all cases (data not shown). The reduction in fluorescence was used to monitor binding of wild-type Tβ4 and site-specific mutants to MgATP-actin monomers (Figure 2A and Table 1). The maximum fluorescence quenching of AEDANS-labeled actin was ∼50% with native Tβ4 but was lower for all of the mutants. Bacterially expressed wild-type Tβ4, despite not being acetylated at the N-terminus, bound actin with the same affinity and kinetics as bovine Tβ4 (data not shown). Therefore, the absence of the N-terminal acetyl group in mutant Tβ4 peptides is unlikely to significantly contribute to the differences in actin binding.
Figure 1.
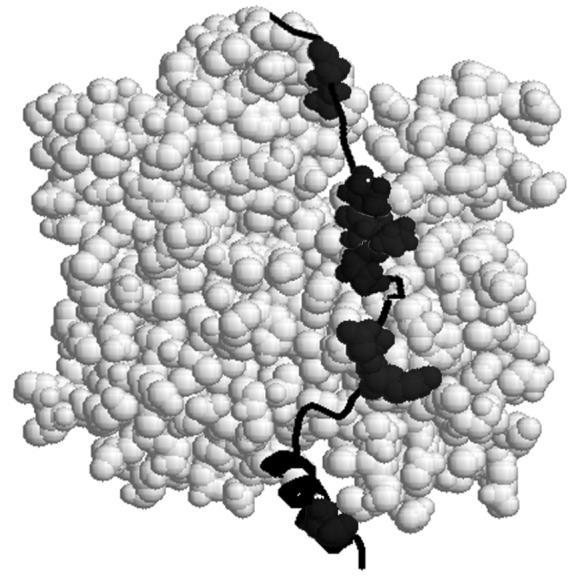
Molecular model of thymosin β4 bound to an actin monomer. Mutated Tβ4 residues are shown in space-filling form, from bottom (barbed end) to top (pointed end), P4A, K18A, K19A, P27A, L28A, P29A, and I34A. The N-terminus of Tβ4 is at the lower center, between subdomains 1 and 3 of actin.
Figure 2.

Equilibrium binding of Tβ4 and actin. (A) Equilibrium titrations of wild-type (●) and P29A (■) Tβ4 with 0.5 μM AEDANS-actin monomers. The normalized fluorescence intensity of AEDANS-actin in the absence of Tβ4 is unity. (B) Equilibrium binding of 0.1 μM Alexa-labeled S43C Tβ4 with unlabeled actin monomers. The fluorescence anisotropy of ALEXA-Tβ4 in the absence of actin is 0.032. The solid lines are the best fits of the data to eq 1.
Table 1.
| mutant | k+(μM−1 s−1) | k−int (s−1)b | k−tc (s−1)b | Kdkin,int (μM)c | Kdkin,tc (μM)d | Kdeq (μM)e |
|---|---|---|---|---|---|---|
| WT | 1.7 ± 0.1 | ∼0f | 1.40 ± 0.01 | NDg | 0.8 ± 0.1 | 1.1 ± 0.2 |
| ALEXA | 0.91 ± 0.11 | 2.6 ± 1.6 | 0.59 ± 0.02 | 2.9 ± 1.8 | 0.7 ± 0.1 | 1.3 ± 0.1 |
| P4A | 2.9 ± 0.2 | 6.2 ± 2.6 | 7.00 ± 0.02 | 2.1 ± 0.9 | 2.4 ± 0.2 | 3.2 ± 0.7 |
| K18A/K19A | 0.17 ± 0.04 | 11.2 ± 1.0 | NDg | 65.8 ± 15.5 | NDg | 37.3 ± 14.9 |
| P27A | 8.9 ± 2.5 | 7.3 ± 0.7 | 3.70 ± 0.01 | 0.8 ± 0.1 | 0.42 ± 0.12 | 1.3 ± 0.4 |
| L28A | 5.4 ± 0.4 | 47.5 ± 6.3 | 59.3 ± 0.7 | 8.8 ± 1.3 | 11.0 ± 0.8 | 14.9 ± 3.4 |
| I34A | 2.8 ± 0.5 | 86.5 ± 5.7 | NDg | 30.9 ± 5.9 | NDg | 25.4 ± 7.3 |
Conditions: 2 mM Tris (pH 8.0), 0.2 mM ATP, 0.5 mM DTT, 1 mM NaN3, 40 μM MgCl2, 22 °C.
Dissociation rate constants obtained from the y-intercepts of Figure 3B (k−int) or direct observation of dissociation of Tβ4 from AEDANS-actin monomers shown in Figure 5 (k−tc).
Calculated using a k− value obtained from the y-intercept (k−int) of Figure 3B (Kdkin,int = k−int/k+).
Calculated using a k− value obtained from dissociation time courses (k−tc) in Figure 5 (Kdkin,tc = k−tc/k+).
Determined by equilibrium titration.
The y-intercept could not be distinguished from the origin.
Not determined.
Wild-type Tβ4 binds AEDANS-actin monomers with an equilibrium binding affinity (Kd) of 1.1 μM under our conditions [Figure 2A and Table 1 (17)]. Alexa-S43C Tβ4 binds unlabeled actin monomers with a comparable affinity (1.3 μM; Figure 2B and Table 1). Mutagenesis of Pro4 (P4A) or Pro27 (P27A) of Tβ4 has a minimal effect on the AEDANS-actin monomer binding affinity [≤3-fold change (Table 1)]. Mutagenesis of Lys18 and Lys19 (K18A/K19A), Leu28 (L28A), Pro29 (P29A), or Ile34 (I34A) weakens the Tβ4 binding affinity dramatically [10-30-fold (Tables 1 and 2)].
Table 2.
| Kd,eq (μM)b | Kd,overall (μM)c | K1d (μM)d | K2d | k+1 (μM−1 s−1) | k−1 (s−1)d | k+2 + k−2 (s−1) |
|---|---|---|---|---|---|---|
| 11.3 ± 2.4 | ∼6.8,e∼10.3f | ∼15.5 | ∼0.8,e∼2f | 2.9 ± 0.2 | 45.0 ± 3.0 | ∼2g |
Conditions: 2 mM Tris (pH 8.0), 0.2 mM ATP, 0.5 mM DTT, 1 mM NaN3, 40 μM MgCl2, 22 °C.
Kd,eq, overall affinity determined by equilibrium titration.
Kd,overall, overall affinity calculated using eq 8.
K1d = K−1/K+1, calculated using a k−1 value obtained from the y-intercept of Figure 4B.
K2d = K−2/K+2, estimated from the fast and slow phase amplitudes of the association time course (Figure 4A) as defined by eqs 14 and 15.
Association Kinetics
Time courses of wild-type, P4A, K18A/K19A, P27A, L28A, and I34A Tβ4 binding to AEDANS-actin monomers all follow single exponentials (Figure 3A, data shown for the P4A mutant) as do time courses of Alexa-Tβ4 binding to unlabeled actin monomers (Figure 3A inset). The observed rate constants (kobs) depend linearly on the Tβ4 concentration over the range examined (Figure 3B,C), consistent with a simple, one-step binding mechanism (Scheme 1)
| Scheme 1 |
where the asterisk denotes a high AEDANS fluorescence. This scheme omits the formation of a weak nonspecific, high-fluorescence “collision complex” that is in rapid equilibrium with free A* and T (17).
Figure 3.

Kinetics of Tβ4 binding to actin. (A) Time courses of 5 (a), 10 (b) and 25 μM Tβ4 (c) (P4A mutant shown) binding to 0.5 μM AEDANS-actin monomers. The inset shows time courses of 0.2 μM Alexa-S43C Tβ4 binding to unlabeled 4 (a) and 25 μM actin monomers (b). The solid lines through the data are the best fits to single exponentials. (B) Tβ4 concentration dependence of the observed association rate constants: (●) wild-type, (◆) P4A, (■) L28A, (▲) I34A, and (○) Alexa-Tβ4. (C) Tβ4 concentration dependence of the observed association rate constants of K18A/K19A Tβ4 binding to actin monomers. Symbols represent data acquired on two separate days using two different preparations. Error bars represent standard errors in the best fits of the time courses to single exponentials.
The second-order association rate constants (k+) determined from the slopes of the lines fitted to the Tβ4 concentration dependence of kobs are comparable for native Tβ4 when assayed by AEDANS fluorescence (1.7 μM−1 s−1) or the anisotropy of Alexa-S43C Tβ4 (0.9 μM−1 s−1), as well as all of the mutants examined (∼3-5 μM−1 s−1), except for P27A which binds more rapidly than wild-type Tβ4 (∼9 μM−1 s−1) and the K18A/K19A mutant which binds more slowly than wild-type Tβ4 (0.17 μM−1 s−1). The intercepts of the best fitting lines yield the dissociation rate constants (k−) and, though subject to uncertainty, are close to the origin (i.e., < 10 s−1) for all except the two hydrophobic residue mutants, L28A and I34A, which are predicted to have rapid dissociation rate constants (k−) of ∼50 and ∼90 s−1, respectively (Table 1).
Time courses of P29A Tβ4 binding to actin monomers follow double exponentials (Figure 4A), indicating that binding is defined by at least two biochemical transitions. The fast observed association rate constants (kon,fast) depend linearly on the P29A Tβ4 concentration over the range examined (Figure 4B). The slow observed association rate constants (kon,slow) depend weakly on the P29A Tβ4 concentration and average ∼2 s−1. The biphasic time courses and concentration dependence of the fast and slow phases indicate P29A Tβ4 (T) binding to actin monomers (A) follows a sequential two-step mechanism (Scheme 2) with a population of two quenched fluorescence states (AT and AT′) that are in a reversible equilibrium:
| Scheme 2 |
This scheme omits the formation of a weak nonspecific, high-fluorescence collision complex that is in rapid equilibrium with free A* and T (17).
Figure 4.

Kinetics of P29A Tβ4 binding to actin. (A) Time courses of 3.8 (a), 15 (b), and 25 μM P29A Tβ4 (c) binding to 0.2-0.5 μM AEDANS-actin monomers. The solid lines through the data are the best fits to double exponentials. The inset shows the relative amplitudes of the fast and slow phases. The solid lines through the data are the best fits to eqs 14 and 15 with the values of k+1 and k−1 constrained to those defined in Table 2 and floating K2d. (B) P29A Tβ4 concentration dependence of the fast (●) and slow (▲) observed association rate constants. The slow phase rate constant was weakly dependent on actin concentration and varied between ∼1 and 2 s−1. Symbols represent data acquired on two separate days using two different preparations. Error bars represent standard errors in the best fits of the time courses to double exponentials.
Because the slow phase amplitude approaches zero as the Tβ4 concentration is increased (Figure 4A inset), we assume that the two bound states (AT and AT′) have comparable fluorescence and the observed fluorescence reflects the sum of the concentrations of these two species. We also exclude a parallel pathway (21) with binding to a mixed Tβ4 population because the relative amplitudes of the two phases measured in association (Figure 4A) and dissociation (Figure 5C; described below) reactions differ.
Figure 5.

Kinetics of dissociation of the Tβ4-actin complex. (A) Time courses of (a) wild-type and (b) P4A Tβ4-AEDANS-actin complex (0.5 μM) dissociation upon mixing with excess (> 40 μM) unlabeled actin monomers. The solid line through the data represents the best fit to a single exponential. (B) Time course of dissociation of the Alexa-Tβ4-actin complex (0.2 μM) upon mixing with excess (> 40 μM) unlabeled Tβ4. The solid line through the data represents the best fit to a single exponential. (C) Time course of dissociation of the P29A Tβ4-AEDANS-actin complex (1 μM) upon mixing with excess (∼80 μM) unlabeled actin monomers. The dashed line through the data represents the best fit to a single exponential. The solid line represents the best fit to a double exponential. The corresponding residuals of the best fits are shown in the inset. The randomness of the double-exponential fit residuals indicates a better fit of the data compared to a single-exponential fit, which shows nonrandom, “ringing” residuals.
The fast phase monitors the formation of the first quenched fluorescence state (AT). Under pseudo-first-order conditions, and when k+1[T] ⪢ k+2 (fulfilled in this case; see below), the observed rate constant of the fast phase (kon,fast) is defined by (21)
| (3) |
permitting the second-order association rate constant (k+1 = 2.9 μM−1 s−1) to be determined from the slope of the line generated by fitting the fast observed rate constant (kon,fast) to the P29A Tβ4 concentration (Figure 4B and Table 2). The intercept yields the dissociation rate constant of AT (k−1 = 45 s−1), permitting a value of 15.5 μM for K1d to be calculated from the ratio of the rate constants [K1d = k−1/k+1 (Table 2)].
The slow phase monitors the isomerization of AT to AT′. The observed rate constant of the slow phase of association (kon,slow) is related to the elementary rate constants in Scheme 2 by (21)
| (4) |
which simplifies to k+2 + k−2 when k+1[T] ⪢ k−1 (achieved at high Tβ4 concentrations). Equation 4 predicts a hyperbolic Tβ4 concentration dependence of kon,slow; however, we could not resolve it reliably, and the observed rate constants appear to be independent of Tβ4 concentration, which would be expected at saturating Tβ4 concentrations. We therefore interpreted the observed kon,slow to be the maximum rate, which reflects the sum of the actin-P29A Tβ4 isomerization rate constants (k+2 + k−2) and occurs at ∼2 s−1.
Dissociation Kinetics
Time courses of dissociation of the actin-Tβ4 complex were measured directly by competition after mixing excess unlabeled actin with a sample of AEDANS-actin monomers equilibrated with Tβ4 (Figure 5A) or by mixing the Alexa-Tβ4-actin complex with excess unlabeled, native Tβ4 (Figure 5B). Time courses of dissociation of wild-type and all mutant Tβ4 peptides, except P29A, from actin monomers follow single exponentials, yielding dissociation rate constants (k−) of ∼1-60 s−1(Table 1), in agreement with the values predicted from the intercepts of Figure 3A. The very high actin monomer concentrations needed to ensure irreversible dissociation precluded the measurement of the dissociation time courses of mutants with weak actin binding affinities (K18A/K19A and I34A).
The time course of dissociation of the actin-P29A Tβ4 complex is biphasic, with a fast phase comprising a majority (∼65%) of the total amplitude, and a slow phase (Figure 5C). The biphasic dissociation time course indicates that (at least) two distinct actin-P29A Tβ4 states (AT and AT′) are populated at equilibrium, as concluded from the association measurements described above. The fast phase reflects dissociation of AT populated at equilibrium, and the slow phase reflects loss of AT′ (Scheme 2). The larger amplitudes of the fast phase indicate that the isomerization equilibrium (K2) favors (k-2 > k+2) formation of the first quenched fluorescence state (AT). From the relative amplitudes of fast and slow phases, we estimate that K2d has a value of ∼2 (Table 2 and ref 21).
The fast dissociation rate constant (koff,fast) is equal to the sum of the rate constants leading to loss of AT (eq 5) (21), and according to the association kinetic measurements presented earlier, k−1 ⪢ k+2 + k−2 so k−1 > k−2. We can therefore estimate k−1 from the observed fast phase of dissociation of the actin-P29A Tβ4 complex (eq 5).
| (5) |
The observed fast dissociation of ∼38 s−1(Figure 5C) approximated as k−1 is comparable to the value of ∼45 s−1 predicted from the values of k−1 and k+2 + k−2 determined from association kinetics.
When dissociation is irreversible (k+1[T] = 0; achieved by competition with excess unlabeled actin monomers) and more rapid than the isomerization preceding dissociation (k−1 ⪢ k−2), the slow observed dissociation rate constant (k off,slow) is defined by the fundamental rate constants in Scheme 2 according to (21)
| (6) |
In the case of P29A Tβ4 binding to actin, k−1 ⪢ k+2, so eq 6 simplifies to
| (7) |
The observed slow dissociation rate constant (koff,slow) of 2.8 s−1 (Figure 5C) approximated to be k−2 is consistent with the values of k−1 and k+2 + k−2 determined from association kinetics and indicates that Scheme 2 reliably accounts for the behavior of P29A Tβ4.
The overall P29A Tβ4 binding affinity (Kd,overall), accounting for the equilibrium population of both bound states with quenched fluorescence, is calculated from (17)
| (8) |
where the coefficient K2d/(1 + K2d) accounts for contributions of the isomerization equilibrium to the overall affinity. Since k+2 + k−2 ∼ 2 s−1, as determined from association measurements (Figure 4), and k−2 ∼ 2.8 s−1, estimated from the time courses of dissociation (Figure 5C and eq 7), our data indicate that (a) k+2 + k−2 is dominated by k−2, (b) k−2 > k+2, and (c) K2d = k−2/k+2 > 1; therefore, (d) Kd,overall ∼ K1d (eq 8). However, a significant fraction (∼35%) of the actin-P29A Tβ4 complex exists as AT′, as calculated (eq 13) from the following equations describing the equilibrium distribution of states defined in Scheme 2:
| (9) |
| (10) |
| (11) |
| (12) |
| (13) |
This equilibrium distribution is calculated using a value of ∼2 for K2d, which was estimated from the relative amplitudes of dissociation (Table 2). However, the relative amplitudes measured in association are consistent with a K2d value of ∼0.8 (∼55% AT′) as determined from the best fits of the relative fast and slow phase amplitudes (Figure 4a inset) to eqs 14 and 15 (21)
| (14) |
| (15) |
This ∼2-fold difference in the value of K2d may reflect experimental uncertainty, though the possibility of additional intermediates not shown in Scheme 2 cannot be eliminated. However, the conclusion that P29A binds by a two-step mechanism with an isomerization equilibrium that favors population of two distinct conformations (i.e., low-fluorescence states) of the actin-Tβ4 complex still holds.
DISCUSSION
The formation of high-affinity macromolecular complexes depends on structural rearrangements that follow the initial collision (22). These structural changes can be particularly extensive if one of the partners is initially unstructured and folds upon binding (22), as is the case with Tβ4 binding to actin monomers (8). In earlier work, we documented structural changes in both actin monomers and Tβ4 that accompany complex formation, which includes stabilization of α-helical structure in Tβ4 as determined by circular dichroism spectroscopy (6) and tritium exchange (17); restructuring of actin subdomain 2, determined by susceptibility to proteolysis (17); and movement of actin subdomain 2 toward subdomain 1, determined by FRET spectroscopy (23). The Tβ4 mutants with reduced affinity for actin monomers used in this study allow us to investigate the steps involved in the formation of the high-affinity actin-Tβ4 complex.
The time courses of association of actin with Tβ4, determined by monitoring the fluorescence intensity of AEDANS-labeled actin monomers or the fluorescence anisotropy of Alexa-labeled Tβ4, follow single exponentials for wild-type Tβ4 and all mutants studied in this work except for P29A Tβ4, which follows a double exponential. The binding of P29A Tβ4 to actin is therefore defined by at least two sequential biochemical transitions. Binding of wild-type and mutant Tβ4 likely also follows a similar pathway, except the additional isomerization transition in wild-type Tβ4 and other mutants cannot be resolved because either (a) they are more rapid than initial binding (i.e., k+2 + k−2 ⪢ k+1[Tβ4] + k−), (b) the second actin-Tβ4 state (AT′) is not significantly populated because the isomerization equilibrium is weak (i.e., K2d ⪢ 1), or (c) the isomerization equilibrium favors formation of AT′ (K2d ⪡ 1) but the isomerization is too slow to be reliably detected by stopped-flow fluorescence. All three cases would yield single-exponential binding curves. The fact that the binding affinities of wild-type Tβ4 and the other mutants determined from equilibrium titrations and kinetic analysis are in general agreement (Table 1) indicates that all relevant transitions are detected experimentally, and we can exclude the possibility that the isomerization exists but is too slow to detect (case c above).
Our data cannot distinguish between cases a and b described above. If we assume that the two-step binding mechanism (Scheme 2) applies to all Tβ4 mutants examined in this study, the fundamental rate constants in Schemes 1 and 2 can be related. For a mechanism in which the isomerization equilibrium is weak (case b above), Scheme 1 and the associated rate constants (k+ and k−) accurately describe the binding mechanism. When the isomerization is too rapid and formation of AT′' cannot be resolved, the fundamental rate constants k+ and k− in Scheme 1 are combinations of rate constants (k+1, k−1, k+2, and k−2) defined in the two-step binding mechanism (Scheme 2) and the values of k+ and k− obtained by applying Scheme 1 represent overall association and dissociation rate constants and are therefore not fundamental rate constants. On the other hand, for a two-step binding mechanism in which k+1 and k−1 are much greater than k+2 and k−2 and the isomerization equilibrium favors formation of the initial binding state (AT in Scheme 2), as is the case with P29A Tβ4 binding to actin, the initial binding process dominates overall association and dissociation.
Our data show that mutations at widely distributed sites in the Tβ4 sequence differentially affect binding to actin monomers. Mutagenesis of P4 or P27 minimally affects the binding affinity (≤ 3-fold reduction), although both mutants exhibit accelerated binding and dissociation (Table 1), raising the possibility that cis-trans isomerization at these proline residues could contribute to the slow association rate constant of wild-type Tβ4. In contrast, mutagenesis at K18 and K19, L28, P29, or I34 reduces the measured affinity by factors of 10-30 (Table 1). While these different alanine substitutions reduce the affinity of Tβ4 for actin, the kinetic basis for the reduced affinity differs for the different Tβ4 mutants. L28A, I34A, and P29A substitutions weaken the actin binding affinity by accelerating dissociation of the actin-Tβ4 complex. The K18A/K19A substitution greatly reduces actin binding affinity by both slowing association and accelerating dissociation.
Several models have been proposed for the actin-Tβ4 complex, based on NMR studies of the complex and on crystallographic studies of homologous WH2 sequences bound to actin (7-10). While differing in some details, all these models show a distributed interface extending from the barbed to the pointed end of the actin monomer. Mutations that are widely distributed across the interface strongly affect the actin-Tβ4 interaction, consistent with the large, disperse binding interface predicted by these models.
The strong effect of the K18A/K19A substitution on the association rate indicates that these residues play an important role in binding to actin monomers. Because actin has a net negative charge under our conditions, it is possible that binding begins with an electrostatic attraction between the cluster of lysine residues on Tβ4 (residues 11, 14, 16, 18, and 19) and the cluster of acidic residues on actin subdomain 1 (residues 1-4 and 98-100), leading to the formation of a quenched fluorescence complex (17). Conformational searching would then allow the N- and C-terminal regions of Tβ4 to make contact with complementary surfaces on actin, to fold into binding-competent conformations, and to form widely distributed hydrophobic contacts. Substitution of these lysine residues may also disrupt helix formation (16) believed to be important for strong Tβ4 binding to actin monomers, as indicated by the ≥ 10-fold more rapid dissociation rate constant (Table 1). Consistent with this latter interpretation, mutations in the α-helical region or oxidation of M6 (11-13, 16) weakens actin monomer binding.
Changes in actin conformation may further stabilize the complex and likely depend on interactions with the C-terminal segment of Tβ4, which are weakened by mutations at Leu28, Pro29, and Ile34. The alanine substitutions at these residues might increase the flexibility of the Tβ4 backbone and facilitate conformational searching, as indicated by the more rapid association rate constant [k+(Table 1)] but would preclude formation of stabilizing hydrophobic contacts, accelerate dissociation of the complex, and weaken the overall binding affinity of Tβ4 for actin monomers (Table 1).
ACKNOWLEDGMENT
We thank Drs. Nigel Grindley, Cathy Joyce, and Andrew Miranker for use of the fluorescence spectrophotometers.
This work was supported by research grants from the NIH (GM071688), the American Heart Association (0655849T), and the NSF (MCB-0546353) to E.M.D.L.C. J.K.A. was supported by Yale-HHMI Future Scientist Summer Research Fellowship, Yale College Dean's Research Fellowship, and Mellon Undergraduate Research Grant awards. A.O.O. was supported by National Institutes of Health Predoctoral Fellowship Award F31AR051614. W.C. was supported by American Heart Association Postdoctoral Fellowship Award 0625997T. D.S. was supported by NIH grants to the Pennsylvania Muscle Institute and H.L. Sweeney.
Footnotes
Abbreviations: AEDANS, N-iodoacetyl-N′-(5-sulfo-1-naphthyl)-ethylenediamine; Tβ4, thymosin β4; TCEP, tris(2-carboxyethyl)phosphine.
REFERENCES
- 1.Pollard TD, Borisy GG. Cellular motility driven by assembly and disassembly of Actin filaments. Cell. 2003;112:453–465. doi: 10.1016/s0092-8674(03)00120-x. [DOI] [PubMed] [Google Scholar]
- 2.De La Cruz EM, Ostap EM. Actin. In: Lewin B, Cassimeris L, Lingappa VR, Plopper G, editors. Cells. Jones and Bartlett Publishers; Boston: 2007. pp. 371–410. [Google Scholar]
- 3.Carlier MF, Le Clainche C, Wiesner S, Pantaloni D. Actin-based motility: From molecules to movement. BioEssays. 2003;25:336–345. doi: 10.1002/bies.10257. [DOI] [PubMed] [Google Scholar]
- 4.Erickson-Viitanen S, Ruggieri S, Natalini P, Horecker BL. Distribution of thymosin β4 in vertebrate classes. Arch. Biochem. Biophys. 1983;221:570–576. doi: 10.1016/0003-9861(83)90177-7. [DOI] [PubMed] [Google Scholar]
- 5.Goldstein AL, Hannappel E, Kleinman HK. Thymosin β4: Actin-sequestering protein moonlights to repair injured tissues. Trends Mol. Med. 2005;11:421–429. doi: 10.1016/j.molmed.2005.07.004. [DOI] [PubMed] [Google Scholar]
- 6.Safer D, Sosnick TR, Elzinga M. Thymosin β4 binds actin in an extended conformation and contacts both the barbed and pointed ends. Biochemistry. 1997;36:5806–5816. doi: 10.1021/bi970185v. [DOI] [PubMed] [Google Scholar]
- 7.Chereau D, Kerff F, Graceffa P, Grabarek Z, Langsetmo K, Dominguez R. Actin-bound structures of Wiskott-Aldrich syndrome protein (WASP)-homology domain 2 and the implications for filament assembly. Proc. Natl. Acad. Sci. U.S.A. 2005;102:16644–16649. doi: 10.1073/pnas.0507021102. [DOI] [PMC free article] [PubMed] [Google Scholar]
- 8.Domanski M, Hertzog M, Coutant J, Gutsche-Perelroizen I, Bontems F, Carlier MF, Guittet E, van Heijenoort C. Coupling of folding and binding of thymosin β4 upon interaction with monomeric actin monitored by nuclear magnetic resonance. J. Biol. Chem. 2004;279:23637–23645. doi: 10.1074/jbc.M311413200. [DOI] [PubMed] [Google Scholar]
- 9.Hertzog M, van Heijenoort C, Didry D, Gaudier M, Coutant J, Gigant B, Didelot G, Préat T, Knossow M, Guittet E, Carlier MF. The β-thymosin/WH2 domain: Structural basis for the switch from inhibition to promotion of actin assembly. Cell. 2004;117:611–623. doi: 10.1016/s0092-8674(04)00403-9. [DOI] [PubMed] [Google Scholar]
- 10.Irobi E, Aguda AH, Larsson M, Guerin C, Yin HL, Burtnick LD, Blanchoin L, Robinson RC. Structural basis of actin sequestration by thymosin-β4: Implications for WH2 proteins. EMBO J. 2004;23:3599–3608. doi: 10.1038/sj.emboj.7600372. [DOI] [PMC free article] [PubMed] [Google Scholar]
- 11.Hannappel E, Wartenberg F. Actin-sequestering ability of thymosin β4, thymosin β4 fragments, and thymosin β4-like peptides as assessed by the DNase I inhibition assay. Biol. Chem. Hoppe-Seyler. 1993;374:117–122. doi: 10.1515/bchm3.1993.374.1-6.117. [DOI] [PubMed] [Google Scholar]
- 12.Heintz D, Reichert A, Mihelic-Rapp M, Stoeva S, Voelter W, Faulstich H. The sulfoxide of thymosin β4 almost lacks the polymerization-inhibiting capacity for actin. Eur. J. Biochem. 1994;223:345–350. doi: 10.1111/j.1432-1033.1994.tb19000.x. [DOI] [PubMed] [Google Scholar]
- 13.Huff T, Zerzawy D, Hannappel E. Interactions of β-thymosins, thymosin β4-sulfoxide, and N-terminally truncated thymosin β4 with actin studied by equilibrium centrifugation, chemical cross-linking and viscometry. Eur. J. Biochem. 1995;230:650–657. doi: 10.1111/j.1432-1033.1995.tb20606.x. [DOI] [PubMed] [Google Scholar]
- 14.Van Troys M, Dewitte D, Goethals M, Carlier MF, Vandekerckhove J, Ampe C. The actin binding site of thymosin β4 mapped by mutational analysis. EMBO J. 1996;15:201–210. [PMC free article] [PubMed] [Google Scholar]
- 15.Vancompernolle K, Goethals M, Huet C, Louvard D, Vandekerckhove J. G- to F-actin modulation by a single amino acid substitution in the actin binding site of actobindin and thymosin β4. EMBO J. 1992;11:4739–4746. doi: 10.1002/j.1460-2075.1992.tb05579.x. [DOI] [PMC free article] [PubMed] [Google Scholar]
- 16.Yarmola EG, Klimenko ES, Fujita G, Bubb MR. Thymosin β4: Actin regulation and more. Ann. N.Y. Acad. Sci. 2007;1112:76–85. doi: 10.1196/annals.1415.008. [DOI] [PubMed] [Google Scholar]
- 17.De La Cruz EM, Ostap EM, Brundage RA, Reddy KS, Sweeney HL, Safer D. Thymosin-β (4) changes the conformation and dynamics of actin monomers. Biophys. J. 2000;78:2516–2527. doi: 10.1016/S0006-3495(00)76797-X. [DOI] [PMC free article] [PubMed] [Google Scholar]
- 18.Jean C, Rieger K, Blanchoin L, Carlier MF, Lenfant M, Pantaloni D. Interaction of G-actin with thymosin β4 and its variants thymosin β9 and thymosin βmet9. J. Muscle Res. Cell Motil. 1994;15:278–286. doi: 10.1007/BF00123480. [DOI] [PubMed] [Google Scholar]
- 19.Safer D, Elzinga M, Nachmias VT. Thymosin β4 and Fx, an actin-sequestering peptide, are indistinguishable. J. Biol. Chem. 1991;266:4029–4032. [PubMed] [Google Scholar]
- 20.Weber A, Nachmias VT, Pennise CR, Pring M, Safer D. Interaction of thymosin β4 with muscle and platelet actin: Implications for actin sequestration in resting platelets. Biochemistry. 1992;31:6179–6185. doi: 10.1021/bi00142a002. [DOI] [PubMed] [Google Scholar]
- 21.Hannemann DE, Cao W, Olivares AO, Robblee JP, De La Cruz EM. Magnesium, ADP, and actin binding linkage of myosin V: Evidence for multiple myosin V-ADP and actomyosin V-ADP states. Biochemistry. 2005;44:8826–8840. doi: 10.1021/bi0473509. [DOI] [PubMed] [Google Scholar]
- 22.Sugase K, Dyson HJ, Wright PE. Mechanism of coupled folding and binding of an intrinsically disordered protein. Nature. 2007;447:1021–1025. doi: 10.1038/nature05858. [DOI] [PubMed] [Google Scholar]
- 23.Dedova IV, Nikolaeva OP, Safer D, De La Cruz EM, dos Remedios CG. Thymosin β4 induces a conformational change in actin monomers. Biophys. J. 2006;90:985–992. doi: 10.1529/biophysj.105.063081. [DOI] [PMC free article] [PubMed] [Google Scholar]