

Abstract
Peroxisome proliferator-activated receptors (PPARs) are lipid sensing nuclear receptors that have been implicated in multiple physiologic processes including cancer. Here, we determine that PPARδ induces cell proliferation through a novel cyclin E1-dependent mechanism and is upregulated in many human thyroid tumors. The expression of PPARδ was induced coordinately with proliferation in primary human thyroid cells by activation of serum, TSH/cAMP/pKa or EGF/MEK/ERK mitogenic signaling pathways. Engineered overexpression of PPARδ increased thyroid cell number, the incorporation of BrdU and the phosphorylation of Rb 40–45% in just 2 days, one usual cell population doubling. The synthetic PPARδ agonist GW501516 augmented these PPARδ proliferation effects in a dose-dependent manner. Overexpression of PPARδ increased cyclin E1 protein 9-fold, whereas knock down of PPARδ by siRNA reduced both cyclin E1 protein and cell proliferation 2-fold. Induction of proliferation by PPARδ wasabrogated by knockdown of cyclin E1 by siRNA in primary thyroid cells and by knockout of cyclin E1 in mouse embryo fibroblasts, confirming a cyclin E1 dependence for this PPARδ pathway. In addition, the mean expression of native PPARδ was increased 2- to 5-fold (p<0.0001) and correlated with that of the in situ proliferation marker Ki67 (R=0.8571; p=0.02381) in six different classes of benign and malignant human thyroid tumors. Our experiments identify a PPARδ mechanism that induces cell proliferation through cyclin E1 and is regulated by growth factor and lipid signals. The data argue for systematic investigation of PPARδ antagonists as anti-neoplastic agents and implicate altered PPARδ-cyclin E1 signaling in thyroid and other carcinomas.
Keywords: PPARδ, nuclear receptors, thyroid cancer, cell proliferation, cyclin E1
Introduction
Peroxisome proliferator-activated receptors (PPARs) form molecular complexes with hydrophobic ligands such as fatty acids, the 9-cis-retinoic acid receptor (RXR) and co-activators to regulate the transcription of target genes (1, 2). The three major PPARs, α, δ and γ (NR1C1, NR1C2 and NR1C3), are encoded by separate genes and have distinct patterns of expression and biological activities. PPARα is expressed primarily in liver, brown adipose, kidney and heart tissues (3). It plays a central role in fatty acid uptake and oxidation and is the target of the fibrate drugs that are used to treat patients with dyslipidemia (4). PPARγ is expressed most highly in fat and macrophages. PPARγ functions in adipogenesis, lipid storage, glucose homeostasis, inflammation and atherosclerosis (5, 6). Synthetic thiazolidinedione agonists for PPARγ are used to treat patients with type 2 diabetes (7). PPARδ is expressed wider than PPARα and PPARγ, implying a more general cell function that is not yet understood. PPARδ has been implicated in fatty acid β-oxidation (8) muscle fiber-type remodeling (9), lipoprotein metabolism and glucose uptake (10, 11). A synthetic agonist for PPARδ modulated HDL and triglyceride levels in healthy volunteers (12). Thus, all three PPARs function in aspects of lipid metabolism.
PPARs have also been implicated in tumorigenesis but the molecular mechanisms are not well understood. For example, PPARα is thought to mediate the carcinogenic effects of peroxisome proliferators in hepatocellular carcinoma in rodents (13). In addition, both PPARδ and PPARγ modulate colon tumorigenesis in pre-disposed mouse models (14–18). Furthermore, natural mutations in PPARγ have been identified in human colon (19) and thyroid carcinoma (20, 21) tissues. These findings indicate significant functions for PPARs in thyroid cancer and physiology.
Here, we show that PPARδ is the predominant PPAR that is expressed in normal human thyroid cells and tissues. Our experiments determine that PPARδ induces cell proliferation by a novel cyclin E1-dependent mechanism and is up regulated in six different classes of human thyroid tumors. The results demonstrate that PPARδ regulates epithelial cell proliferation via cyclin E1, growth factor and lipid signals. Thus, deregulation of the PPARδ-cyclin E1 signaling axis appears to be important in thyroid and perhaps other carcinomas.
Materials and Methods
Cell lines and primary cultures of human thyroid cells
Primary cultures of human thyroid follicular epithelial cells were isolated from normal thyroid tissues by mechanical dispersion and treatment with collagenase P and dispase II (Roche), as described (22) (Supplemental Fig. S1, A–D). The primary thyroid cells were cultured in RPMI medium supplemented with 10% fetal bovine serum (FBS), 2 mM L-glutamine and penicillin/streptomycin (Invitrogen). Fungizone (Invitrogen) and primocin (Sigma) were present in the medium for the first 2–3 days. The primary cells were maintained at 37°C in a humidified atmosphere containing 5% CO2. 293T human embryonic kidney cells were obtained from ATCC.
Immunoreagents and chemicals
PPARδ (H74) antiserum, PPARγ (E8) antibody, cyclin E1 (M20) antiserum, cyclin A2 (BF683) antibody, cyclin B1 (GNS1) antibody, p21 (F5) antibody, p27 (F8) antibody, cyclin D1 (H295) antiserum and goat anti-mouse IgG-HRP secondary antibody were obtained from Santa Cruz. Phospho-Rb antiserum was purchased from Cell Signaling. Cyclin D3 antiserum (LabVision), anti-rabbit IgG-HRP (GE Healthcare), thyroglobulin antiserum (M0781) (DAKO), β-actin antibody (Sigma), and anti-BrdU-fluorescein (Roche) were also used. The PPARδ agonist GW501516 was purchased from Cayman Chemical. EGF, TSH and insulin were purchased from Sigma.
SDS-PAGE and immunoblots
Total protein was extracted from tissues or cells with lysis buffers containing non-ionic (NP-40 or Triton X-100) and/or ionic (sodium dodecylsulfate and sodium deoxycholate) detergents (USB or Sigma) and Complete Mini protease inhibitors (Roche). 20–40 μg protein was separated on bis/tris SDS-PAGE gels in the MOPS system (Invitrogen) and transferred to nitrocellulose membranes (BioRad) using a semi-dry apparatus (Hoeffer). Nitrocellulose membranes were blocked in 5% non-fat dry milk, incubated at 4 °C with primary antibody or antiserum overnight, incubated with horseradish peroxidase-conjugated secondary antibodies for 1–2 h at room temperature and detected using enhanced chemiluminescence (Amersham). The blots were stripped and re-probed with β-actin as a loading control. Total protein in cell lysates was determined with a modified Bradford assay (Biorad). Protein levels were quantified on x-ray films from immunoblots using ImageJ software (http://rsb.info.nih.gov/ij/).Values were normalized to levels of control β-actin in the same lanes. Kaleidoscope (BioRad) and Magicmark (Invitrogen) markers were used as molecular weight standards.
Electroporation and transfection
Electroporations were performed using the VPI-1005 Amaxa system (Amaxa Inc) that achieved 60–80% transduction efficiency in primary thyroid cells as determined by expression of control GFP plasmids based on fluorescence microscopy and flow cytometry (unpublished data). pCDNA3.1 or pCDNA3.2 expression vectors (Invitrogen) or siRNAs (Santa Cruz) were introduced into primary thyroid cells by electroporation, and the cells were allowed to recover 2 days in normal growth medium. Electroporation experiments were repeated 3–5 times using preparations of primary thyroid cells from different patients. 293T cells were transfected with Fugene (Roche), according to the manufacturer’s recommendations.
Cell proliferation assays
Cell proliferation was determined by cell counting and the incorporation of BrdU into cell nuclei. Cells were counted using an automated Z2 particle counter (Beckman-Coulter). For BrdU incorporation, cells were plated on glass cover slips and BrdU was added to the culture medium 3–5h before fixation. The cells were fixed in absolute methanol at 4°C, denatured in 2 M HCl and stained with mouse anti-BrdU-fluorescein conjugate (Roche), according to the manufacturer’s recommendations. Propidium iodide was used as the nuclear counterstain. Microscopic fields were selected randomly and ≥200 cells were counted under each condition. BrdU-positive cells were calculated as the percentage of total cells in each field. For GW501516 treatment, cells were incubated in medium with 10% charcoal-dextran stripped FBS (Hyclone).
RNA isolation and RT-PCR
Total RNA was extracted from cells or tissues using TRIzol reagent (Invitrogen). cDNA was synthesized using SuperScript first strand synthesis kit (Invitrogen) from 2 μg total RNA. PCR was performed with the following primers: PPARδ forward primer 5′-ACT GAG TTC GCC AAG AGC ATC-3′ and PPARδ reverse primer 5′-TTA GTA CAT GTC CTT GTA GAT CT-3′ (546 bp); PPARγ forward primer 5′-TGA CTT GAA CGA CCA AGT AAC TC-3′ and PPARγ reverse primer 5′-CTA GTA CAA GTC CTT GTA GAT CTC-3′ (508 bp); PPARα forward primer 5′-TCC GCA TCT TTC ACT GCT GCC A-3′ and PPARα reverse primer 5′-TCA GTA CAT GTC CCT GTA GAT C-3′ (600 bp); β-actin forward primer 5′-TCC TTC CTG GGC ATG GAG TC-3′ and β-actin reverse primer 5′-GTA ACG CAA CTA AGT CAT AGT C-3′ (361 bp). PCR products were analyzed on 1–1.7% agarose gels and visualized by ethidium bromide staining.
Immunohistochemistry
Tissue sections were de-paraffinized in xylenes, re-hydrated through a graded ethanol series and washed in Tris-buffered saline (TBS). Antigen retrieval was carried out by heating in DTRS buffer (pH=6, DAKO) or Tris-EDTA (pH=9) buffer for 15 min in a microwave. Endogenous peroxidase activity was blocked by 3% H2O2 in methanol for 5 min. Non-specific binding sites were blocked by Protein Block (DAKO) for 20 min. Tissue sections were incubated for 1 h at room temperature with rabbit antiserum against PPARδ (H74, Santa Cruz), monoclonal antibody against PPARγ (E8, Santa Cruz) or monoclonal antibody against Ki67 proliferation antigen (clone KiS5, DAKO). This was followed by a 30 min incubation with goat anti-mouse or goat anti-rabbit IgG conjugated to horseradish peroxidase (HRP)-labeled polymer (EnVision, DAKO). Slides were developed for 5 min with 3-3′-diaminobenzidine (DAB) chromogen and counterstained with Gil’s hematoxylin. Negative controls were performed by substituting primary antibody with non-immune mouse or rabbit immunoglobulins.
Construction of thyroid tissue microarrays
Tissue microarrays were constructed using formalin-fixed paraffin embedded tissue blocks from 103 patients with benign and malignant thyroid tumors that were selected by two experienced endocrine pathologists (tgk and mt): 18 follicular adenomas, 20 follicular carcinomas, 37 papillary carcinomas, 10 anaplastic carcinomas, 9 Hurthle cell adenomas and 9 Hurthle cell carcinomas were chosen. 76 corresponding normal thyroid tissues were selected from the same thyroid blocks as controls. A minimum of two tissue cylinders with a diameter of 1 mm were arrayed using an automated tissue microarrayer (ATA-27, Beecher Instruments, Sun Prairie, WI). Recipient blocks were cut into 4-μm thick sections on Surgipath silane-coated positive charged slides. PPARδ expression was quantified by two methods. First, PPARδ immunoreactivity was calculated as a Reiner score (23) based on the nuclear and cytoplasmic intensity and the percentage of immunoreactive cells visualized manually by bright field microscopy. Second, PPARδ expression was quantified using the Chromavision Automated Cellular Imaging System (ACIS) with positive brown nuclear and cytoplasmic staining recorded as a numerical score between 0 and 225 for each pixel and normalized to an area of 1 μm2. Nuclear staining for Ki67 was quantified using ACIS based on three color parameters: hue, luminosity and saturation. The ACIS software was instructed by setting color-specific thresholds to determine brown (positive stain) from blue (negative counterstain) in the nuclei within outlined areas. The percentage of positively stained nuclei (nuclear index) was calculated from 200–500 cells in each tissue sample.
Statistical analyses
Cell proliferation was calculated as the mean of duplicate or triplicate measurements plus or minus the standard deviation. p values were calculated using a two tailed Student’s t test for continuous variables. Correlations were calculated using the Spearman rank correlation test. p<0.05 was considered to be statistically significant.
Results
PPARδ is expressed in normal human thyroid cells and tissues
We first determined the expression of PPARα, PPARδ and PPARγ in normal human thyroid cells and tissues. Cultures of primary thyroid cells were isolated from normal human thyroid tissues that were obtained after surgery for thyroid tumors (Supplemental Fig. 1, A–C). The primary cultures were 85–90% pure and retained differentiated functions such as the expression of thyroglobulin and thyroperoxidase in response to thyroid stimulating hormone (TSH) (Supplemental Fig. 1, D). PPARδ mRNA was abundant, whereas PPARγ mRNA was low and PPARα mRNA was barely detectable in normal thyroid tissue and primary thyroid cells based on RT-PCR (Fig. 1A). PPARδ expression was estimated to be 10- to 15-fold higher than PPARγ expression based on Northern blots that detected the PPARδ (3.7 kb) and PPARγ (1.9 kb) mRNA transcripts (unpublished data). PPARγ mRNA was highest in control adipose tissue and PPARα mRNA was highest in control HepG2 hepatocellular carcinoma cells (Fig. 1A). The expression of β-actin was similar in all samples (Fig. 1A).
Figure 1. PPARδ is expressed highly and correlates with proliferation in normal thyroid cells and tissue.

(A) RT-PCR showed that PPARδ mRNA was abundant, PPARγ mRNA was low and PPARα mRNA was barely detectable in normal thyroid cells and tissue. β-actin mRNA served as the positive control. (B) Expression of PPARδ protein was abundant in normal thyroid cells and tissue based on immunoblots using the H74 antiserum against PPARδ (left panel). 293T cells transfected with PPARδ, PPARδ-V5, PPARγ or PPARγ-V5 showed that H74 was specific for PPARδ and did not cross-react with PPARγ (right panel). (C) Loss of PPARδ expression paralleled that of phospho-Rb after removal of FBS from the culture medium to inhibit cell proliferation. The expression of thyroglobulin, a marker of thyroid differentiation, was increased after FBS removal. (D) An induction in PPARδ expression paralleled that of phospho-Rb after addition of FBS to the culture medium to stimulate proliferation of quiescent thyroid cells. The expression of thyroglobulin was reduced and β-actin was relatively constant after the addition of FBS.
Expression of PPARδ protein was next determined by immunoblotting. H74 antiserum against PPARδ reacted on immunoblots with the native PPARδ protein (50 kDa) in normal thyroid tissues and primary thyroid cells (Fig. 1B, left panel). H74 also reacted with PPARδ and PPARδ-V5 but not with PPARγ (54 kDa) or PPARγ-V5 that were expressed by transfection in 293T kidney cells (Fig. 1B, right panel). Immunohistochemistry demonstrated that H74 reacted with the nuclei and cytoplasm of normal thyroid cells in paraffin-embedded tissue sections (Supplemental Fig. 2A). This nuclear immunoreactivity was not elevated in thyroid carcinomas that expressed the PAX8-PPARγ fusion protein (21) (Supplemental Fig. 2B), which reacted strongly with the E8 antibody against PPARγ in the same tissue sections (Supplemental Fig. 2C). These experiments show that: (A) PPARδ is the predominant PPAR expressed in normal thyroid cells and tissues and (B) the H74 antiserum is specific for PPARδ.
Expression of PPARδ correlates with cell proliferation and is induced by thyroid mitogens
We observed that the expression of PPARδ correlated directly with proliferation in thyroid cells. For example, PPARδ protein decreased on immunoblots after removal of FBS from the culture medium and this paralleled a reduction in phospho-Rb (Fig. 1C), an established marker of cell proliferation. In a complementary fashion, the expression of PPARδ protein increased in parallel with phospho-Rb when quiescent primary thyroid cells were induced to re-enter the cell cycle by addition of FBS to the culture medium (Fig. 1D). The level of PPARδ in these experiments varied inversely with thyroid differentiation, as measured by the markers thyroglobulin (Fig. 1, C and D) and thyroperoxidase (unpublished data). Control β-actin protein was relatively constant (Fig. 1, C and D). These results show that the expression of PPARδ correlates directly with proliferation and inversely with differentiation in normal thyroid cells.
We next determined the effects of thyroid mitogens on expression of PPARδ. Expression of PPARδ and phospho-Rb were induced in parallel in quiescent thyroid cells by treatment with TSH plus insulin or EGF plus insulin but not with insulin alone (Fig. 2A). The TSH/cAMP/pKa and EGF/MEK/ERK pathways induce proliferation in thyroid cells in the presence of insulin/IGF1, which are permissive for proliferation but have no mitogenic activity by themselves (24). As predicted, the MEK/ERK inhibitor U1026 and the pKa inhibitor H89 each attenuated the induction of PPARδ (Fig. 2B) and phospho-Rb (unpublished data) by EGF and TSH treatment, respectively. Thus, PPARδ is increased coordinately with proliferation that is induced in normal thyroid cells by serum, TSH or EGF.
Figure 2. Expression of PPARδ is induced by thyroid mitogens.

(A) TSH + insulin and EGF + insulin but not insulin alone induced both PPARδ and phospho-Rb in normal thyroid cells. (B) The induction of PPARδ and phospho-Rb was blocked by treatment of thyroid cells with H89 or U0126, inhibitors of the TSH and EGF pathways, respectively.
PPARδ regulates proliferation in normal thyroid cells
To determine whether PPARδ itself regulates cell proliferation, we performed both gain- and loss-of-function experiments. First, overexpression of PPARδ by electroporation increased thyroid cell number 40–45% (Fig. 3A) and the incorporation of BrdU 30–35% (Fig. 3B) over 5 days compared to vector controls. In contrast, overexpression of control PPARγ in the same experiment had little effect (Fig. 3A and 3B). Second, efficient knockdown of endogenous PPARδ by siRNA decreased thyroid cell number (Fig. 3A) and the incorporation of BrdU (Fig. 3B) 50–55% compared to oligonucleotide controls. The levels of PPARδ, PPARγ and β-actin were confirmed on immunoblots in these experiments (Fig 3C). The E8 antibody cross-reacts with both PPARγ and PPARδ (Figure 3C, right panel). These data determine that PPARδ regulates proliferation in normal human thyroid cells.
Figure 3. PPARδ induces proliferation in normal human thyroid cells.

(A) Overexpression of PPARδ by electroporation increased thyroid cell number 40–45%, whereas knockdown of PPARδ by siRNA decreased thyroid cell number 50–55% over 5 days. Overexpression of control PPARγ had little effect in the same experiment. Measurements are the mean of duplicate or triplicate culture dishes +/− the standard deviation (*p<0.0001). (B) Overexpression of PPARδ increased the incorporation of BrdU 30–35%, whereas knockdown of endogenous PPARδ by siRNA decreased the incorporation of BrdU 50–55% in the normal thyroid cells. Overexpression of control PPARγ had little effect in the same experiment. Measurements represent the mean of duplicate or triplicate culture dishes +/− the standard deviation (*p<0.0001). (C) Immunoblots verified the levels of PPARδ, PPARγ and β-actin in these experiments. The E8 PPARγ antibody cross-immunoreacts with PPARδ (right panel).
PPARδ induces cyclin E1 in normal thyroid cells
To establish the mechanism through which PPARδ induces thyroid cell proliferation, we measured regulators of the epithelial cell cycle. Cyclin E1 protein was increased 9-fold by overexpression of PPARδ and reduced 2-fold by siRNA knockdown of PPARδ in primary thyroid cells (Fig. 4A). Phospho-Rb was increased 2-fold and decreased 2.5-fold, respectively, under the same conditions (Fig. 4A). Cyclin A2 was induced 2-fold by over expression of PPARδ and reduced 4-fold by knockdown of PPARδ (Fig. 4A) but no significant changes in cyclins D1, D3 or B1, the cdk inhibitors p21 or p27, or β-actin were observed (Fig. 4A). Overexpression of control PPARγ induced cyclin E1 less than 2-fold and did not alter phospho-Rb (Fig. 4A). These data determine that PPARδ induces both cyclin E1 and proliferation in normal thyroid cells.
Figure 4. PPARδ induces cell proliferation by a cyclin E1-dependent mechanism.

(A) Overexpression of PPARδ in normal thyroid cells by electroporation increased cyclin E1 protein 9-fold and phospho-Rb 2-fold compared to vector controls. Efficient knockdown of PPARδ by siRNA decreased cyclin E1 2-fold and phospho-Rb 2.5-fold compared to oligonucleotide controls. Overexpression and knockdown of PPARδ increased cyclin A2 2-fold and reduced cyclin A2 4-fold, respectively, whereas the expression of cyclins D1, D3, and B1, the cdk inhibitors p27 and p21, and β-actin changed little under the same conditions. Overexpression of control PPARγ increased cyclin E1 less than 2-fold and did not alter levels of cyclin A2 or phospho-Rb. Measurements are normalized to β-actin and calculated as the fold change over vector or oligonucleotide controls. (B) Induction of proliferation by PPARδ in normal thyroid cells was blocked by knockdown of cyclin E1 by siRNA. Measurements represent the mean of duplicate culture dishes +/− the standard deviation (*p<0.007). (C) The induction of cell proliferation by PPARδ was abrogated in cyclin E1 −/− mouse embryo fibroblasts compared to wild-type mouse embryo fibroblasts or cyclin D1 −/− mouse embryo fibroblasts. Black bars represent cells over expressing PPARδ and white bars represent vector controls. Measurements are the mean of duplicate dishes +/− the standard deviation (*p<0.004).
Induction of cell proliferation by PPARδ is dependent on cyclin E1
Two additional experiments demonstrated that PPARδ regulates cell proliferation through a cyclin E1-dependent mechanism. First, down-regulation of cyclin E1 protein by siRNA blocked the incorporation of BrdU that was induced by PPARδ in primary thyroid cells (Fig. 4B). Second, induction of cell proliferation by PPARδ was not observed in mouse embryo fibroblasts that contained knockout of the cyclin E1 gene, in contrast to wild-type mouse embryo fibroblasts or mouse embryo fibroblasts that contained knockout of the cyclin D1 gene (Fig. 4C). These experiments show that induction of cell proliferation by PPARδ is dependent on cyclin E1.
GW501516 augments proliferation in normal thyroid cells
To determine whether proliferation by PPARδ is dependent on PPARδ lipid ligand, we tested the selective PPARδ agonist GW501516. Proliferation increased in a dose-dependent manner by treatment of primary thyroid cells with GW501516 (10–500 nM), as determined by cell number (Fig. 5A) and the incorporation of BrdU (unpublished data). No significant effects on the expression of endogenous PPARδ or β-actin protein were observed under these conditions (Fig. 5A). 500 nM GW501516 increased thyroid cell number 35–40% compared to untreated thyroid cells over 6 days (Fig. 5B). We also determined the effects of GW501516 on thyroid cells after overexpression or siRNA knockdown of PPARδ. Thyroid cell number (Fig. 5C) and the incorporation of BrdU (unpublished data) were dependent on levels of both PPARδ and GW501516 in this experiment. Thus, synthetic PPARδ agonist, a surrogate for natural PPARδ lipid ligand, augmented proliferation by PPARδ in normal thyroid cells.
Figure 5. PPARδ ligand GW501516 induces proliferation in normal thyroid cells.

(A) Cultures of primary thyroid cells were treated with the synthetic PPARδ agonist GW501516, a surrogate for natural PPARδ lipid ligand. Thyroid cell numbers increased in a dose-dependent manner in response to increasing concentrations of GW501516 (10–500 nM) over 3 days. Immunoblots determined that the expression of PPARδ and β-actin protein was constant under these conditions. (B) GW501516 (500 nM) increased thyroid cell number 35–40% compared to untreated cells over 6 days. (C) 500 nM GW501516 was also added to thyroid cells in which the expression of PPARδ was modulated by overexpression or siRNA. Proliferation of the thyroid cells over 5 days depended on levels of both GW501516 ligand and PPARδ. Values represent the mean of duplicate or triplicate dishes +/− the standard deviation (*p<0.0001).
Expression of native PPARδ is elevated in benign and malignant human thyroid tumors
To further investigate PPARδ in a natural state of increased cell proliferation, we determined PPARδ levels in human thyroid tumors. PPARδ protein was measured by immunohistochemistry on tissue microarrays that contained six classes of thyroid tumors: 18 follicular adenomas, 20 follicular carcinomas, 37 papillary carcinomas, 10 anaplastic carcinomas, 9 Hurthle cell adenomas and 9 Hurthle cell carcinomas. 76 normal thyroid tissues from the same paraffin blocks were used as controls. The expression of PPARδ was quantified as described in Materials and Methods by: (1) manual Reiner scoring (23) and (2) automated computer scanning (ACIS) from the bright field microscope. Calculations from the two methods were consistent (Table 1). PPARδ expression was moderate in the nuclei and low in the cytoplasm of normal thyroid tissues (mean ACIS score 75.19; Table 1; Fig. 6A), whereas PPARδ expression was elevated above normal in follicular adenomas (mean ACIS score 208.44, p<0.0001; Table 1; Fig. 6B), follicular carcinomas (mean ACIS score 221.63, p<0.0001; Table 1), papillary carcinomas (mean ACIS score 394.11, p<0.0001; Table 1; Fig. 6C), anaplastic carcinomas (mean ACIS score 438.60, p<0.0001; Table 1; Fig. 6D), Hurthle cell adenomas (mean ACIS score 352.67, p<0.0001; Table 1) and Hurthle cell carcinomas (mean ACIS score 293.89, p<0.0001; Table 1). PPARδ was increased predominantly in the nuclei of follicular (Fig. 6B) and Hurthle cell (unpublished data) tumors and in both the nuclei and cytoplasm of papillary (Fig. 6C) and anaplastic (Fig. 6D) thyroid carcinomas. Mean expression of Ki67, an in situ marker of cell proliferation, was also elevated (p≤0.0219) in these thyroid tumors (Fig. 6, A–D; Table 1) and correlated (R=0.8571; p=0.02381) with mean expression of PPARδ. Thus, the expression of native PPARδ protein correlated directly with cell proliferation in thyroid tumors in vivo as well as with thyroid cell proliferation in vitro.
Table 1.
Mean expression of PPARδ and Ki67 in normal, benign and malignant thyroid tissues
| Thyroid Tissue Type | N | PPARδ mean ACIS score (p value*) | PPARδ mean Reiner score (p value*) | Ki67 mean % positive nuclei (p value*) |
|---|---|---|---|---|
| Normal | 76 | 75.19 (NA) | 4.26 (NA) | 1.26 (NA) |
| Follicular adenomas | 18 | 208.44 (p<0.0001) | 5.42 (p=0.0002) | 2.02 (p=0.0219) |
| Follicular carcinomas | 20 | 221.63 (p<0.0001) | 4.90 (p=0.0351) | 3.57 (p<0.0001) |
| Papillary carcinomas | 37 | 394.11 (p<0.0001) | 5.93 (p<0.0001) | 4.53 (p<0.0001) |
| Anaplastic carcinomas | 10 | 438.60 (p<0.0001) | 6.00 (p<0.0001) | 31.18 (p<0.0001) |
| Hurthle cell adenomas | 9 | 352.67 (p<0.0001) | 6.06 (p<0.0001) | 4.92 (p<0.0001) |
| Hurthle cell carcinomas | 9 | 293.89 (p<0.0001) | 5.00 (p=0.0714) | 14.98 (p<0.0001) |
p value determined by two-tailed Student’s t test
Figure 6. Expression of native PPARδ is elevated in benign and malignant human thyroid tumors and correlates with cell proliferation.
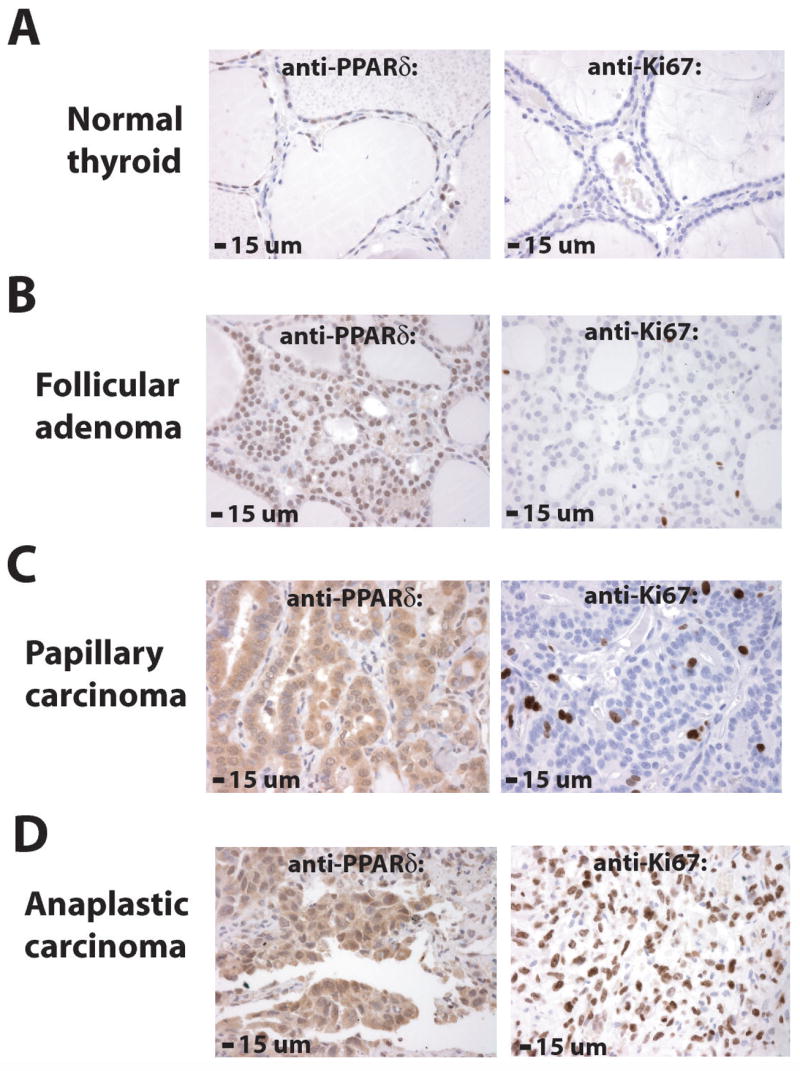
The expression of PPARδ was determined by immunohistochemistry on tissue microarrays that contained six different classes of human thyroid tumors. Normal thyroid tissues from the same paraffin blocks were used as controls. Levels of PPARδ and the proliferation marker Ki67 were quantified as described in Materials and Methods. (A) PPARδ was expressed at moderate levels in the nuclei and low levels in the cytoplasm (mean ACIS score 75.19) of normal thyroid cells. Ki67 was detected in 1.26% of nuclei in normal thyroid cells. (B) PPARδ was expressed at higher than normal levels (mean ACIS score 208.44, p<0.0001) in nuclei of benign thyroid follicular adenomas. Ki67 was detected in 2.02% of nuclei in follicular adenomas (p=0.0219). (C) PPARδ was expressed at higher than normal levels (mean ACIS score 394.11, p<0.0001) in the nuclei and cytoplasm of well-differentiated papillary thyroid carcinomas. Ki67 was detected in 4.53% of nuclei in papillary carcinomas (p<0.0001). (D) PPARδ was expressed at highest levels (mean ACIS score 438.60, p<0.0001) in poorly differentiated anaplastic thyroid carcinomas. Ki67 was detected in 31.18% of nuclei in anaplastic carcinomas (p<0.0001). PPARδ and Ki67 immunoreactivity is brown and the nuclear counterstain is blue (see also Table 1).
Discussion
PPARs are ligand-activated transcription factors that have been studied most thoroughly in lipid metabolism, adipogenesis, obesity, insulin sensitivity and diabetes (1, 2). The PPARs have also been investigated in cancer but their mechanisms in tumorigenesis are not understood. Here, we determine a novel mechanism of PPARδ that induces cell proliferation through cyclin E1 and show that PPARδ is upregulated in many human thyroid tumors.
We demonstrated that the expression of PPARδ is high compared to PPARγ and PPARα in normal human thyroid cells and tissues, as reported recently in the mouse (3). Our engineered overexpression of PPARδ in primary human thyroid cells generated a 40–45% increase in S phase cells in only 2 days. This is a remarkable induction because the usual transit time of primary thyroid cells through the cell cycle is 30–40 hours. The induction of proliferation by PPARδ was augmented by synthetic PPARδ agonist, which was a surrogate for natural PPARδ lipid ligand, and was associated with a 9-fold increase in cyclin E1 protein, a regulator of the epithelial cell cycle (25). Three additional experiments showed that the induction of proliferation by PPARδ was dependent on cyclin E1. First, knockdown of endogenous PPARδ by siRNA led to reductions in both cell proliferation and cyclin E1. Second, knockdown of endogenous cyclin E1 by siRNA abrogated thyroid cell proliferation that was induced by PPARδ. Third, the induction of proliferation by PPARδ was not present in cyclin E1 −/− mouse embryo fibroblasts, in contrast to wild-type mouse embryo fibroblasts or cyclin D1 −/− mouse embryo fibroblasts. These experiments determine a novel PPARδ mechanism that induces cell proliferation through cyclin E1, a hitherto unrecognized pathway of PPARδ-mediated growth control.
Our findings are compatible with the known functions of cyclin E1, which in association with Cdk2, drives cells from G1 into S phase in part by hyper-phosphorylation of Rb (25). In fact, PPARδ protein is expressed early in G1 prior to expression and phosphorylation of Rb in quiescent primary thyroid cells that have been treated with serum and/or growth factors (Fig. 1 and unpublished data). This kinetic pattern further supports the regulation of cyclin E1 by PPARδ, although the exact molecular underpinnings of this regulation remain to be elucidated. Interestingly, PPARδ knockout mice are smaller than wild-type littermate controls and this may reflect a deficiency in cell proliferation in tissues such as fat that are reduced in PPARδ knockout animals (10, 26). We observed that engineered over expression in normal thyroid cells of PPARδ also induced cyclin A2, albeit to a lesser extent than cyclin E1. Cyclin A2, in complex with Cdk2 and Cdk1, promotes passage of cells through the G1/S and G2/M transitions and thus cyclin A2 may modulate the effects of PPARδ on cell proliferation as well (27).
Our findings are consistent with previous reports showing that PPARδ stimulates proliferation in mouse preadipocytes, hepatocellular carcinoma cells, human endothelial cells, and breast, prostate and colon carcinoma cells (28–31), although the mechanisms of PPARδ in these systems were not shown to involve cyclin E1. On the other hand, PPARδ has been reported to inhibit proliferation in keratinocytes and mouse lung cancer cells (32, 33), raising the possibility that cell- or culture-dependent responses to PPARδ may exist. In addition, factors that confound the interpretation of PPAR activities are common and include: (1) the co-expression of multiple endogenous PPAR isoforms, such as PPARδ and PPARγ that have differing effects on cell proliferation and overlapping functions at PPREs (34, 35), (2) the use of immortalized rodent cell lines that have altered growth responses compared to normal human cells, (3) the use of PPAR ligands that exhibit PPAR-independent effects (36, 37), and (4) the use of commercial immunoreagents that cross-react with PPARδ (50 kDa), PPARγ (54 kDa) and/or PPARα (52 kDa) (unpublished data). Herein, our experiments provide a clear determination that PPARδ induces cell proliferation through a novel cyclin E1-dependent mechanism in normal human cells that express predominantly PPARδ.
Our experiments indicate unappreciated functions for PPARδ and cyclin E1 in thyroid physiology and demonstrate that PPARδ is upregulated in many thyroid tumors including papillary carcinoma, the most common thyroid cancer. In fact, all classes of thyroid tumors in our study exhibited elevated mean levels of PPARδ and increased mean expression of Ki67, an in situ marker of cell proliferation. Thus, PPARδ promoted thyroid cell proliferation in vitro and was associated with increased proliferation in thyroid tumors in vivo. Most previous studies have demonstrated increased cyclin E levels in transformed thyroid cells (38) and thyroid carcinoma tissues (39–43). The deregulation of the PPARδ-cyclin E1 signaling axis is likely important in thyroid tumors because: (1) both PPARδ and cyclin E1 control thyroid cell proliferation, (2) cyclin E is rate limiting in the G1-S transition in many cell types (44), (3) deregulated expression of cyclin E induces chromosome instability (45) and (4) the loss of cyclin E in knockout mice confers a resistance to oncogenic transformation (25). Furthermore, the expression of cyclin E is abnormal in some human breast carcinomas (46) and PPARδ ligand has been shown to change the histology and growth rate of breast carcinomas in a mouse tumor model (47). Thus, PPARδ-cyclin E1 signaling may be important in thyroid, breast and other carcinomas.
We identified previously in a subset of thyroid follicular carcinomas a family of mutant PPARγ gene fusions (20, 21). The early expression (20) and biologic activities (21, 48) of the encoded PPARγ fusion proteins are consistent with an important role in the pathogenesis of these thyroid cancers. Interestingly, the PPARγ fusion proteins induce proliferation in primary thyroid cells without an apparent increase in cyclin E1 (unpublished data). In addition, wild-type PPARγ has little ability to stimulate proliferation in normal thyroid cells, in contrast to PPARδ (Figs 3 and 4). These observations suggest that PPARδ and PPARγ exhibit distinct mechanisms in cell proliferation and neoplasia in the thyroid gland, a systemic endocrine regulator of growth and metabolism.
The thyroid has proven to be a valuable model to determine the mechanisms of nuclear receptors and altered signal transduction in epithelial cells and tumors. Here, we have shown that the expression of PPARδ is upregulated in thyroid cells by serum, TSH or EGF mitogenic signals. TSH stimulates both proliferation and differentiation in thyroid cells by activation of cAMP and pKa (24). EGF stimulates proliferation and inhibits differentiation in thyroid cells by activation of MEK/ERK (24). MEK/ERK are activated constitutively by mutations in subsets of follicular adenomas, follicular carcinomas, papillary carcinomas and anaplastic/poorly differentiated thyroid carcinomas (49–52). In fact, 85–90% of papillary carcinomas possess RET, NTRK1, BRAF or RAS mutations that induce MEK/ERK signaling. Our strong correlation between mean PPARδ expression and mean Ki67 expression in these thyroid tumors and normal thyroid cells (R=1; p=0.01667) supports a fundamental mechanistic connection between PPARδ and MEK/ERK signaling (53) that requires additional investigation.
Our experiments support a model in which PPARδ induces cyclin E1 and cell proliferation depending on growth factor and lipid ligands in the local environment. Growth factors upregulate the expression of PPARδ during cell proliferation and PPARδ ligands modulate the proliferation response. This model provides an explanation for the varied effects of PPARδ activation in cell and tumor models -- the requisite growth factor and/or ligand signals that produce a robust PPARδ proliferation response may not be present in each case. Our data also argue that new selective antagonists for PPARδ (54) should be investigated for anti-tumorigenic properties in pre-clinical and perhaps clinical models. The overall findings suggest that a coordinated interplay between PPARδ, PPARγ, lipid ligands and growth factors regulates thyroid cell proliferation and is altered by different PPAR mechanisms in different thyroid carcinomas.
Supplementary Material
Acknowledgments
This work was supported by grant CA75425 from the National Cancer Institute and The Louis Block Fund of the University of Chicago. We thank Drs. Don Steiner, Graham Bell and Sam Refetoff for sharing laboratory equipment and Mr. Pablo Michalewicz for technical assistance.
The abbreviations used are
- PPAR
peroxisome proliferator-activated receptor
- FBS
fetal bovine serum
- RT-PCR
reverse transcription polymerase chain reaction
- CDK
cyclin-dependent kinase
- MAPK
mitogen-activated protein kinase
- ERK
extracellular signal-regulated kinase
- MEK
MAPK/ERK kinase
- TSH
thyroid stimulating hormone
- EGF
epidermal growth factor
- Rb
retinoblastoma protein
- TBS
tris-buffered saline
- BrdU
bromodeoxyuridine
- siRNA
small inhibitory RNA
- ACIS
Automated Cellular Imaging System
Footnotes
This PDF receipt will only be used as the basis for generating PubMed Central (PMC) documents. PMC documents will be made available for review after conversion (approx. 2–3 weeks time). Any corrections that need to be made will be done at that time. No materials will be released to PMC without the approval of an author. Only the PMC documents will appear on PubMed Central -- this PDF Receipt will not appear on PubMed Central.
References
- 1.Evans RM, Barish GD, Wang YX. PPARs and the complex journey to obesity. Nat Med. 2004;10:355–61. doi: 10.1038/nm1025. [DOI] [PubMed] [Google Scholar]
- 2.Rosen ED, Spiegelman BM. PPARgamma : A nuclear regulator of metabolism, differentiation, and cell growth. J Biol Chem. 2001;276:37731–4. doi: 10.1074/jbc.R100034200. [DOI] [PubMed] [Google Scholar]
- 3.Bookout AL, Jeong Y, Downes M, et al. Anatomical profiling of nuclear receptor expression reveals a hierarchical transcriptional network. Cell. 2006;126:789–99. doi: 10.1016/j.cell.2006.06.049. [DOI] [PMC free article] [PubMed] [Google Scholar]
- 4.Issemann I, Prince RA, Tugwood JD, et al. The peroxisome proliferator-activated receptor:Retinoid x receptor heterodimer is activated by fatty acids and fibrate hypolipidaemic drugs. J Mol Endocrinol. 1993;11:37–47. doi: 10.1677/jme.0.0110037. [DOI] [PubMed] [Google Scholar]
- 5.Barish GD, Evans RM. PPARs and LXRs: Atherosclerosis goes nuclear. Trends Endocrinol Metab. 2004;15:158–65. doi: 10.1016/j.tem.2004.03.003. [DOI] [PubMed] [Google Scholar]
- 6.Rosen ED, Spiegelman BM. Molecular regulation of adipogenesis. Annu Rev Cell Dev Biol. 2000;16:145–71. doi: 10.1146/annurev.cellbio.16.1.145. [DOI] [PubMed] [Google Scholar]
- 7.Lehmann JM, Moore LB, Smith-Oliver TA, et al. An antidiabetic thiazolidinedione is a high affinity ligand for peroxisome proliferator-activated receptor gamma (PPARgamma) J Biol Chem. 1995;270:12953–6. doi: 10.1074/jbc.270.22.12953. [DOI] [PubMed] [Google Scholar]
- 8.Tanaka T, Yamamoto J, Iwasaki S, et al. Activation of peroxisome proliferator-activated receptor delta induces fatty acid beta-oxidation in skeletal muscle and attenuates metabolic syndrome. Proc Natl Acad Sci U S A. 2003;100:15924–9. doi: 10.1073/pnas.0306981100. [DOI] [PMC free article] [PubMed] [Google Scholar]
- 9.Schuler M, Ali F, Chambon C, et al. PGC1alpha expression is controlled in skeletal muscles by pparbeta, whose ablation results in fiber-type switching, obesity, and type 2 diabetes. Cell Metab. 2006;4:407–14. doi: 10.1016/j.cmet.2006.10.003. [DOI] [PubMed] [Google Scholar]
- 10.Peters JM, Lee SS, Li W, et al. Growth, adipose, brain, and skin alterations resulting from targeted disruption of the mouse peroxisome proliferator-activated receptor beta(delta) Mol Cell Biol. 2000;20:5119–28. doi: 10.1128/mcb.20.14.5119-5128.2000. [DOI] [PMC free article] [PubMed] [Google Scholar]
- 11.Oliver WR, Jr, Shenk JL, Snaith MR, et al. A selective peroxisome proliferator-activated receptor delta agonist promotes reverse cholesterol transport. Proc Natl Acad Sci U S A. 2001;98:5306–11. doi: 10.1073/pnas.091021198. [DOI] [PMC free article] [PubMed] [Google Scholar]
- 12.Sprecher DL, Massien C, Pearce G, et al. Triglyceride: High-density lipoprotein cholesterol effects in healthy subjects administered a peroxisome proliferator activated receptor delta agonist. Arterioscler Thromb Vasc Biol. 2007;27:359–65. doi: 10.1161/01.ATV.0000252790.70572.0c. [DOI] [PubMed] [Google Scholar]
- 13.Lee SS, Pineau T, Drago J, et al. Targeted disruption of the alpha isoform of the peroxisome proliferator-activated receptor gene in mice results in abolishment of the pleiotropic effects of peroxisome proliferators. Mol Cell Biol. 1995;15:3012–22. doi: 10.1128/mcb.15.6.3012. [DOI] [PMC free article] [PubMed] [Google Scholar]
- 14.Park BH, Vogelstein B, Kinzler KW. Genetic disruption of PPARdelta decreases the tumorigenicity of human colon cancer cells. Proc Natl Acad Sci U S A. 2001;98:2598–603. doi: 10.1073/pnas.051630998. [DOI] [PMC free article] [PubMed] [Google Scholar]
- 15.Harman FS, Nicol CJ, Marin HE, et al. Peroxisome proliferator-activated receptor-delta attenuates colon carcinogenesis. Nat Med. 2004;10:481–3. doi: 10.1038/nm1026. [DOI] [PubMed] [Google Scholar]
- 16.Girnun GD, Smith WM, Drori S, et al. APC-dependent suppression of colon carcinogenesis by ppargamma. Proc Natl Acad Sci U S A. 2002;99:13771–6. doi: 10.1073/pnas.162480299. [DOI] [PMC free article] [PubMed] [Google Scholar]
- 17.Saez E, Tontonoz P, Nelson MC, et al. Activators of the nuclear receptor PPARgamma enhance colon polyp formation. Nat Med. 1998;4:1058–61. doi: 10.1038/2042. [DOI] [PubMed] [Google Scholar]
- 18.Gupta RA, Wang D, Katkuri S, et al. Activation of nuclear hormone receptor peroxisome proliferator-activated receptor-delta accelerates intestinal adenoma growth. Nat Med. 2004;10:245–7. doi: 10.1038/nm993. [DOI] [PubMed] [Google Scholar]
- 19.Sarraf P, Mueller E, Smith WM, et al. Loss-of-function mutations in PPAR gamma associated with human colon cancer. Mol Cell. 1999;3:799–804. doi: 10.1016/s1097-2765(01)80012-5. [DOI] [PubMed] [Google Scholar]
- 20.French CA, Alexander EK, Cibas ES, et al. Genetic and biological subgroups of low-stage follicular thyroid cancer. Am J Pathol. 2003;162:1053–60. doi: 10.1016/S0002-9440(10)63902-8. [DOI] [PMC free article] [PubMed] [Google Scholar]
- 21.Kroll TG, Sarraf P, Pecciarini L, et al. PAX8-PPARγ1 fusion oncogene in human thyroid carcinoma [corrected] Science. 2000;289:1357–60. doi: 10.1126/science.289.5483.1357. [DOI] [PubMed] [Google Scholar]
- 22.Williams DW, Wynford-Thomas D. Human thyroid epithelial cells. Methods Mol Biol. 1997;75:163–72. doi: 10.1385/0-89603-441-0:163. [DOI] [PubMed] [Google Scholar]
- 23.Reiner A, Neumeister B, Spona J, et al. Immunocytochemical localization of estrogen and progesterone receptor and prognosis in human primary breast cancer. Cancer Res. 1990;50:7057–61. [PubMed] [Google Scholar]
- 24.Kimura T, Van Keymeulen A, Golstein J, et al. Regulation of thyroid cell proliferation by TSH and other factors: A critical evaluation of in vitro models. Endocr Rev. 2001;22:631–56. doi: 10.1210/edrv.22.5.0444. [DOI] [PubMed] [Google Scholar]
- 25.Geng Y, Yu Q, Sicinska E, et al. Cyclin E ablation in the mouse. Cell. 2003;114:431–43. doi: 10.1016/s0092-8674(03)00645-7. [DOI] [PubMed] [Google Scholar]
- 26.Barak Y, Liao D, He W, et al. Effects of peroxisome proliferator-activated receptor delta on placentation, adiposity, and colorectal cancer. Proc Natl Acad Sci U S A. 2002;99:303–8. doi: 10.1073/pnas.012610299. [DOI] [PMC free article] [PubMed] [Google Scholar]
- 27.Zhang J, Fu M, Zhu X, et al. Peroxisome proliferator-activated receptor delta is up-regulated during vascular lesion formation and promotes post-confluent cell proliferation in vascular smooth muscle cells. J Biol Chem. 2002;277:11505–12. doi: 10.1074/jbc.M110580200. [DOI] [PubMed] [Google Scholar]
- 28.Wang D, Wang H, Guo Y, et al. Crosstalk between peroxisome proliferator-activated receptor delta and VEGF stimulates cancer progression. Proc Natl Acad Sci U S A. 2006;103:19069–74. doi: 10.1073/pnas.0607948103. [DOI] [PMC free article] [PubMed] [Google Scholar]
- 29.Xu L, Han C, Wu T. A novel positive feedback loop between peroxisome proliferator-activated receptor-delta and prostaglandin E2 signaling pathways for human cholangiocarcinoma cell growth. J Biol Chem. 2006;281:33982–96. doi: 10.1074/jbc.M600135200. [DOI] [PubMed] [Google Scholar]
- 30.Jehl-Pietri C, Bastie C, Gillot I, et al. Peroxisome-proliferator-activated receptor delta mediates the effects of long-chain fatty acids on post-confluent cell proliferation. Biochem J. 2000;350(Pt 1):93–8. [PMC free article] [PubMed] [Google Scholar]
- 31.Hansen JB, Zhang H, Rasmussen TH, et al. Peroxisome proliferator-activated receptor delta (PPARdelta )-mediated regulation of preadipocyte proliferation and gene expression is dependent on camp signaling. J Biol Chem. 2001;276:3175–82. doi: 10.1074/jbc.M005567200. [DOI] [PubMed] [Google Scholar]
- 32.Burdick AD, Bility MT, Girroir EE, et al. Ligand activation of peroxisome proliferator-activated receptor-beta/delta(PPARbeta/delta) inhibits cell growth of human n/tert-1 keratinocytes. Cell Signal. 2007;19:1163–71. doi: 10.1016/j.cellsig.2006.12.007. [DOI] [PMC free article] [PubMed] [Google Scholar]
- 33.Kim DJ, Bility MT, Billin AN, et al. Pparbeta/delta selectively induces differentiation and inhibits cell proliferation. Cell Death Differ. 2006;13:53–60. doi: 10.1038/sj.cdd.4401713. [DOI] [PubMed] [Google Scholar]
- 34.Sabatino L, Casamassimi A, Peluso G, et al. A novel peroxisome proliferator-activated receptor gamma isoform with dominant negative activity generated by alternative splicing. J Biol Chem. 2005;280:26517–25. doi: 10.1074/jbc.M502716200. [DOI] [PubMed] [Google Scholar]
- 35.Shi Y, Hon M, Evans RM. The peroxisome proliferator-activated receptor delta, an integrator of transcriptional repression and nuclear receptor signaling. Proc Natl Acad Sci U S A. 2002;99:2613–8. doi: 10.1073/pnas.052707099. [DOI] [PMC free article] [PubMed] [Google Scholar]
- 36.Palakurthi SS, Aktas H, Grubissich LM, et al. Anticancer effects of thiazolidinediones are independent of peroxisome proliferator-activated receptor gamma and mediated by inhibition of translation initiation. Cancer Res. 2001;61:6213–8. [PubMed] [Google Scholar]
- 37.Baek SJ, Wilson LC, Hsi LC, et al. Troglitazone, a peroxisome proliferator-activated receptor gamma (PPAR gamma ) ligand, selectively induces the early growth response-1 gene independently of PPAR gamma. A novel mechanism for its anti-tumorigenic activity. J Biol Chem. 2003;278:5845–53. doi: 10.1074/jbc.M208394200. [DOI] [PubMed] [Google Scholar]
- 38.Lazzereschi D, Sambuco L, Carnovale Scalzo C, et al. Cyclin D1 and cyclin E expression in malignant thyroid cells and in human thyroid carcinomas. Int J Cancer. 1998;76:806–11. doi: 10.1002/(sici)1097-0215(19980610)76:6<806::aid-ijc7>3.0.co;2-1. [DOI] [PubMed] [Google Scholar]
- 39.Pickett CA, Agoff SN, Widman TJ, et al. Altered expression of cyclins and cell cycle inhibitors in papillary thyroid cancer: Prognostic implications. Thyroid. 2005;15:461–73. doi: 10.1089/thy.2005.15.461. [DOI] [PubMed] [Google Scholar]
- 40.Brzezinski J, Migodzinski A, Toczek A, et al. Patterns of cyclin e, retinoblastoma protein, and p21cip1/waf1 immunostaining in the oncogenesis of papillary thyroid carcinoma. Clin Cancer Res. 2005;11:1037–43. [PubMed] [Google Scholar]
- 41.Brzezinski J, Migodzinski A, Gosek A, et al. Cyclin E expression in papillary thyroid carcinoma: Relation to staging. Int J Cancer. 2004;109:102–5. doi: 10.1002/ijc.11673. [DOI] [PubMed] [Google Scholar]
- 42.Melck A, Masoudi H, Griffith OL, et al. Cell cycle regulators show diagnostic and prognostic utility for differentiated thyroid cancer. Ann Surg Oncol. 2007;14:3403–11. doi: 10.1245/s10434-007-9572-8. [DOI] [PubMed] [Google Scholar]
- 43.Wiseman SM, Masoudi H, Niblock P, et al. Anaplastic thyroid carcinoma: Expression profile of targets for therapy offers new insights for disease treatment. Ann Surg Oncol. 2007;14:719–29. doi: 10.1245/s10434-006-9178-6. [DOI] [PubMed] [Google Scholar]
- 44.Duronio RJ, O’Farrell PH. Developmental control of the G1 to S transition in drosophila: Cyclin E is a limiting downstream target of E2f. Genes Dev. 1995;9:1456–68. doi: 10.1101/gad.9.12.1456. [DOI] [PubMed] [Google Scholar]
- 45.Spruck CH, Won KA, Reed SI. Deregulated cyclin E induces chromosome instability. Nature. 1999;401:297–300. doi: 10.1038/45836. [DOI] [PubMed] [Google Scholar]
- 46.Keyomarsi K, Tucker SL, Buchholz TA, et al. Cyclin E and survival in patients with breast cancer. N Engl J Med. 2002;347:1566–75. doi: 10.1056/NEJMoa021153. [DOI] [PubMed] [Google Scholar]
- 47.Yin Y, Russell RG, Dettin LE, et al. Peroxisome proliferator-activated receptor delta and gamma agonists differentially alter tumor differentiation and progression during mammary carcinogenesis. Cancer Res. 2005;65:3950–7. doi: 10.1158/0008-5472.CAN-04-3990. [DOI] [PubMed] [Google Scholar]
- 48.Powell J, Wang X, Allard B, et al. The PAX8/PPARγ fusion oncoprotein transforms immortalized human thyrocytes through a mechanism probably involving wild-type PPARγ inhibition. Oncogene. 2004;23:3634–41. doi: 10.1038/sj.onc.1207399. [DOI] [PubMed] [Google Scholar]
- 49.Zhu Z, Gandhi M, Nikiforova MN, et al. Molecular profile and clinical-pathologic features of the follicular variant of papillary thyroid carcinoma. An unusually high prevalence of RAS mutations. Am J Clin Pathol. 2003;120:71–7. doi: 10.1309/ND8D-9LAJ-TRCT-G6QD. [DOI] [PubMed] [Google Scholar]
- 50.Santoro M, Carlomagno F, Hay ID, et al. Ret oncogene activation in human thyroid neoplasms is restricted to the papillary cancer subtype. J Clin Invest. 1992;89:1517–22. doi: 10.1172/JCI115743. [DOI] [PMC free article] [PubMed] [Google Scholar]
- 51.Kimura ET, Nikiforova MN, Zhu Z, et al. High prevalence of BRAF mutations in thyroid cancer: Genetic evidence for constitutive activation of the ret/ptc-ras-braf signaling pathway in papillary thyroid carcinoma. Cancer Res. 2003;63:1454–7. [PubMed] [Google Scholar]
- 52.Bongarzone I, Pierotti MA, Monzini N, et al. High frequency of activation of tyrosine kinase oncogenes in human papillary thyroid carcinoma. Oncogene. 1989;4:1457–62. [PubMed] [Google Scholar]
- 53.Shao J, Sheng H, DuBois RN. Peroxisome proliferator-activated receptors modulate k-ras-mediated transformation of intestinal epithelial cells. Cancer Res. 2002;62:3282–8. [PubMed] [Google Scholar]
- 54.Shearer BG, Steger DJ, Way JM, et al. Identification and characterization of a selective peroxisome proliferator-activated receptor {beta}/{delta} (NR1C2) antagonist. Mol Endocrinol. 2008;22:523–9. doi: 10.1210/me.2007-0190. [DOI] [PMC free article] [PubMed] [Google Scholar]
Associated Data
This section collects any data citations, data availability statements, or supplementary materials included in this article.