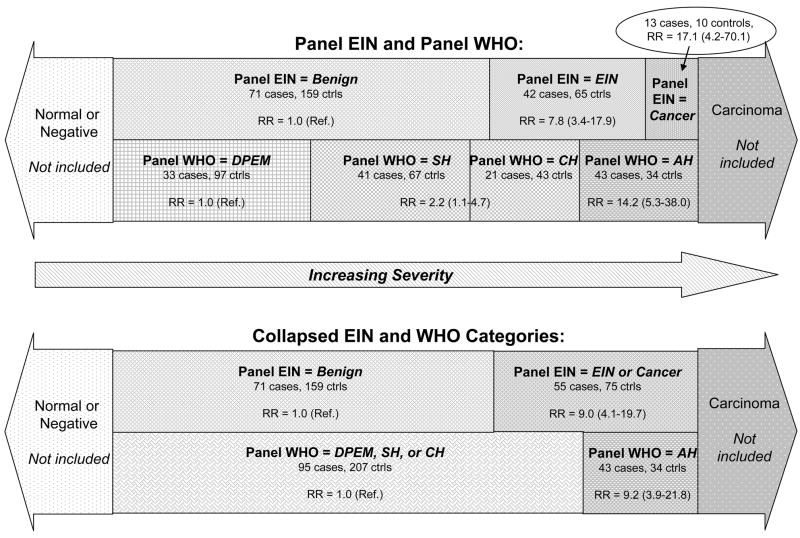
Figure 1. Schematic comparison of progression risks for EIN and WHO.
RR, relative risk; see table 3. The area of the categories is proportional to the total number of cases and controls in each category, relative to the 138 eligible cases and 241 eligible controls.

