

Abstract
PERK-eIF2α signaling, a component of the ER stress response, has been proposed as a therapeutic target due to its importance to cell survival in hypoxic tumors. In this study, we show that in addition to promoting survival, PERK can also suppress tumor growth of advanced carcinomas. Our results show that in squamous carcinoma T-HEp3 cells, which display low PERK-eIF2α signaling, inducible activation of an Fv2E-PERK fusion protein results in a strong G0/G1 arrest in vitro. Most importantly, Fv2E-PERK activation, in addition to promoting survival in vitro, inhibits T-HEp3 and SW620 colon carcinoma growth in vivo. Increased PERK activation is linked to enhanced p-eIF2α levels, translational repression and a decrease in Ki67, pH3 and cycD1/D3 levels but not to changes in angiogenesis or apoptosis. Experimental reduction of PERK activity, or overexpression of GADD34 in a spontaneously arising in vivo quiescent variant of HEp3 cells that displays strong basal PERK-eIF2α activation reverts their quiescent phenotype. We conclude that the growth inhibitory function of PERK is preserved in tumors and upon proper re-activation can severely inhibit tumor growth through induction of quiescence. This is an important consideration in the development of PERK-based therapies, as its inhibition may facilitate the proliferation of slow-cycling or dormant tumor cells.
Keywords: PERK, dormancy, growth arrest, translation, eIF2α
INTRODUCTION
An important function of the ER resident kinase PERK is to attenuate cellular protein synthesis during the unfolded protein response via phosphorylation of the α subunit of the translation initiation factor eIF2 at Ser 51. eIF2 mediates the binding of the initiator tRNA (tRNAiMet) to the 40S ribosome during translation initiation (1). The phosphorylation of eIF2α converts it from a substrate to an inhibitor of eIF2B, its GTP exchange factor. Since the amount of eIF2B is stoichiometrically lower than eIF2α, the phosphorylation of a small pool of eIF2α is sufficient to abrogate protein synthesis (2),which allows cells to remedy the accumulation of misfolded proteins (3–6). In NIH3T3 fibroblasts and other “normal” cells this is accomplished by PERK dependent (i) activation of a stress induced check-point resulting from the repression of cyclin D1 synthesis (7) and subsequent G0/G1 arrest and (ii) translational upregulation of the transcription factor ATF4, which induces genes that promote survival and adaptation to cellular stress (8, 9). Thus activation of PERK-eIF2α pathway promotes both G0/G1 arrest and cell survival (7, 10). However, persistent phosphorylation of eIF2α following strong chronic ER stress can also result in apoptosis (11).
Recently, PERK activity has been shown to promote tumor growth (12). Studies on SV40 immortalized and KiRasV12 transformed PERK MEFs (PERK+/+ or PERK−/−), and HT29 colorectal carcinoma cells expressing dominant negative PERKΔC, showed that this pathway allows tumor cells to survive in a hypoxic environment in vivo. This was due to PERK dependent translational induction of pro-angiogenic genes (13) as transformed cells lacking PERK or eIF2α signaling (PERK−/−, eIF2αS51A cells), were poorly vascularized. These studies demonstrate that tumor cells can use the cytoprotective functions of PERK to support tumor growth. Other studies however, indicate that PERK may have tumor suppressive functions. For instance PERK inhibition results in deregulated mammary acinar morphogenesis and hyperplastic growth in vivo (14). Further, ATF4 and other ER stress activated factors mediate H-Ras driven senescence, in normal melanocytes (15). Finally, expression of a non-phosphorylatable mutant of eIF2α, or dominant negative PKR, results in tumorigenesis of murine and human fibroblasts (16, 17). The above findings imply that activation of the PERK-eIF2α pathway could have a complex role in tumor cells; it can inhibit the cell cycle while inducing cell survival. The growth arrest function that is operational in normal cells may be especially relevant to tumors since, a large proportion of tumor cells within a primary tumor as well as solitary disseminated tumor cells can be dividing slowly or be in a growth arrested dormant/quiescent state(18–20).
We have shown that prolonged passaging in culture of highly tumorigenic human squamous carcinoma T-HEp3 cells, results in the non-clonal loss of malignancy and the acquisition of a protracted dormant/quiescent phenotype upon re-inoculation in vivo (21, 22). These cells are designated D-HEp3 and display a low ERK/p38 activity ratio in vitro, which is reversed in T-HEp3 cells (21). While the ERK/p38 ratio does not affect the rate of proliferation of these cells in vitro, the ratio predicts tumorigenicity or dormancy/quiescence in vivo (21). Furthermore, the high p38 activity in the D-HEp3 cells is responsible for increased BiP/Grp78 chaperone expression and enhanced PERK activation. These changes promote resistance to low glucose, ER-stressors and chemotherapeutic drug-induced apoptosis (23). In contrast, in T-HEp3 cells, the low p38 activity is associated with low levels of BiP/Grp78 expression, PERK activation and low stress tolerance (23). However, whether the differential activation of PERK in these HEp3 cell variants is a bystander of the ER stress status or a functional component of their growth capacity (i.e. dormant/quiescent vs. tumorigenic) was unknown. The possibility that PERK might promote survival but also contribute to D-HEp3 cell quiescence made this model amenable to study how modulation of PERK signaling might regulate these distinct cellular responses in tumor cells.
Here we show that the high basal PERK-eIF2α pathway activation in D-HEp3 cells while signaling for survival is also functionally linked to their loss of tumorigenicity. Furthermore, we show that activation of PERK and eIF2α signaling in highly malignant squamous T-HEp3 or SW620 colorectal carcinoma cells, through a dimerizable system or through pharmacological intervention, induces not only survival but also tumor growth suppression both in vitro and in vivo. This occurs by the activation of a G0–G1 arrest program similar to the one observed in D-HEp3 cells.
Materials and Methods
Reagents and antibodies
AP20187 was a gift from Ariad Pharmaceuticals (Cambridge, MA). Salubrinal and SB203580 were from Calbiochem (Beverly, MA). The following antibodies were from Cell Signaling (Danvers, MA); rabbit anti-p- eIF2 α (Ser51) and total eIF2α, anti-p-PERK (Thr980), anti-p- and total GCN2, anti-p- and total PKR, anti p53, anti p21, anti-cleaved caspase-3, anti cdk4, anti-phospho histone 3 and mouse anti cyclin D3 and D1. Rabbit anti- cyclin A, anti p-PERK and total PERK (H-300), antibodies were from Santa Cruz (Santa Cruz, CA). Anti p- and total p38 mAbs were from BD Biosciences (San Diego, CA). Rabbit anti-FKBP12 was from Affinity Bioreagents (Golden, CO). Rabbit anti-IgG1 and mouse anti-FLAG (M2) antibodies and tunicamycin were from Sigma (St. Louis, MO). Anti- GADPH was from Ambion (Austin, TX). HRP conjugated anti-mouse IgG Ab and anti-rabbit IgG Ab was from Vector Laboratories (Burlingame, CA) and Chemicon International respectively.
Cell culture and generation of stable cell lines
Tumorigenic (T-HEp3) and “spontaneous” dormant (D-HEp3) human epidermoid carcinoma HEp3 cell (21), and SW620 cell lines were described previously (24). T-HEp3, D-HEp3 and SW620 cells were transduced with pBABE retrovirus encoding either β-galactosidase or Fv2E-ΔN PERK (Fv2E-PERK) as previously described (14). D-HEp3 cells were also transdcued with pSHAG-MAGIC retrovirus encoding shRNAs targeting luciferase or PERK mRNAs (shPERK #1 – 5′-GACCTTAACTGATGTAAGA 3′ shPERK #2- 5′-CACTTTGAACTTCGGTATA 3′) or an empty vector control respectively. Pools of cells stably expressing the transgene or shRNA were then selected using 2.5μg/ml of puromycin. Transient transfection of pFLAG-CMV-2-GADD34, and pcDNA3.1Hygro plasmids were performed as described previously (14, 23). Proliferation and viability studies were performed as described previously (14, 23). For in vitro use, a 1-μM ethanol stock of AP20187 was diluted in complete culture medium immediately before use. The final concentration of ethanol in the culture medium was less than 0.1%.
Growth of tumor cells in chick embryo and in nude mice
Cells were grown on the CAM and nude mice as described previously (21). Cells were detached with 2mM EDTA in PBS washed and 2×10⁵–5×10⁵ cells were inoculated on the chorioallantoic membrane of 9–10 day old chick embryos (Charles River, Willmington NC). One week post-inoculation the tumor nodules were excised, minced, digested with collagenase and the number of tumor cells per nodule was counted. For inoculation in nude mice the cells were pretreated for 24h with vehicle alone or 1nM AP20187 and 2×10⁵ cells were injected subcutaneously into the interscapular region of 8–10 week old BALB/c nu/nu mice (Taconic Farms, Germantown, NY). The mice were given a daily injection of AP20187 intraperitoneally at a dose of 5mg/kg. For in vivo use, peritoneal injections were prepared from the 50 mg/ml ethanol stock diluted to 1.25 mg/ml in an injection solution consisting of 4% ethanol, 10% PEG-400, and 1.7% Tween in water. All injections were administered to mice within 30 min of dilution into the injection solution. When the tumors reached ~ 1 cm3 the mice were euthanized.
FACS analysis
In order to assess cell proliferation in vitro cells were incubated with 10μM BrdU for 30 mins and the incorporated BrdU was detected using BrdU flow kit (BD Pharmingen) following manufacturer’s protocol. Fluorescence was quantified using an LSRII (BD Pharmingen) flow cytometer as described (14, 23).
Metabolic labeling and polysome gradients
Protein synthesis, was measured using 35S-methinoine incorporation and polysome gradient analysis as previously described (14).
Immunoblotting
Cells were washed with PBS and lysed in RIPA containing protease and phosphatase inhibitors and were then analyzed by WB as described previously (14, 23).
RT-PCR analysis
GADD153 and GADD34 mRNA levels was analyzed using 1–2μg of total RNA isolated from HEp3 cells (Trizol reagent, Invitrogen) using the Retroscript two-step RT-PCR kit from Ambion according to manufacturer’s instructions. GAPDH was used as loading control. Primer sequences for GADD153 were previously published (14).The following primers were used to amplify GADD34; GADD34 (F) 5′-GGCTGGTGGAAGCAGTAAAAGG 3′; GADD34 (R) 5′-TTATCAGAAGGCTGGGAGACAGG 3′.
Immunohistochemistry
HEp3 tumors grown on CAM were excised 7 days post-inoculation and frozen and embedded in OCT compound embedding medium. For each frozen tumor 8.0 μm sections were cut using a cryostat and fixed in 100% ethanol, hydrated overnight and processed for Ki67, phospho histone 3 (pH3), caspase 3 and cyclin D1 staining. Briefly, the slides were rinsed in PBS and permeabilized for 10 mins with 0.5% Triton-X 100. The slides were then rinsed and incubated in 3% hydrogen peroxide for 20 mins to block endogenous peroxidases and blocked for 1h with normal goat serum in PBS. They were then incubated overnight at 4°C with anti-Ki67 (1:200), anti-pH3 (1:100) cycD1 (1:100) or caspase-3 (1:50) antibody or a normal IgG control followed with a biotinylated secondary antibody (Vectastain Elite ABC Kit) for 1 hour at RT and detected using Vectastain ABC Kit following vendor’s protocol. The peroxidase activity was developed by diaminobenzidine and nuclei were counterstained with Hematoxilin.
RESULTS
Divergent in vivo behavior of HEp3 squamous carcinoma cells differing in PERK-eIF2α signaling levels
We previously reported that D-HEp3 cells display an UPR characterized by increased chaperone expression (e.g., BiP, PDI, HSP47 and cyclophilin B) and XBP-1 splicing (23). Basal levels of p-PERK and p-eIF2α in D-HEp3 cells were higher than in T-HEp3 cells (Fig 1A & B and (23)), and were enhanced by tunicamycin treatment (Fig 1A). We next determined whether other eIF2α kinases were differentially regulated in D- vs. T-HEp3 cells. Western blot analysis indicated that neither GCN2 [amino acid deprivation sensor (25)] nor PKR [double stranded RNA sensor (26)] were differentially phosphorylated in these tumor cells (Fig 1C), suggesting a correlation between p-PERK and p-eIF2α levels in D- vs. T-HEp3 cells. Analysis of in vitro protein synthesis revealed that T-HEp3 cells have elevated levels of polysomes relative to D-HEp3 cells (Fig 1D). Thus the high levels of PERK-eIF2α signaling and reduced translation initiation in the D-HEp3 cells may be linked to their in vivo quiescent phenotype and to an unexpected growth inhibitory function in tumor cells.
Fig 1. Analysis of basal levels of PERK and eIF2α phosphorylation and translation initiation.

(A) T- and D-HEp3 cells were treated for the indicated time points with 5μg/ml tunicamycin and analyzed by WB for phospho-Thr-980-PERK (upper panel) and for phosph-Ser-51- eIF2α (lower panel). Total PERK, and total eIF2α levels served as respective loading controls. The numbers on bottom of each lane indicate the normalized p-PERK/PERK and p-eIF2α/eIF2α O.D. for each band. (B) The graph represents the mean fold-change and S.E (n=3) in normalized p-PERK and p-eIF2α levels relative to D-HEp3 cells. (C) WB analysis of lysates from the indicated cells for p-GCN2 (top panel) and p-PKR (bottom panel). Total GCN2 and total PKR were used as loading control. (D) Polysome gradient analysis of T- and D-HEp3 cytoplasmic lysates fractionated by sucrose density ultracentrifugation. The position of the free mRNA and the polysome (PS) and monosome (MS) peaks are indicated. The increase in the MS peak and a decrease in the PS peak in D-HEp3 cells relative to T-HEp3 cells are indicative of translation attenuation.
Inducible activation of PERK in malignant T-HEp3 cells causes growth arrest and survival but not apoptosis in vitro
To determine whether increasing PERK activity in T-HEp3 cells could mimic the quiescent phenotype of D-HEp3 cells, we expressed an Fv2E-ΔNPERK construct (Fv2E-PERK), where the Fv2E dimerization domain is fused to the cytoplasmic kinase domain of PERK (27). Since it lacks the ER luminal domain, Fv2E-PERK does not respond to ER stress but can only be activated in the presence of the dimerizing drug AP20187. This allowed us to test the effect of PERK-signaling independently of other ER stress pathways (i.e. XBP-1, ATF6, GCN2). Treatment of T- Fv2E-PERK cells with AP20187 (1nM) resulted in the activation of Fv2E-PERK as detected using anti p-PERK antibody (Fig 2A upper panel) or anti-FKBP antibody, which detects both the hypo- and hyperphosphorylated forms of Fv2E-PERK (Fig 2A lower panel). While the levels of hyperphosphorylated Fv2E-PERK remain constant throughout the course of the treatment (Fig 2A lower panel), the levels of p-PERK (Thr 980), which is one measure of active PERK increases in a time dependent manner (Fig 2A upper panel). The difference in the phosphorylation status of Fv2E-PERK as measured with anti-Thr-980 and anti-FKBP antibody may be attributed to the phosphorylation of other residues on PERK (28, 29). Phosphorylation of endogenous eIF2α was detected as early as 2h and was sustained for up to 8h (Fig 2B upper panel). By 24h it was completely abolished despite persistent PERK activation. The downstream target genes CHOP (transcription factor) and GADD34 (regulatory subunit of the eIF2α phosphatase PP1C), were induced within 2h following drug treatment (Fig 2B lower panel) and the decrease in p-eIF2α levels at 24h may be due to enhanced phosphatase activity as it correlated with increased GADD34 mRNA levels. Treatment with AP20187 had no effect on pathway activation in vector (β-gal) control cells (Fig 2A and B and data not shown). Similar to the high PERK signaling in D-HEp3 cells, Fv2E-PERK activation in T-HEp3 cells also conferred resistance to glucose deprivation (23) (SFig 1A). Additionally within 2h following Fv2E-PERK activation in T-HEp3 cells there was a significant decrease in protein synthesis as measured by 35S-methionine incorporation into newly synthesized proteins (Fig 2C). These results show that Fv2E-PERK activates a pathway and cellular responses similar to that of endogenous PERK.
Fig 2. Inducible activation of Fv2E-PERK in T-HEp3 cells.
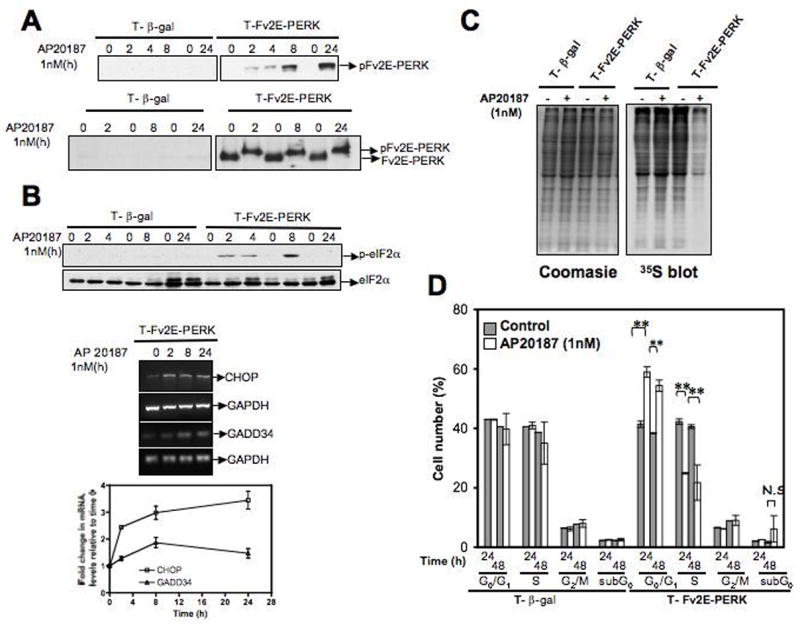
(A) Immunoblot of time dependent activation of Fv2E-PERK following treatment with 1nM AP20187 (AP) was measured using an anti-p-PERK (Thr 980) Ab that is specific for mouse as Fv2E-PERK is derived from mouse origin (upper panel) and an anti-FKBP Ab that detects both the active phosphorylated and inactive hypophosphorylated Fv2E-PERK (lower panel). (B). Lysates and RNA of T-HEp3 cells expressing Fv2E-PERK or β-gal respectively treated with AP (1nM) for the indicated times were analyzed by western blot for p-eIF2α levels (upper panel), and by RT-PCR for its downstream targets CHOP and GADD34 (middle panel). Total eF2α protein and GAPDH mRNA levels were used as loading controls. The average and S.E of CHOP and GADD34 mRNA levels normalized to GAPDH at each time point were quantified and expressed as fold-change relative to time 0 (lower panel). (C) Autoradiogram of 35S-methionine incorporation (right panel) into newly synthesized proteins in Fv2E-PERK or β-gal expressing T-HEp3 cells that had been left untreated or treated with 1nM AP20187 for 2h. Coomasie blue staining of the same gel indicates equal loading (left panel). (D) Cell cycle analysis of T-HEp3 cells expressing Fv2E-PERK or β-gal following treatment with 1nM AP20187 for the indicated time points. DNA synthesis was assayed by incorporation of BrdU and cell cycle was analyzed by uptake of 7AAD and assayed by flow cytometry. Percent of cells in the different phases were calculated using BDFacs Diva software, excluding aggregates. Data points represent mean ± S.D of three independent experiments done in duplicate. ** Indicates p< 0.001 as determined by paired student t-test.
We found that activation of Fv2E-PERK caused a significant reduction in tumor cell proliferation as revealed by a decrease in cells in S-phase and a corresponding increase in cells in G0/G1 24h to 48h following AP20187 treatment. Importantly, there was no significant increase in sub-G0/apoptotic phase (Fig 2D), suggesting that Fv2E-PERK activation does not induce general cellular toxicity in this system. Treatment with higher AP20187 concentrations (4–10nM and 1–4μM) also resulted in growth arrest with no effect on apoptosis (SFig 1B & data not shown). However, the growth arrest was reversible as early as 24 hrs following washout of the drug (data not shown), suggesting that continuous treatment with AP20187 maybe required to maintain Fv2E-PERK activation and a prolonged arrest. Accordingly, we found that a daily treatment with 1nM AP20187 was able to sustain growth arrest for up to 5 days in vitro without any effect on cell viability (data not shown). We conclude that activation of the PERK-eIF2α pathway in the T-HEp3 cells results in concomitant growth arrest and survival programs, but not apoptosis.
Inducible activation of PERK suppresses tumor growth of T-HEp3 cells
The above findings reveal that the growth inhibitory function of PERK in normal cells can also be invoked in tumor cells. Thus, we next tested whether the Fv2E-PERK mediated growth arrest in vitro would also result in reduced tumor growth in vivo. To test this, Fv2E-PERK expressing cells, which were pretreated in culture with 1nM AP20187 for 24h were inoculated s.c. in nude mice (0.2×10⁶ cells) and treated once daily i.p with vehicle alone or with AP20187 (5mg/kg) for up to 40 days. Vehicle treated mice developed palpable tumors ~10 days post-inoculation and went on to form rapidly growing tumor masses that reached ~1000mm3 (Fig 3A). In striking contrast, and as predicted from our in vitro experiments, mice treated with AP20187 did not develop tumors throughout the course of the treatment (Fig 3A). Tumor growth in mice injected with T-β-Gal cells was unaffected by AP20187 treatment at the same doses (SFig 1C). We next tested whether the tumor growth inhibition by 5mg/kg of AP20187 for 16 or 20 days was reversible. Interruption of AP20187 treatment did not result in tumor growth, despite the fact that viable tumor cells were still present (as measured by Trypan blue, data not shown) in 37.5% (n=8) of the mice in which we could find residual lesions after examining the inoculum site. These residual T-Fv2E-PERK cells (See methods) failed to proliferate in culture (data not shown). This suggests that this level of PERK activation in T-HEp3 cells induces a context-dependent (in vivo) irreversible growth arrest. In experiments where lower doses (3mg/kg) of AP20187 were used some tumors were able to resume growth after a latency of 30 days, suggesting that it is a dose dependent effect (data not shown).
Fig 3. Activation of Fv2E-PERK inhibits tumor growth in vivo.

(A) T-Fv2E-PERK cells pretreated with 1nM AP20187 for 24h and 0.2×10⁶ cells were inoculated subcutaneously into the interscapular region as described in methods. Post-inoculation the mice were injected daily i.p with AP20187 (5mg/kg) and monitored every other day for tumor take. When tumors were detected, tumor diameter was measured and the volume calculated and plotted as described in methods. (B) Upper Panel- T- β-gal or T-Fv2E-PERK cells (0.2×10⁶ cells/CAM) were inoculated on CAMs in the presence of AP20187 or vehicle alone. The cells were treated daily with AP20187 and seven days post-inoculation, tumors were excised and the number of tumor cells/nodule counted. Lower Panel- T-Fv2E-PERK cells were inoculated on CAM and two days post-inoculation cells were treated with either vehicle alone or with AP20187 at the indicated dose for 5 days. Seven days post-inoculation tumors were excised and quantified as above. The line represents the median. p<0.05, Mann-Whitney test. (C) Lysates of T-Fv2E-PERK cells treated with or without 1nM AP20187 for 24h were immunoblotted for cycD1, cycD3 and cdk4 (upper panel) and cycA (lower panel). GAPDH was used as loading control. (D) Tumor nodules from Fv2E-PERK expressing cells treated with or without AP20187 were excised 7 days post-inoculation and fixed and prepared for histological examination (See methods). Tumor sections from control (D-a) and AP20187 treated (D-c) CAMs were stained with the proliferation marker Ki67. Tumor cells can be distinguished from the chicken CAM cells by their size and large nuclei (arrowheads); arrows points to brown staining of the nuclei generated by the Ki67 detection. (D b-d) Staining of tumor sections with another proliferation marker phospo-Histone3 (pH3, arrow- brown nuclear stain). Note the varying intensity of the Ki67 and pH3 staining in the control tumors and the lack of staining in the AP20187 treated tumors. (D-e) T-Fv2E-PERK derived tumor sections stained with a isotype matched IgG; open arrow points to the lack of staining in the nuclei and a light background staining of the cytoplasm. Scale bar 40μm.
To better understand how PERK re-activation might affect early steps of tumor cell proliferation in vivo we took advantage of the chicken embryo chorioallantoic membrane (CAM) system, which allows us to quantify tumor cell proliferation in vivo during the first week of tumor growth (30). Moreover, since the chicken embryo CAM is highly vascularized (30), early tumor growth is not completely dependent on neovascularization. T-β-gal and T-Fv2E-PERK expressing cells were inoculated in vivo on the CAMs of embryonic day 9 or day 10 chicken embryos with or without 0.005mg/kg AP20187, which is the lowest dose suggested for in vivo use. The treatment was continued daily for the next seven days. We found that the vehicle treated cells formed large tumors and underwent 5–7 cell divisions in 7 days similar to the parental T-HEp3 cells. In contrast, treatment with AP20187 resulted in a 3-fold decrease in the number of T- Fv2E-PERK tumor cells per nodule (Fig 3B upper panel) while T-β-gal cells were unaffected by the treatment. Alternatively enhancement of p-eIF2α levels using a pharmacologic inhibitor (Salubrinal) of GADD34 also resulted in a significant suppression of T-HEp3 tumor growth (SFig 3). Together these results suggest that PERK activation in T-HEp3 cells suppresses tumor growth, which is more likely associated with a growth arrest as revealed by the in vitro studies.
We next investigated whether activating PERK signaling in already proliferating tumor cells in vivo is sufficient to inhibit tumor growth. T-Fv2E-PERK cells were inoculated on CAM and two days post-inoculation, a time point at which cells are actively proliferating (31), they were treated daily for five days with 0.010mg/kg of AP20187. This treatment was also able to suppress the tumor growth by 2–3-fold (Fig 3B lower panel). In nude mice inoculated with T-Fv2E-PERK cells, starting the treatment with AP20187 (5mg/kg) when mice already had palpable tumor nodules, also resulted in extended latency, reduced growth rate or even complete suppression of tumor growth (Supplementary Results, SFig 1E & F). A single pre-treatment of T-Fv2E-PERK cells with AP20187 in vitro was also sufficient to delay tumor cell proliferation in vivo (SFig 1D). The above results suggest that enhancement of PERK-eIF2α signaling can suppress tumor growth even of already growing T-HEp3 tumors.
SW620 cells, a highly tumorigenic and metastatic cell line (32, 33) also display low levels of p-eIF2α when compared to D-HEp3 cells (Fig 4A left panel). Activation of Fv2E-PERK in these cells also resulted in an increase in p-eIF2α levels (Fig 4A & B) and a 3-fold decrease in tumor growth as compared to vector control cells (Fig 4D). These results strongly suggest that activation of PERK causing inhibition of tumor growth is not limited to T-HEp3 cells but is also observed in other tumor cells.
Fig 4. Activation of Fv2E-PERK inhibits tumor growth of SW620 colon carcinoma cells.

(A) WB analysis of D-HEp3 and SW620 lysates for p- and total eIF2α respectively (left panel). Vehicle and AP20187 (1nM) treated lysates of SW620 cells expressing β-gal or Fv2E-PERK respectively were analyzed for active phosphorylated and inactive hypo-phosphorylated Fv2E-PERK and p-eIF2α levels respectively. Total eIF2α was used as a loading control (right panel). (B) T-Fv2E-PERK and SW-Fv2E-PERK cells treated with or without AP20187 were analyzed for p- and total-eIF2α levels by WB. (C) SW-Fv2E-PERK cells were treated with AP20187 for the indicated time points and analyzed by WB for cyclin D1 levels. GAPH was used as loading control. (D) SW620 cells expressing β-gal or Fv2E-PERK were inoculated on CAM at 0.5×10⁶cells/CAM and treated daily with vehicle alone or with 0.005mg/kg of AP20187. Tumors were excised 7 days later and the number of tumor cells/nodule was determined as before. P<0.05 as determined by Mann-Whitney test.
Fv2E-PERK mediated growth suppression in T-HEp3 cells is due to decreased proliferation and not enhanced apoptosis
PERK activation was shown to promote growth arrest of normal cells by specifically inhibiting cyclin D1 synthesis (7, 10). Thus, we measured cyclin D1 levels in T-Fv2E-PERK cells following AP20187 treatment in vitro. Within 2h following PERK activation there was a significant decrease in the cycD1 protein levels that was sustained up to 24h. The levels of other cell cycle regulators cycD3, cdk4, cdk6 and cycA, were also concomitantly downregulated following PERK activation (Fig 3C, SFig 2A and data not shown). This inhibition appeared to be specific as other cell cycle regulators such as p53 and p21 were unaffected by PERK activation (SFig 2A and data not shown). Also the levels of phospho-or total-p38 and ERK were unaffected following PERK activation (SFig 2A), suggesting that a PERK mediated inhibition of these cyclins and CDKs is independent of these pathways. A similar decrease in cyclin D1 levels was also observed in SW-Fv2E-PERK cells at 24 hrs (Fig 4C). We cannot rule out the possibility that additional mechanisms involving the regulation of cdk2 activity may also be at work, because cycD1 decrease was not absolute.
We then determined whether tumor growth inhibition in vivo was due to decreased proliferation or increased apoptosis. Frozen sections from control and AP20187 treated T-Fv2E-PERK tumors were analyzed by IHC for proliferation markers Ki67, phospho-histone-3 (pH3) and an apoptosis marker, cleaved caspase-3. Tumor sections from both control and AP20187 treated tumors had similar (~5%) levels of caspase-3 staining (SFig 2B). Control Fv2E-PERK tumors stained positive for both Ki67 and pH3 (Fig 3D). In sharp contrast, AP20187 treated Fv2E-PERK tumors were negative for both Ki67 and pH3 respectively, indicating growth arrest. The percent of cells positive for cycD1 were also 3–4-fold lower in the AP20187 treated nodules compared to untreated control tumors (SFig 2B). Furthermore we found no difference in the vascular density of either control or AP20187 treated T-Fv2E-PERK tumors (SFig 2C). To summarize, both our in vitro and in vivo findings strongly suggest that the growth suppression observed following PERK activation is a direct consequence of decreased proliferation and not a result of enhanced apoptosis or decreased angiogenesis.
High Endogenous PERK-eIF2α signaling in D-HEp3 cells contributes to the quiescence program in vivo
Our above results indicate that activation of PERK-eIF2α signaling could function to suppress tumorigenesis through growth arrest. Accordingly we determined whether the high basal levels of PERK activity in D-HEp3 cells is functionally responsible for their in vivo growth arrest program. D-HEp3 cells were virally infected with a vector encoding two short hairpin RNAs (shRNA) to PERK (shPERK# 1 or shPERK # 2), or to luciferase or an empty vector (D-control). Western blot analysis showed that, compared to the vector control cells, the expression of either shRNA resulted in a significant reduction in total PERK protein levels (Fig 5A). This downregulation was accompanied by a decrease in basal and tunicamycin induced levels of p-eIF2α (Fig 5A). As reported (11), this reduction in p-eIF2α levels did not increase 35S-protein labeling (data not shown) although, the expression of specific PERK-eIF2α targets such as ATF4 were decreased (Fig 5A). These results demonstrate that the shRNA-mediated down-regulation of PERK, while not dramatically affecting total protein synthesis and in vitro growth, is sufficient to downregulate downstream targets of PERK (i.e. ATF4).
Fig 5. PERK activation contributes to the dormancy program of D-HEp3 cells.

(A) Immunoblot analysis of lysates from D-control and D-shPERK expressing cells for PERK (left panel), p-eIF2α (left and right panel) and ATF4 levels (right panel). ERK1 and total eIF2α serve as loading control. (B) D-HEp3 cells infected with a control vector or sh-PERK was inoculated onto CAM at 0.4–1.0 ×10⁶ cells/CAM. Seven days later the number of tumor cells/nodule was quantified and the tumor population divisions were estimated. The graph shows the average ± S.E of the percentage of tumor nodules with greater than 1 population division. *** and ** p<0.05 as determined by Mann-Whitney test. Passaging in vivo of the control cells did not form progressively growing tumors despite having undergone in some cases >2 population doublings. (C) T-Fv2E-PERK cells were pre-treated with 0.1nM AP20187 for 24 and then 0.2×10⁶ cells were inoculated in the presence or absence of AP20187 (5×10⁻⁴ mg/kg) for 4 days. Tumors were then excised and the number of tumor cells/nodule was quantified. The line indicates the median. p<0.05 as determined by Mann-Whitney test. Inset. Immunoblot showing the levels of p-eIF2α in T-Fv2E-PERK cells treated with 0.1μM AP20187 for 2h. Total eIF2 served as a loading control. (D) D-HEp3 cells were transiently transfected with a control vector or cDNA encoding FLAG-tagged GADD34. Twenty-four hours post-transfection a fraction of the cells was lysed and immunoblotted with anti-FLAG, anti-p-eIF2α and anti- total eIF2α Ab respectively (Left panel). The remaining cells were inoculated onto CAM at 0.5×10⁶ cells/CAM (Right panel). ** p<0.05 as determined by Mann–Whitney test.
When inoculated in vivo on CAMs, D-HEp3 cells undergo on an average at most one population doubling, while during the same time the T-HEp3 cell population divided 6–7 times (31). Therefore, D-control or D-shPERK nodules whose tumor cell count was greater than 1 population doubling were scored as having escaped quiescence. We found that after 7 days in vivo ~75–100% of the D-shPERK tumor nodules were able to proliferate, while only 20% of D-control nodules were able to do so (Fig 5B). Moreover D-shPERK tumors continued to expand upon serial passaging in vivo, while the D-control nodules failed to do so (data not shown). These results suggest that, in addition to its survival function, PERK has a functional role in the induction of growth arrest of D-HEp3 cells in vivo.
The high levels of PERK activity in D-HEp3 cells are insufficient to induce growth arrest in cell culture. This seemed to depend on the intensity of PERK signals as activation of Fv2E-PERK in D-HEp3 cells, which further enhances eIF2α phosphorylation, does induce growth arrest in culture (SFig 2D). While the basal p-eIF2α levels in D-HEp3 cells were ~ 2-fold higher than in T-HEp3 cells [Fig 1A & B and (23)], activation of Fv2E-PERK in T-HEp3 cells resulted in ~ 50-fold increase in p-eIF2α levels, which causes growth arrest both in vitro and in vivo (Fig 2B). Thus we examined whether a more controlled increase in p-eIF2α levels in T-Fv2E-PERK cells, comparable to that present basally in D-HEp3 cells, would suppress only the in vivo tumor growth. Treatment of T-Fv2E-PERK cells with 0.1nM AP20187 resulted in a moderate increase in p-eIF2α levels and, similar to D-HEp3 cells, did not induce a growth arrest in vitro, (Fig 5C, inset and data not shown). Twenty-four hours after treatment with this dose the cells were inoculated and grown on CAMs for four days in the absence of AP20187 or with 0.0005mg/kg of AP20187. Surprisingly, even these low levels of PERK activity were sufficient to inhibit tumor growth. Similar to D-HEp3 cells, these cells underwent around 1 population doubling, compared to 2–4 population-doublings in untreated cells (Fig 5C). Together these results suggest that the high level of PERK in D-HEp3 cells is at a sub-threshold level for inducing growth arrest in vitro, yet contributes to the in vivo growth arrest program.
To further address the contribution of eIF2α phosphorylation to the in vivo arrest of D-HEp3 cells, we transiently overexpressed a FLAG tagged GADD34 in D-HEp3 cells. Overexpression of GADD34 resulted in decreased eIF2α phosphorylation, which correlates with previously reported decrease in GADD153 promoter activity in these cells (Fig 5D left panel and (23). Acute expression of GADD34 through transient transfection also resulted in a restoration of tumor growth (~5-fold) (Fig 5D right panel). These results support the hypothesis that in D-HEp3 cells activation of PERK and eIF2α phosphorylation in addition to signaling for survival (23), are also a part of the growth arrest program in vivo.
Discussion
We show here that tumor cells preserve the normal response to activated PERK-eIF2α signaling pathway by entering growth arrest, while at the same time, enhancing the survival response. The survival arm of this pathway in tumor cells has been previously documented (12, 13) and has led to the notion that targeting PERK activity might reduce tumor cell survival and thus benefit cancer patients (34–36). However, our results show that the growth arrest function of PERK found in normal cells (10, 37) is also operational in tumors. Therefore, the inhibition of PERK, through restoration of proliferative capacity, may exert a harmful effect because during natural cancer progression, regions of primary tumors, solitary disseminated tumor cells, as well as micrometastases, are known to be in a slow dividing, or in a growth arrested, dormant state (18–20).
Although high PERK activation promoted survival of the in vivo quiescent D-HEp3, in response to stress induced apoptosis (23), whether it was functionally linked to the growth capacity of these cells in vivo was unknown. Genetic inhibition of PERK signaling in D-HEp3 cells restored the ability of these cells to grow in vivo by interrupting the G0–G1 arrest. In agreement, activation of this pathway in T-HEp3 or SW620 cells dramatically inhibited tumor growth in vivo by inducing growth arrest. Our studies show that the intensity of PERK signaling can induce a context-dependent (i.e. in vitro vs. in vivo) growth arrest. The higher basal PERK signaling level does not affect D-HEp3 proliferation in vitro, a response that was also found when a comparable activation was achieved experimentally in T-Fv2E-PERK cells. However, this signal intensity was sufficient to inhibit tumor growth in vivo. This difference between the growth capacity of D-HEp3 cells in vitro and in vivo could be due to the cell culture conditions (high glucose, high oxygen tensions etc.) that may override the growth inhibitory effects of the high PERK-eIF2α signaling. Of note is the fact that PERK inhibition never fully restored the proliferative capacity of D-HEp3 cells to the parental T-HEp3 levels (24 hr in vivo population doubling time), suggesting that it was not the only pathway regulating the growth arrest and that other signals i.e. high p38, low EGFR and ERK (31) might persist as growth suppressive signals.
Fv2E-PERK-induced growth arrest in T-HEp3 cells was linked to decreased expressions of the G1-S transition regulators cyclin-D1, -D3 and cyclin A and negative Ki67 and pH3 staining. In NIH3T3 cells PERK mediated translation inhibition results in downregulated cyclin D1 synthesis, which is crucial for UPR-induced cell cycle arrest (10, 37). It remains to be elucidated whether the same mechanism leads to cyclin D1 reduction following PERK activation in T- or D-HEp3 cells in vivo. PERK mediated eIF2α phosphorylation results in a selective attenuation of translation. Thus, its tumor growth suppressive effect is not merely the outcome of general protein synthesis inhibition, but rather the activation of a specific translation growth arrest program. This is evident from our observations that unlike cycD1 and cycD3, expression of p38, ERK, p53 and p21 are unaffected by the translation inhibition. Paradoxically, this translation inhibition also leads to the selective translational enhancement of several mRNAs necessary for survival and adaptation of cellular stress (9, 13, 38). Further studies using microarray analysis of polysome-bound mRNAs will help identify those genes selectively translated during PERK-dependent tumor growth inhibition.
Since the concept of dormancy or quiescence implies reversibility, it is important that the Fv2E-PERK induced “dormancy-like” state in T-HEp3 cells in vitro was found to be reversible. This in vitro reversibility could be explained by the induction of GADD34 expression following Fv2E-PERK activation, as previously reported (39). In vivo studies showed that transient activation of Fv2E-PERK resulted only in a temporary inhibition of tumor growth in vivo. Similarly, activation of Fv2E-PERK with 3mg/kg of dimerizer resulted in a reversible tumor growth arrest after ~30 days of treatment. However, Fv2E-PERK-induced growth arrest in vivo was not always reversible. For instance, we found that treatment of animals bearing T-Fv2E-PERK tumors with a higher dimerizer dose (5mg/kg) resulted in irreversible growth suppression. The mechanism behind this irreversible arrest is unknown, but it clearly depends on the intensity of PERK activation. Recent studies show that in normal melanocytes induction of ATF6, ATF4 and XBP-1 activate senescence (in general an irreversible arrest) in response to Ha-Ras signals (15). Further studies will determine whether an irreversible senescence-like program might be responsible for PERK-dependent tumor suppression in vivo. Other studies support that PERK activation or eIF2αphosphorylation in mammary epithelial cells or fibroblasts can inhibit tumor growth (14, 16, 17). Together our studies support the conclusion that activation of PERK can engage a growth arrest program in tumors.
We would like to propose that targeting genes involved exclusively in the PERK mediated survival program without affecting the growth arrest signals may be more attractive targets. Moreover, unlike PERK, activation/induction of other arms of the UPR (XBP-1, ATF-6 and BiP) do not seem to impact the proliferation machinery, but are critical for the survival of tumor cells (21, 40–45). Therefore inhibition of the survival function of PERK in combination with other pro-survival arms of the UPR such as XBP-1 might be an attractive therapeutic option.
Supplementary Material
Acknowledgments
We would like to thank Dr. David Ron (NYU) for providing the Fv2E-ΔNPERK and GADD34 constructs. We would like to thank Guy Russo (CFG, University at Albany NY) for assisting us with plasmid preparations. We are grateful to Dr. Alejandro Adam and Bibiana Iglesias for help with the mice work and immunohistochemistry. We would like to thank Ariad pharmaceuticals for AP20187 (www.ariad.com). Finally, we thank Dr. Liliana Ossowski (Mount Sinai School of Medicine, NY) for critical reading of the manuscript.
This work is supported by grants from the Samuel Waxman Cancer Research Foundation Tumor Dormancy Program (to J.A. Aguirre-Ghiso and D. S. Conklin), the NIH/National Cancer Institute (grant CA109182 to J.A. Aguirre-Ghiso) and a grant from the U.S. Army Medical Research Acquisition Activity (W8IWXH-04-1-0474 to D.S. Conklin). A.C. Ranganathan is a recipient of a Ruth L. Kirschstein National Research Service Award (NIH/NCI) Fellowship.
Abbreviations
- UPR
unfolded protein response
- PERK
pancreatic endoplasmic reticulm kinase
- eIF2
eukaryotic translation initiation factor-2
- gadd34
growth arrest and DNA damage gene 34
- CHOP
C/EBP homologous proteins
- CAM
chorioallantoic membrane
- WB
western blot
References
- 1.Sonenberg N, Mathews MB, Hershey JWB. Translational Control of Gene Expression. New York: CSHL Press; 2000. pp. 547–60. [Google Scholar]
- 2.Proud CG. eIF2 and the control of cell physiology. Semin Cell Dev Biol. 2005;16:3–12. doi: 10.1016/j.semcdb.2004.11.004. [DOI] [PubMed] [Google Scholar]
- 3.Xu C, Bailly-Maitre B, Reed JC. Endoplasmic reticulum stress: cell life and death decisions. J Clin Invest. 2005;115:2656–64. doi: 10.1172/JCI26373. [DOI] [PMC free article] [PubMed] [Google Scholar]
- 4.Yoshida H. ER stress and diseases. FEBS J. 2007;274:630–58. doi: 10.1111/j.1742-4658.2007.05639.x. [DOI] [PubMed] [Google Scholar]
- 5.Zhang K, Kaufman RJ. The unfolded protein response: a stress signaling pathway critical for health and disease. Neurology. 2006;66:S102–9. doi: 10.1212/01.wnl.0000192306.98198.ec. [DOI] [PubMed] [Google Scholar]
- 6.Zhao L, Ackerman SL. Endoplasmic reticulum stress in health and disease. Curr Opin Cell Biol. 2006;18:444–52. doi: 10.1016/j.ceb.2006.06.005. [DOI] [PubMed] [Google Scholar]
- 7.Brewer JW, Hendershot LM, Sherr CJ, Diehl JA. Mammalian unfolded protein response inhibits cyclin D1 translation and cell-cycle progression. Proc Natl Acad Sci U S A. 1999;96:8505–10. doi: 10.1073/pnas.96.15.8505. [DOI] [PMC free article] [PubMed] [Google Scholar]
- 8.Harding HP, Zhang Y, Zeng H, et al. An integrated stress response regulates amino acid metabolism and resistance to oxidative stress. Mol Cell. 2003;11:619–33. doi: 10.1016/s1097-2765(03)00105-9. [DOI] [PubMed] [Google Scholar]
- 9.Harding HP, Novoa I, Zhang Y, et al. Regulated translation initiation controls stress-induced gene expression in mammalian cells. Mol Cell. 2000;6:1099–108. doi: 10.1016/s1097-2765(00)00108-8. [DOI] [PubMed] [Google Scholar]
- 10.Brewer JW, Diehl JA. PERK mediates cell-cycle exit during the mammalian unfolded protein response. Proc Natl Acad Sci U S A. 2000;97:12625–30. doi: 10.1073/pnas.220247197. [DOI] [PMC free article] [PubMed] [Google Scholar]
- 11.Harding HP, Zhang Y, Bertolotti A, Zeng H, Ron D. Perk is essential for translational regulation and cell survival during the unfolded protein response. Mol Cell. 2000;5:897–904. doi: 10.1016/s1097-2765(00)80330-5. [DOI] [PubMed] [Google Scholar]
- 12.Bi M, Naczki C, Koritzinsky M, et al. ER stress-regulated translation increases tolerance to extreme hypoxia and promotes tumor growth. EMBO J. 2005;24:3470–81. doi: 10.1038/sj.emboj.7600777. [DOI] [PMC free article] [PubMed] [Google Scholar]
- 13.Blais JD, Addison CL, Edge R, et al. Perk-dependent translational regulation promotes tumor cell adaptation and angiogenesis in response to hypoxic stress. Mol Cell Biol. 2006;26:9517–32. doi: 10.1128/MCB.01145-06. [DOI] [PMC free article] [PubMed] [Google Scholar]
- 14.Sequeira SJ, Ranganathan AC, Adam AP, Iglesias BV, Farias EF, Aguirre-Ghiso JA. Inhibition of proliferation by PERK regulates mammary acinar morphogenesis and tumor formation. PLoS ONE. 2007;2:e615. doi: 10.1371/journal.pone.0000615. [DOI] [PMC free article] [PubMed] [Google Scholar]
- 15.Denoyelle C, Abou-Rjaily G, Bezrookove V, et al. Anti-oncogenic role of the endoplasmic reticulum differentially activated by mutations in the MAPK pathway. Nat Cell Biol. 2006;8:1053–63. doi: 10.1038/ncb1471. [DOI] [PubMed] [Google Scholar]
- 16.Donze O, Jagus R, Koromilas AE, Hershey JW, Sonenberg N. Abrogation of translation initiation factor eIF-2 phosphorylation causes malignant transformation of NIH 3T3 cells. EMBO J. 1995;14:3828–34. doi: 10.1002/j.1460-2075.1995.tb00052.x. [DOI] [PMC free article] [PubMed] [Google Scholar]
- 17.Perkins DJ, Barber GN. Defects in translational regulation mediated by the alpha subunit of eukaryotic initiation factor 2 inhibit antiviral activity and facilitate the malignant transformation of human fibroblasts. Mol Cell Biol. 2004;24:2025–40. doi: 10.1128/MCB.24.5.2025-2040.2004. [DOI] [PMC free article] [PubMed] [Google Scholar]
- 18.Aguirre-Ghiso JA. Models, mechanisms and clinical evidence for cancer dormancy. Nat Rev Cancer. 2007;7:834–46. doi: 10.1038/nrc2256. [DOI] [PMC free article] [PubMed] [Google Scholar]
- 19.Chambers AF, Groom AC, MacDonald IC. Dissemination and growth of cancer cells in metastatic sites. Nat Rev Cancer. 2002;2:563–72. doi: 10.1038/nrc865. [DOI] [PubMed] [Google Scholar]
- 20.Kufe D, Pollock RE, Weichselbaum RR, Bast RC, Jr, Gansler TS, Holland JF, Frei E., III . Cancer Medicine. 6. Hamilton (Canada): BC Decker Inc; 2003. pp. 161–94. [Google Scholar]
- 21.Aguirre-Ghiso JA, Ossowski L, Rosenbaum SK. Green fluorescent protein tagging of extracellular signal-regulated kinase and p38 pathways reveals novel dynamics of pathway activation during primary and metastatic growth. Cancer Res. 2004;64:7336–45. doi: 10.1158/0008-5472.CAN-04-0113. [DOI] [PubMed] [Google Scholar]
- 22.Ossowski L, Reich E. Changes in malignant phenotype of a human carcinoma conditioned by growth environment. Cell. 1983;33:323–33. doi: 10.1016/0092-8674(83)90414-2. [DOI] [PubMed] [Google Scholar]
- 23.Ranganathan AC, Zhang L, Adam AP, Aguirre-Ghiso JA. Functional coupling of p38-induced up-regulation of BiP and activation of RNA-dependent protein kinase-like endoplasmic reticulum kinase to drug resistance of dormant carcinoma cells. Cancer Res. 2006;66:1702–11. doi: 10.1158/0008-5472.CAN-05-3092. [DOI] [PMC free article] [PubMed] [Google Scholar]
- 24.Goi T, Fujioka M, Satoh Y, et al. Angiogenesis and Tumor Proliferation/Metastasis of Human Colorectal Cancer Cell Line SW620 Transfected with Endocrine Glands-Derived-Vascular Endothelial Growth Factor, As a New Angiogenic Factor. Cancer Res. 2004;64:1906–10. doi: 10.1158/0008-5472.can-3696-2. [DOI] [PubMed] [Google Scholar]
- 25.de Haro C, Mendez R, Santoyo J. The eIF-2alpha kinases and the control of protein synthesis. FASEB J. 1996;10:1378–87. doi: 10.1096/fasebj.10.12.8903508. [DOI] [PubMed] [Google Scholar]
- 26.Williams BR. PKR; a sentinel kinase for cellular stress. Oncogene. 1999;18:6112–20. doi: 10.1038/sj.onc.1203127. [DOI] [PubMed] [Google Scholar]
- 27.Lu PD, Jousse C, Marciniak SJ, et al. Cytoprotection by pre-emptive conditional phosphorylation of translation initiation factor 2. EMBO J. 2004;23:169–79. doi: 10.1038/sj.emboj.7600030. [DOI] [PMC free article] [PubMed] [Google Scholar]
- 28.Ma Y, Lu Y, Zeng H, Ron D, Mo W, Neubert TA. Characterization of phosphopeptides from protein digests using matrix-assisted laser desorption/ionization time-of-flight mass spectrometry and nanoelectrospray quadrupole time-of-flight mass spectrometry. Rapid Commun Mass Spectrom. 2001;15:1693–700. doi: 10.1002/rcm.426. [DOI] [PubMed] [Google Scholar]
- 29.Su Q, Wang S, Gao HQ, et al. Modulation of the eukaryotic initiation factor 2 lpha-subunit kinase PERK by tyrosine phosphorylation. J Biol Chem. 2008;283:469–75. doi: 10.1074/jbc.M704612200. [DOI] [PubMed] [Google Scholar]
- 30.Ossowski L. In vivo invasion of modified chorioallantoic membrane by tumor cells: the role of cell surface-bound urokinase. J Cell Biol. 1988;107:2437–45. doi: 10.1083/jcb.107.6.2437. [DOI] [PMC free article] [PubMed] [Google Scholar]
- 31.Aguirre Ghiso JA, Kovalski K, Ossowski L. Tumor dormancy induced by downregulation of urokinase receptor in human carcinoma involves integrin and MAPK signaling. J Cell Biol. 1999;147:89–104. doi: 10.1083/jcb.147.1.89. [DOI] [PMC free article] [PubMed] [Google Scholar]
- 32.Hewitt RE, McMarlin A, Kleiner D, et al. Validation of a model of colon cancer progression. J Pathol. 2000;192:446–54. doi: 10.1002/1096-9896(2000)9999:9999<::AID-PATH775>3.0.CO;2-K. [DOI] [PubMed] [Google Scholar]
- 33.Parle-McDermott A, McWilliam P, Tighe O, Dunican D, Croke DT. Serial analysis of gene expression identifies putative metastasis-associated transcripts in colon tumour cell lines. Br J Cancer. 2000;83:725–8. doi: 10.1054/bjoc.2000.1330. [DOI] [PMC free article] [PubMed] [Google Scholar]
- 34.Feldman DE, Chauhan V, Koong AC. The Unfolded Protein Response: A Novel Component of the Hypoxic Stress Response in Tumors. Mol Cancer Res. 2005;3:597–605. doi: 10.1158/1541-7786.MCR-05-0221. [DOI] [PubMed] [Google Scholar]
- 35.Fels DR, Koumenis C. The PERK/eIF2alpha/ATF4 module of the UPR in hypoxia resistance and tumor growth. Cancer Biol Ther. 2006;5:723–8. doi: 10.4161/cbt.5.7.2967. [DOI] [PubMed] [Google Scholar]
- 36.Koumenis C. ER stress, hypoxia tolerance and tumor progression. Curr Mol Med. 2006;6:55–69. doi: 10.2174/156652406775574604. [DOI] [PubMed] [Google Scholar]
- 37.Brewer JW, Cleveland JL, Hendershot LM. A pathway distinct from the mammalian unfolded protein response regulates expression of endoplasmic reticulum chaperones in non-stressed cells. EMBO J. 1997;16:7207. doi: 10.1093/emboj/16.23.7207. [DOI] [PMC free article] [PubMed] [Google Scholar]
- 38.Blais JD, Filipenko V, Bi M, et al. Activating transcription factor 4 is translationally regulated by hypoxic stress. Mol Cell Biol. 2004;24:7469–82. doi: 10.1128/MCB.24.17.7469-7482.2004. [DOI] [PMC free article] [PubMed] [Google Scholar]
- 39.Novoa I, Zeng H, Harding HP, Ron D. Feedback inhibition of the unfolded protein response by GADD34-mediated dephosphorylation of eIF2alpha. J Cell Biol. 2001;153:1011–22. doi: 10.1083/jcb.153.5.1011. [DOI] [PMC free article] [PubMed] [Google Scholar]
- 40.Carrasco DR, Sukhdeo K, Protopopova M, et al. The differentiation and stress response factor XBP-1 drives multiple myeloma pathogenesis. Cancer Cell. 2007;11:349–60. doi: 10.1016/j.ccr.2007.02.015. [DOI] [PMC free article] [PubMed] [Google Scholar]
- 41.Koong AC, Chauhan V, Romero-Ramirez L. Targeting XBP-1 as a novel anti-cancer strategy. Cancer Biol Ther. 2006;5:756–9. doi: 10.4161/cbt.5.7.2973. [DOI] [PubMed] [Google Scholar]
- 42.Lee AS. GRP78 induction in cancer: therapeutic and prognostic implications. Cancer Res. 2007;67:3496–9. doi: 10.1158/0008-5472.CAN-07-0325. [DOI] [PubMed] [Google Scholar]
- 43.Ranganathan AC, Adam AP, Zhang L, Aguirre-Ghiso JA. Tumor cell dormancy induced by p38SAPK and ER-stress signaling: an adaptive advantage for metastatic cells? Cancer Biol Ther. 2006;5:729–35. doi: 10.4161/cbt.5.7.2968. [DOI] [PMC free article] [PubMed] [Google Scholar]
- 44.Romero-Ramirez L, Cao H, Nelson D, et al. XBP1 is essential for survival under hypoxic conditions and is required for tumor growth. Cancer Res. 2004;64:5943–7. doi: 10.1158/0008-5472.CAN-04-1606. [DOI] [PubMed] [Google Scholar]
- 45.Shuda M, Kondoh N, Imazeki N, et al. Activation of the ATF6, XBP1 and grp78 genes in human hepatocellular carcinoma: a possible involvement of the ER stress pathway in hepatocarcinogenesis. J Hepatol. 2003;38:605–14. doi: 10.1016/s0168-8278(03)00029-1. [DOI] [PubMed] [Google Scholar]
Associated Data
This section collects any data citations, data availability statements, or supplementary materials included in this article.