

SUMMARY
Adipose (Adp) is an evolutionarily conserved gene isolated from naturally occurring obese flies homozygous for an adp mutation. Here we show that the anti-obesity function of Adp (worm Y73E7A.9, fly adp, and murine Wdtc1) is conserved from worms to mammals. Further, Adp appears to inhibit fat formation in a dosage-sensitive manner. Adp heterozygous flies and Adp heterozygous mutant mice are obese and insulin resistant, as are mice that express a dominant negative form of Adp in fat cells. Conversely, fat-restricted Adp transgenic mice are lean and display improved metabolic profiles. A transient transgenic increase in Adp activity in adult fly fat tissues reduces fat accumulation, indicating therapeutic potential. ADP may elicit these anti-adipogenic functions by regulating chromatin dynamics and gene transcription, as it binds both histones and HDAC3 and inhibits PPARγ activity. Thus Adp appears to be involved in an ancient pathway that regulates fat accumulation.
INTRODUCTION
Fat storing tissues play essential roles such as regulating metabolism and lifespan (Bluher et al., 2003; Spiegelman and Flier, 2001). Adipocyte dysfunction underlies obesity and is central to the metabolic derangements in type II diabetes (Must et al., 1999). The dramatic rise in obesity and diabetes have led to a public health crisis that could be addressed by identifying genes that influence adipogenesis and metabolism (Olshansky et al., 2005).
Studies of mammalian cell culture adipogenic models have revealed a transcriptional hierarchy, including C/EBPs, PPARγ, and SREBP, that controls adipogenesis (Rosen et al., 2000). PPARγ, a nuclear hormone receptor (NHR), is a central regulator of fat biology (Lehrke and Lazar, 2005; Rosen et al., 2000). NHRs are ligand-regulated transcription factors (Evans, 2005; Mangelsdorf et al., 1995). In the absence of ligand, NHRs repress transcription by interacting with corepressor molecules (Lazar, 2003; Perissi et al., 2004). Corepressor complexes also regulate non-NHR transcription factors (Rosenfeld et al., 2006; Smith and O’Malley, 2004). Corepressors either contain or recruit histone deacetylases (HDACs), or other chromatin modifying enzymes, that render chromatin structure unfavorable for transcription (Rosenfeld et al., 2006; Smith and O’Malley, 2004). HDAC3 is an important component of the repressive complex that regulates adipogenic genes (Fajas et al., 2002; Fu et al., 2005). Components of the corepressor complex also directly bind histone 2B (H2B) and histone 4 (H4) (Lorain et al., 1998; Magnaghi et al., 1998; Yoon et al., 2005). Gene expression is induced upon exchange of the corepressor complex for a coactivator complex, which often has histone acetyltransferase activity. Thereby chromatin is remodeled into a form accessible for transcriptional activation (Rosenfeld et al., 2006; Smith and O’Malley, 2004). The role of histone modifications in controlling gene expression has been conserved during eukaryotic evolution.
Invertebrate models such as C. elegans and D. melanogaster are powerful systems for the discovery and analysis of genes critical to human health and disease. These advantages have yet to be fully applied to fat biology in part because of concerns that differences exist between invertebrate and mammalian fat including the observations that worm and fly fat is not stored in dedicated adipocytes but rather in more multifunctional cells (Rosen, 2006). Molecular studies also highlight potential differences (Tong et al., 2000). Other data, however, support the notion that invertebrates may provide useful information on adipocyte biology (Ashrafi et al., 2003; Gronke et al., 2005; McKay et al., 2003; Ruden et al., 2005).
Almost 50 years ago, Winifred Doane hypothesized that climates marked by cycles of famine might select for organisms highly efficient at fat storage to allow for survival during times of limited food. In Kaduna, Nigeria, Dr. Doane successfully isolated such an obese D. melanogaster mutant she ultimately termed adipose (adp) (Clark and Doane, 1983; Doane, 1960a; Doane, 1960b). Recently Doane and colleagues cloned the fly Adp gene, which encodes a novel protein conserved as a single copy from flies to humans (Hader et al., 2003). The fly adp mutation is a 23 base pair deletion predicted to result in premature termination of ADP. ADP contains multiple protein interaction domains (6 WD40, 3 tetratrico peptide repeat [TPR]) and may therefore function as a nexus for a protein complex important in fat biology (Blatch and Lassle, 1999; Hader et al., 2003; Smith et al., 1999). Although Adp has a broad pattern of expression, the primary phenotype observed in adp null flies is increased triglyceride storage in the fat body, the fly adipose organ (Hader et al., 2003).
In worms, we found that C.elegans Adp (Y73E7A.9) RNAi increased fat accumulation. Adp heterozygous flies also displayed metabolic phenotypes indicating dosage-sensitivity in fat formation. Transgenic expression of Adp in the fat body reduced fly fat formation even when induced only briefly during adulthood. Murine Adp (Wdtc1) also blocked fat fat formation in cell culture adipogenesis systems. Next we generated mice with LacZ inserted into the Adp locus. Adp−/− mutant mice were born at well below the expected Mendelian ratio, making analysis of metabolic phenotypes difficult. However, Adp+/−mice, like adp+/− flies, were obese and insulin resistant. Similarly, transgenic mice that expressed a dominant negative Adp in fat cells were obese and hyperglycemic. Conversely, transgenic mice that expressed wild-type Adp in fat were lean and had improved metabolic parameters. ADP appears to function in the nucleus where it interacts with H2B, H4 and HDAC3, indicating that ADP may be present in a chromatin remodeling complex. PPARγ may be a target of this complex as ADP inhibits PPARγ transcriptional activity. These data are consistent with the notion that Adp is a conserved dosage-sensitive anti-obesity gene that functions in a corepressor complex to regulate gene expression.
RESULTS
Inhibiting Adipose Stimulates Worm Fat Formation
We designed a genome-wide screen, coupling RNAi, light microscopy and staining with Nile Red, a dye whose fluorescent intensity reflects fat content, to identify genes involved in C. elegans fat formation (McKay et al., 2003). We observed that RNAi with a construct targeting the 5′ region of the C. elegans Adp homolog (Figure 1A) produced worms with increased fat formation as evidenced by enhanced opacity and increased Nile Red fluorescence (Figure 1B). RNAi with a second construct that targets an independent region of Adp also produced an obese phenotype, indicating specificity (Figure 1B). These data support the idea that Adp has an anti-obesity function in C. elegans.
Figure 1. Inhibiting Adipose Stimulates Worm and Fly Fat Formation.
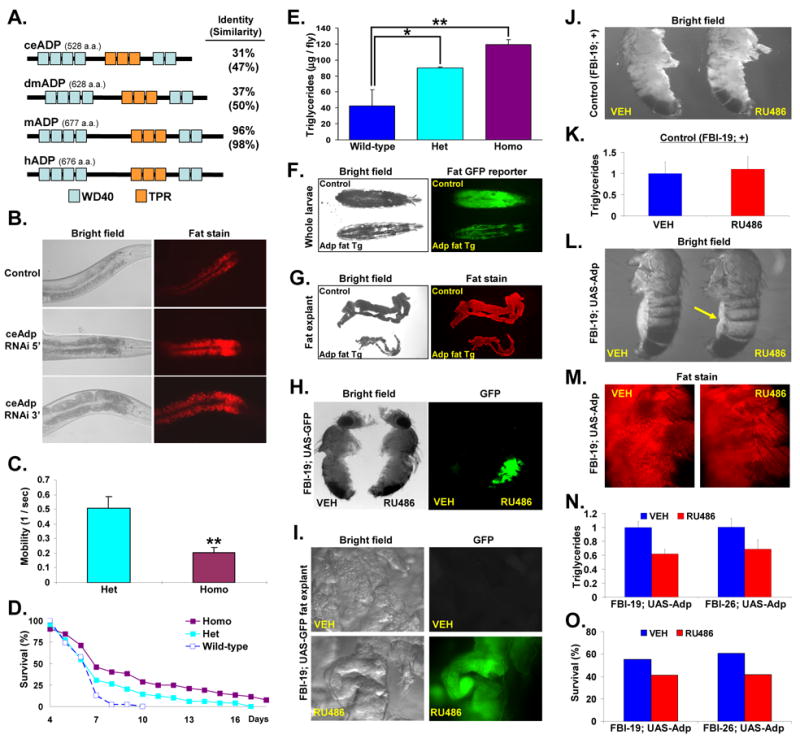
(A) Alignment of worm (ce), fly (dm), mouse (m) and human (h) ADP protein. WD40 domains: light blue rectangles, TPR domains: orange rectangles. The percentages refer to comparison with hADP.
(B) Progeny of control or Adp RNAi worms were examined with bright field microscopy in which increased opacity indicates more fat storage. Fat content was also assessed with Nile Red, a lipid-specific dye. Worms are at the same developmental stage.
(C) Mobility of male adp+/− (Het) and adp−/− (Homo) flies was assessed in a negative geotaxis assay. Mobility is plotted as the inverse of time (seconds) required for flies to crawl a fixed distance.
(D) Adp+/+ wild-type, adp+/− (Het), and adp−/− (Homo) male adult flies (n > 100) were deprived of food and survival was plotted.
(E) Triglycerides were quantified from well-fed adult male adp+/+ wild-type, adp+/− (Het), and adp−/− (Homo) flies (n = 10 per genotype, averages from 4 experiments plotted).
(F) Larvae expressing a fat body GFP reporter either alone (control) or with Adp fat body transgenesis were photographed under bright field (left) or GFP fluorescence (right) microscopy.
(G) Fat body explants of larvae described in F were stained with Nile Red and photographed with bright field (left) or fluorescence (right) microscopy.
(H, I) Adult fat body inducible (FBI)-GAL4; UAS-GFP male reporter flies were randomized to vehicle (VEH) or inducer (RU486) and then the whole fly (H) or fat body explants (I) were photographed. Wings and legs were removed in H for imaging.
(J, K) Single transgenic FBI-19 male adult flies were treated with either vehicle or RU486 and photographed with light microscopy (J) or subjected to triglyceride quantitation and levels were normalized to vehicle-treated flies (K) (n = 10 per treatment, averages from 5 experiments plotted). Wings and legs were removed in J for photography.
(L) Adult FBI-19-Adp male flies were treated with vehicle or RU486 and then photographed. Arrow indicates abdomen and the fat body, which appears smaller after RU486 treatment. Wings and legs were removed for imaging.
(M) Flies described in L were stained with Nile Red and whole mounts were photographed.
(N) Triglyceride quantification of male adult FBI-19-Adp and FBI-26-Adp flies treated with vehicle or RU486. Values were normalized to vehicle or RU486-treated single transgenic controls (n = 10 per treatment, averages from 5 experiments plotted).
(O) Day 7 starvation survival of male adult FBI-19-Adp and FBI-26-Adp flies treated with vehicle or RU486 (n > 50). Similar results obtained for females in analyses performed in C–E and H–O. *p < 0.05; **p < 0.01; N/S not significant by t-test. Error bars indicate standard error of the mean (SEM).
Adipose Has Dosage-Sensitive Roles in Fly Fat Biology
Adipose (adp) homozygous mutant flies are obese and starvation resistant, but the homozygous state also has negative consequences (Doane, 1960a; Doane, 1960b). For example, adp homozygous mutants have decreased mobility compared to adp heterozygotes (Figure 1C). Since adp heterozygosity might also engender some beneficial effects during famine while minimizing deleterious sequelae (Clark and Doane, 1983; Doane, 1960a; Doane, 1960b), we evaluated the fat biology of adp+/− flies and found a phenotype intermediate between wild-type and adp nulls. In a starvation survival assay, which often correlates with fat content (Djawdan et al., 1998), survival was adp−/− > adp+/− > adp+/+ (Figure 1D), consistent with prior observations (Doane, 1960b). Triglyceride quantitation also revealed the same trend (Figure 1E). These data indicate that Adp has dose-dependent effects on fly fat storage.
Adipose Fat Body Transgenesis Blocks Larval and Adult Fly Fat Storage
Expression of Adp in fat cells rescued adp mutant obesity and reduced fat storage, indicating that its anti-obesity functions are primarily mediated within the fat cell (Hader et al., 2003). We further analyzed this notion by generating transgenic flies that expressed Adp (UAS-Adp) in a fat-restricted manner under the control of the Dcg-Gal4 driver, expressed in late embryonic, larval, and adult fat (Suh et al., 2006). We also introduced a Dcg-GFP fat body GFP transgenic reporter to visualize the fat body in intact animals. We found that fat body transgenic expression of Adp inhibited fat formation based upon reduced opacity, decreased Nile Red and GFP fluorescence, and decreased fat body size (Figures 1F and 1G).
We also examined whether Adp might regulate adult fat biology. For this, we generated two independent fat body RU486-inducible GAL4 strains (FBI-19, FBI-26) in an enhancer trap screen (Roman et al., 2001). Adult flies of these two lines express a UAS-GFP reporter in the fat body when provided RU486 (Figures 1H and 1I). RU486 does not appear to affect the fat biology of FBI flies based upon gross examination, fat body morphology and triglyceride quantitation (Figures 1H, 1J and 1K). We crossed both FBI-GAL4 lines with UAS-Adp flies and randomized adult progeny to 5 days of vehicle or RU486. Gross observations, whole mount Nile Red stains, triglyceride quantitation and starvation survival assays indicated that RU486-treatment reduced FBI-GAL4; UAS-Adp fat accumulation as compared to those treated with vehicle (Figures 1L, 1M, 1N, and 1O). These results indicate that the anti-obesity effects of Adp can operate in adult fat tissues.
Adipose Inhibits Murine Fat Formation
To begin to characterize mammalian Adp, we evaluated its relative expression in a variety of mouse tissues using qPCR. We found that murine Adp, like fly Adp (Hader et al., 2003), is widely expressed (Figure 2A). Attempts to generate high titer specific antibodies against murine ADP have been unsuccessful. 3T3-L1 cells are a murine cell culture adipogenic model that can be induced to differentiate from preadipocytes to fat-storing cells that express adipocyte markers (Rosen and Spiegelman, 2000). Adp was expressed in 3T3-L1 cells (Figure 2B) with highest levels in preadipocytes (Figure 2B), although in a few cases the levels were similar. Adp expression was also enriched in the stromal-vascular fraction of murine adipose depots, thought to contain preadipocytes (Figure 2C) (Poznanski et al., 1973; Soukas et al., 2001). We also evaluated Adp expression in murine fat depots in response to genetic and diet-induced obesity or fasting. We found that Adp levels decreased in both forms of obesity and increased upon fasting (Figure 2D), suggesting that Adp may regulate mammalian fat biology.
Figure 2. Adp Inhibits Murine Adipogenesis.
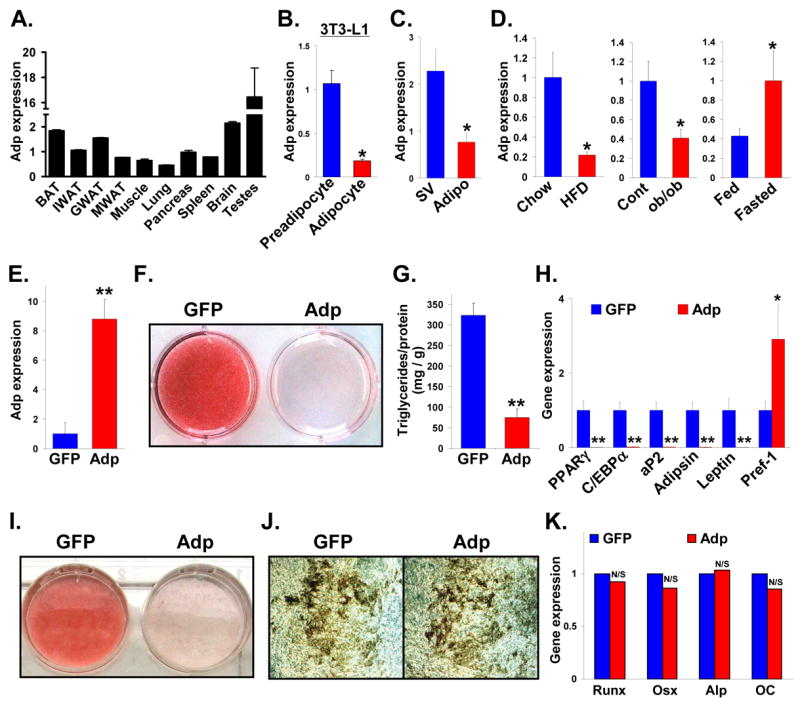
(A) qPCR analysis of Adp expression levels in various tissues from 4-month old ICR mice. Brown adipose tissue (BAT), inguinal white adipose tissue (IWAT), perigonadal white adipose tissue (GWAT), mesenteric white adipose tissue (MWAT)
(B) 3T3-L1 cells were induced to form adipocytes and Adp levels were assessed with qPCR.
(C) Adp expression was quantified with qPCR in stromal-vascular (SV) and adipocyte (Adipo) fractions.
(D) Adp expression levels in adipose depots of littermates provided a normal or high fat diet (HFD) (left panel), genetically obese (ob/ob) fat depots compared to littermate controls (middle panel), or mice subjected to a 24-hour fast compared to fed controls (right panel).
(E) Adp levels in 3T3-L1 cells infected with virus encoding GFP or Adp.
(F–H) 3T3-L1 cells were infected with virus encoding GFP or Adp, adipogenically induced, and adipogenesis was evaluated with (F) Oil Red O staining (fat stains red), (G) triglyceride quantitation and (H) qPCR quantitation of the indicated markers. PPARγ and C/EBPα are adipogenic transcription factors; aP2 marks differentiated adipocytes; adipsin and leptin are adipokines expressed by mature adipocytes; Pref-1 is a preadipocyte marker.
(I) NIH3T3 cells were infected with virus encoding GFP or Adp, adipogenically induced, and adipogenesis evaluated with Oil Red O staining.
(J, K) MC3T3-E1 preosteoblastic cells were infected with GFP or Adp, osteogenically induced, and bone formation was assessed with (J) Von Kossa staining (bone stains black) or (K) qPCR of osteogenic markers. Runx2 (Runx) and Osterix (Osx) are osteogenic transcription factors, and alkaline phosphatase (Alp) and osteocalcin (OC) are bone differentiation markers.
*p < 0.05, **p < 0.01; N/S not significant by t-test. Error bars represent SEM. β-actin serves as a loading control.
To investigate a potential role for Adp in mammalian adipogenesis, we first cloned murine Adp from a 3T3-L1 cDNA library. We then infected 3T3-L1s with virus encoding either GFP or murine Adp, which significantly increased Adp expression (Figure 2E). When adipogenically induced, the GFP cells became lipid-laden adipocytes as evidenced by fat-specific stains and triglyceride quantitation (Figures 2F and 2G). In contrast, the Adp cells retained preadipocyte morphology and accumulated only trivial amounts of lipid (Figures 2F and 2G). Further, Adp inhibited the expression of a panel of adipogenic markers (Figure 2H). Expression of Pref-1, whose levels inversely correlate with adipogenesis, increased (Figure 2H). Adp also inhibited NIH3T3 adipogenesis (Figure 2I). To test specificity, we examined the effect of Adp on MC3T3-E1 cell culture osteogenesis. However, based upon Von Kossa stain and molecular analyses, Adp did not alter osteogenesis (Figures 2J and 2K).
To determine whether Adp could inhibit murine fat formation, we placed it under the control of the 5.4kb aP2 promoter/enhancer (Figure 3A), which drives expression in murine adipocytes, although it can be expressed in some macrophages (Makowski et al., 2001; Ross et al., 1990). We generated several independent lines of aP2-Adp transgenics which had the same phenotype. qPCR analyses showed that aP2-Adp mice expressed higher levels of Adp in fat (Figure 3B). We first studied mice after backcrossing into an ICR background. By 16 weeks the weight of the aP2-Adp mice began to diverge from their wild-type littermates and this was reflected in their appearance (Figures 3C and 3D). At 24 weeks, NMR and fat depot analyses showed that the Adp transgenics had significantly less body fat than controls (Figures 3E, 3F, and 3G). The weights of other organs were unaffected (Figure 3G). Histological analyses revealed that aP2-Adp mice had significantly smaller adipocytes than controls (Figure 3H). Plasma analyses showed reduced levels of leptin and insulin in the aP2-Adp mice (Figure 3I). Glucose tolerance tests (GTT) showed that the aP2-Adp mice had significantly lower blood glucose levels than controls (Figure 3J). Plasma triglyceride levels, food consumption, body temperature, and activity were unchanged (Figures 3I and 3K, supplemental Figure S1). aP2-Adp transgenesis also produced a lean phenotype on a pure B6 background (not shown).
Figure 3. Fat-Selective Adp Transgenic Mice Are Lean and Insulin Sensitive.
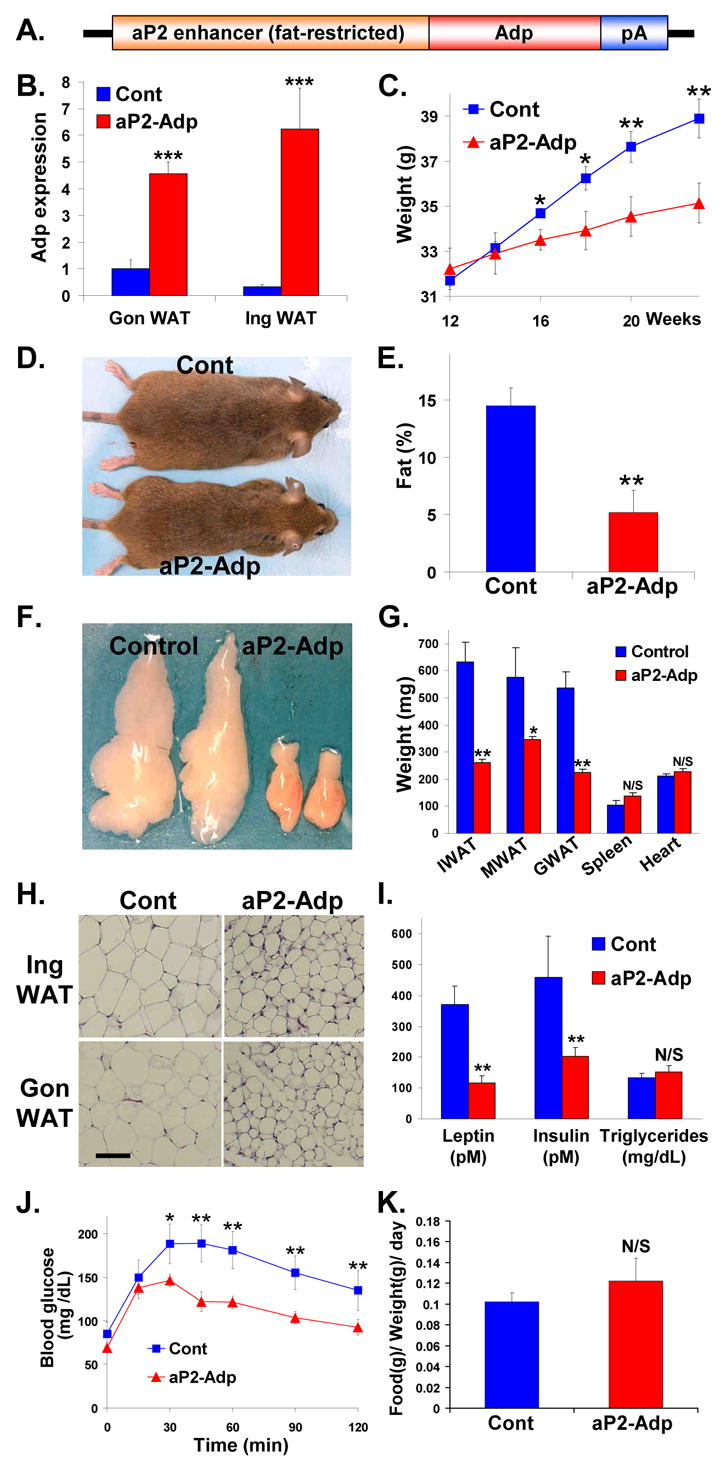
(A) aP2-Adp transgene.
(B) qPCR analysis of Adp expression in fat pads removed from control and aP2-Adp transgenic littermates.
(C) Weight curves of aP2-Adp transgenic mice and littermate controls (n = 8).
(D) Photograph of a representative control (top) and aP2-Adp transgenic mouse (bottom).
(E) NMR analyses of fat content of aP2-Adp transgenic mice and littermate controls (n = 8).
(F) Photograph of representative perigonadal white adipose tissue (WAT) from control and aP2-Adp transgenics.
(G) Average weights of inguinal (I), mesenteric (M), and perigonadal (G) WAT depots and the indicated organs from aP2-Adp transgenics and littermates. (n = 8).
(H) Histological sections of inguinal (Ing) and perigonadal (Gon) WAT depots of control and aP2-Adp transgenic mice.
(I) Analyses of average leptin, insulin, and triglyceride levels in plasma taken from aP2-Adp transgenic mice and littermates (n = 8).
(J) GTTs of aP2-Adp transgenics mice and control littermates.
(K) Food consumption was measured and plotted as the average of the indicated littermate control and aP2-Adp transgenic cohorts (n = 8). D–K studies performed at 6 months of age. *p < 0.05, **p < 0.01, ***p < 0.005; N/S not significant by t-test. Error bars indicate SEM.
Inhibiting Adipose Stimulates Murine Fat Formation
To assess necessity, we used NIH3T3 cells, which are less adipogenic than 3T3-L1s, and generated stable cells that expressed control or Adp RNAi. Adp RNAi reduced Adp transcript levels and increased adipogenesis as assessed by Oil Red O stains, triglyceride quantitation, and molecular analyses (Figures 4A, 4B, 4C, and 4D). A second independent Adp RNAi construct produced equivalent results (not shown).
Figure 4. Inhibiting Adp Stimulates Mammalian Adipogenesis.

(A–D) NIH3T3s stably expressing either control RNAi or Adp RNAi were evaluated with (A) Adp qPCR (B) Oil Red O staining, (C) triglyceride quantitation, and (D) qPCR molecular analyses as in Figure 3.
(E) Cartoon showing Adp structure, the series of deletion mutants, and their effects on adipogenesis. FL = full-length. Red arrows indicate effect on adipogenesis. WD40 domains: light blue rectangles, TPR domains: orange rectangles.
(F) NIH3T3 cells expressing either GFP or AdpC1 were stained with Oil Red O to assess fat storage.
(G) GFP (−−), Adp, and increasing amounts of AdpC1 were introduced into 3T3-L1s and fat accumulation evaluated with Oil Red O (top) and triglyceride quantitation (bottom). Purple shows increasing concentration of AdpC1 while Adp (green) is kept constant.
(H) Schema as in G, except in this case AdpC1 was held constant while Adp levels were varied.
**p < 0.01; N/S not significant by t-test. Error bars represent SEM.
To investigate structure-function relationships, we divided murine Adp into several pieces designed around the protein interaction domains and assayed their adipogenic activity (Figure 4E). We found that expressing the carboxyl-portion of Adp (AdpC1) stimulated fat formation (Figures 4E and 4F), mimicking the Adp RNAi phenotype. AdpC1 seemed to function as a dominant negative form of Adp based upon the observations that increasing amounts of AdpC1 overcame the Adp effect while wild-type Adp rescued the AdpC1 effect in a dose-dependent fashion (Figures 4G and 4H).
Since AdpC1 appeared to act as a functional antagonist of Adp, it provided a potential tool to dissect Adp function in vivo. For this, we generated several aP2-AdpC1 transgenic and non-transgenic B6:D2F founders (Figure 5A). Although aP2-AdpC1 transgenic mice had similar weights as the control founders, NMR analysis showed that the aP2-AdpC1 mice had increased fat content (Figures 5B and 5C). Further, the transgenic WAT depots weighed more than controls whereas non-adipose organs showed no differences (Figure 5D). Histological studies showed that the aP2-AdpC1 adipocytes were larger than control adipocytes (Figure 5E). Food intake and body temperature were not significantly altered (Figure 5F and supplemental Figure S2). In GTTs, the aP2-AdpC1 had higher blood glucose levels (Figure 5G).
Figure 5. Fat-Selective Blockade of Adipose Produces Murine Obesity and Hyperglycemia.
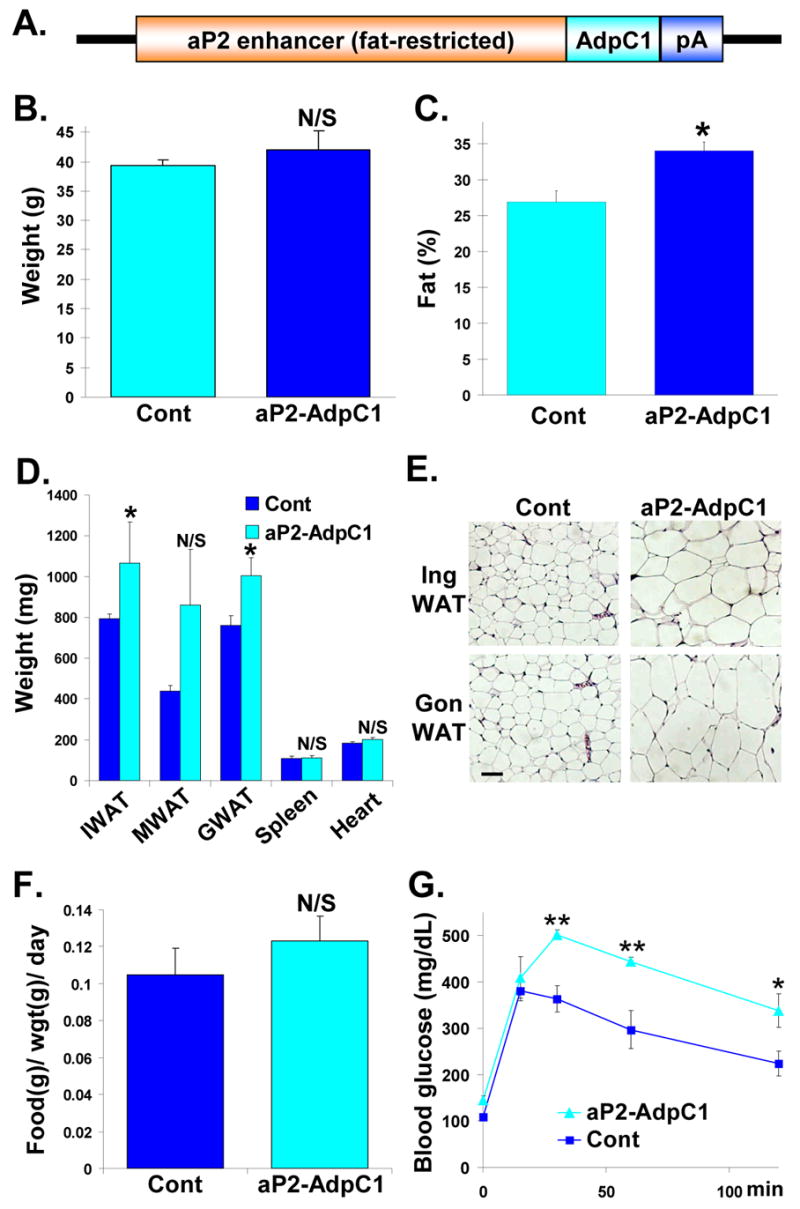
(A) aP2-AdpC1 construct.
(B, C) Average weights (B) and average NMR fat content (C) of aP2-AdpC1 transgenic and non-transgenic founders (n = 10).
(D) Average weights of inguinal (I), mesenteric (M), and perigonadal (G) WAT depots as well as the indicated organs from aP2-AdpC1 transgenic mice and littermate controls. (n = 10)
(E) Histological analyses of control and aP2-AdpC1 inguinal (Ing, top) and perigonadal (Gon, bottom) WAT.
(F) Food intake of aP2-AdpC1 transgenic mice and littermates.
(G) GTTs of aP2-AdpC1 mice and control littermates. Analyses in panels B–G on 8-month old mice.
*p < 0.05, **p < 0.01; N/S not significant by t-test. Error bars represent SEM.
Adipose Heterozygous Mice Are Obese
Next we generated mice with a splice acceptor-LacZ-Neo resistance cassette inserted into the Adp locus at a position that should produce an early truncation of the ADP protein at amino acid 15 (Figure 6A). Expression levels of Adp in adipose tissues, based upon qPCR analyses, were reduced by more than half in the Adp heterozygotes (supplemental Figure S3). We bred the Adp mutation 7 or 8 generations (F7, F8) into the ICR background and then intercrossed F7 or F8 ICR Adp heterozygotes. However, Adp homozygotes were born at markedly reduced ratios compared to Mendelian predictions (Figure 6B). Although some Adp homozygotes were obese, their scarcity precluded statistically significant analyses and adult phenotypes observed in the few mice that escaped embryonic lethality may reflect secondary rather than primary effects.
Figure 6. Adp Heterozygous Mutant Mice Are Obese and Insulin Resistant.
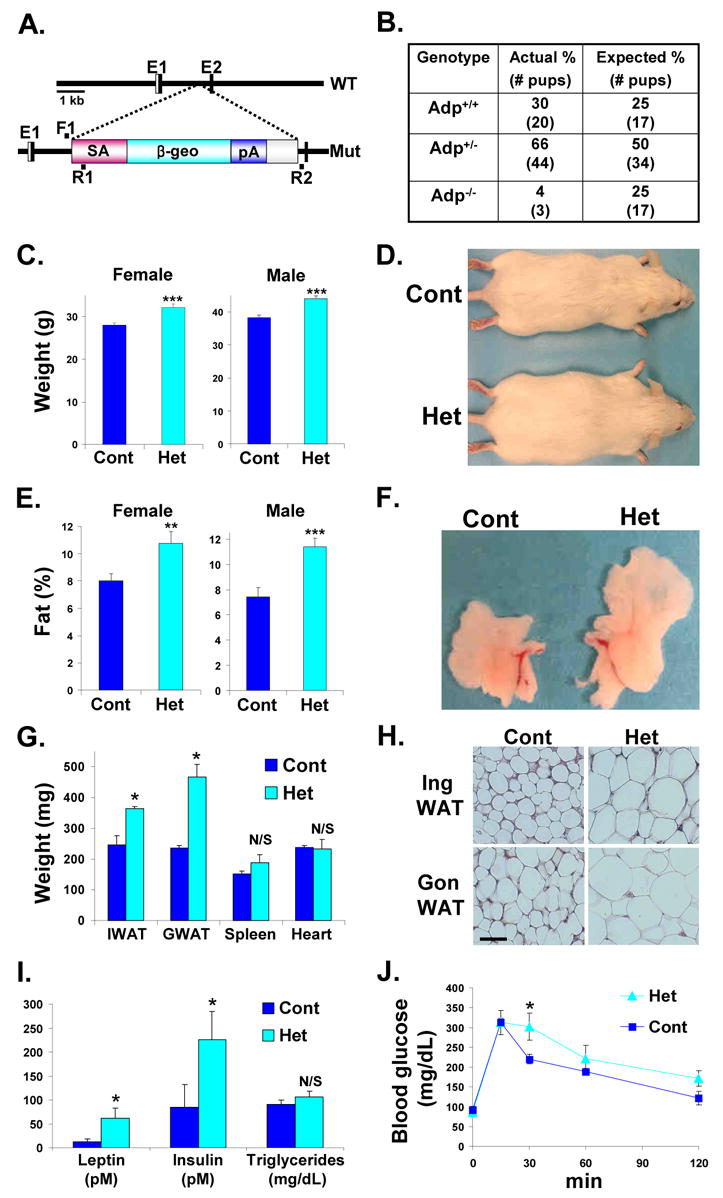
(A) Schema of the wild-type (WT) Adp locus and the mutant (Mut) Adp allele. Splice Acceptor (SA) and the lacZ-neomycin (β-geo) cassette were inserted and disrupt gene expression from the second exon (E2). The location of the genotyping primers (F1, R1, R2) are illustrated.
(B) Genomic DNA was extracted from pups of multiple Adp+/− by Adp+/− intercrosses and genotyped for the presence of Adp mutant and wild-type alleles.
(C) Average weights of littermate matched female (control n = 10 mice, Adp Het n = 12) and male (control n = 15, Adp, Het n = 20) cohorts.
(D) Photograph of representative wild-type (Cont) and Adp+/− mice (Het).
(E) Average fat content as assessed by NMR of littermate matched female (control n = 10 mice, Adp Het n = 12) and male (control n = 15, Adp Het n = 20) cohorts.
(F) Photograph of representative perigonadal white adipose tissue (WAT) explants from sibling wild-type (Cont) and Adp+/− (Het).
(G) Average weights of inguinal (I) and perigonadal (G) WAT and indicated organs of wild-type and Adp heterozygous littermates.
(H) Histological analyses of inguinal (Ing) and perigonadal (Gon) WAT.
(I) Plasma of control and Adp heterozygous cohorts was analyzed for leptin, insulin and triglyceride levels.
(J) GTTs of Adp heterozygous and control siblings (n = 8). Analyses in panels C–J done on 4-month old mice.
*p < 0.05, **p < 0.01, ***p < 0.005 by t-test. N/S not significant. Error bars indicate SEM.
Since adp heterozygous flies were obese, we examined F7 or F8 ICR Adp heterozygotes. We found that male and female Adp heterozygous mice were obese compared to wild-type littermates based upon weight, appearance, NMR fat quantitation, and assessment of explanted fat depots (Figures 6C, 6D, 6E, 6F, and 6G). Other organs, such as the heart or spleen, had similar weights (Figure 6G). Histology showed that the Adp heterozygotes had enlarged adipocytes (Figure 6H). Plasma leptin and insulin levels were significantly elevated in Adp heterozygotes; triglyceride levels were unchanged (Figure 6I). In GTTs, the Adp heterozygotes had a trend towards hyperglycemia, which often did not reach statistical significance (Figure 6J). Thus, Adipose heterozygosity in flies and mice produces an obese phenotype, supporting the notion that Adp is a conserved dosage-sensitive regulator of adipocyte biology.
Adipose Functions in the Nucleus
We explored ADP subcellular distribution by incorporating an N-terminal GFP-tag (Figure 7A). We first confirmed that GFP-Adp remained functional in inhibiting 3T3-L1 adipogenesis (Figure 7B). Then we expressed GFP-Adp and examined subcellular distribution with 5 μm Z-series confocal microscopy. In low, medium, and high expressing cells, GFP-Adp was located in both the cytosol and nucleus with higher levels in the cytosol (Figure 7C). We also GFP tagged the dominant negative AdpC1 domain (Figure 7D); GFP-AdpC1 stimulated adipogenesis like untagged AdpC1 (Figure 7E). Z-series confocal microscopy showed that GFP-AdpC1 was also expressed in both the cytosol and nucleus with nuclear levels greater than cytosolic levels (Figure 7F).
Figure 7. ADP Functions in the Nucleus and Interacts with a Corepressor Complex.
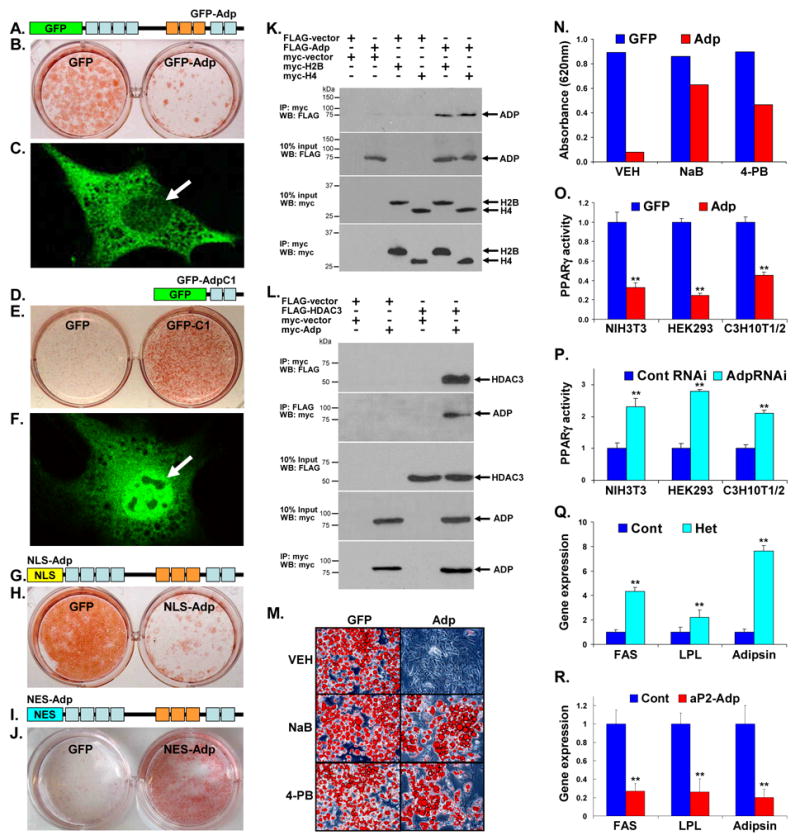
(A) GFP-Adp chimera. WD40 domains: light blue rectangles, TPR domains: orange rectangles, GFP: green rectangle
(B) 3T3-L1s were infected with virus containing either GFP or GFP-Adp, adipogenically induced and Oil Red O stained.
(C) GFP-Adp was introduced into cells and its localization was assessed with confocal microscopy. White arrow indicates nucleus.
(D) GFP-AdpC1 chimera.
(E) NIH3T3s were infected with GFP or GFP-AdpC1 and adipogenesis was assessed with Oil Red O staining.
(F) Confocal microscopic photograph of GFP-AdpC1 expressing cells. White arrow designates nucleus.
(G) Nuclear localization signal (NLS)-Adp chimera. NLS: yellow rectangle.
(H) 3T3-L1s were infected with virus encoding GFP or NLS-Adp, adipogenically induced, and stained with Oil Red O.
(I) Nuclear export signal (NES)-Adp chimera. NES: aqua rectangle
(J) 3T3-L1s were infected with GFP or NES-Adp virus, cultured in media supplemented with insulin, and then stained with Oil Red O.
(K) HEK293s were transfected with a FLAG vector, a myc vector, FLAG-Adp, myc-H2B, or myc-H4 as indicated. After the cells were lysed, part of the homogenates was removed (input) and the remainder immunoprecipitated (IP) with anti-myc antibody. The resultant immunoprecipitates were subjected to Western blots (WB) against the FLAG tag (top panel) or the myc tag (bottom panel). 10% of the homogenate was also evaluated with Western blots using the indicated antibodies.
(L) HEK293s were transfected with a FLAG vector, a myc vector, FLAG-HDAC3, or myc-Adp. The cells were lysed, part of the homogenates was removed and the remainder divided and immunoprecipitated with antibodies directed against either the myc or FLAG epitopes. The resultant immunoprecipitates were subjected to Western blots against the other tag (top two panels). The homogenates were also directly evaluated with Western blots as indicated. Bottom panel is the myc immunoprecipitates Western blotted with myc antisera.
(M) 3T3-L1s expressing either GFP or Adp were adipogenically induced in the presence of vehicle (VEH) or 1.5 mM of HDAC inhibitors sodium butyrate (NaB) or 4-phenylbutyrate (4-PB), and then stained with Oil Red O.
(N) The Oil Red O stain of cells in M was extracted and quantified by measuring absorbance (620nm).
(O) PPARγ luciferase assay: GFP or Adp along with PPARγ, a PPRE-luc reporter, and a renilla luciferase control were transfected into the indicated cell lines and luciferase activity was measured and then standardized with renilla. These normalized values were plotted as PPARγ activity.
(P) The indicated cell lines, expressing control RNAi or Adp RNAi together with PPARγ, PPRE-luc, and renilla, were assayed for luciferase activity as in O.
(Q, R) qPCR analyses of PPARγ target gene expression in gonadal fat of (Q) control and Adp heterozygous mice or (R) control and aP2-Adp transgenic mice. FAS fatty acid synthase, LPL lipoprotein lipase, **p < 0.01.
To identify the compartment in which ADP elicits its anti-adipogenic actions, we targeted ADP either to the nucleus, with a nuclear localization signal fusion (NLS-Adp), or away from the nucleus, with a nuclear export sequence fusion (NES-Adp) (Figures 7G and 7I). NLS-Adp blocked adipogenesis while NES-Adp did not and in some conditions even stimulated adipogenesis, like a dominant negative Adp (Figures 7H and 7J). Thus it is likely the nuclear fraction of ADP that functions to inhibit adipogenesis.
Adipose Binds Histones and HDAC3
We performed a yeast two-hybrid screen with full-length murine Adp and a mouse library, and we isolated multiple independent clones of histone 2B (H2B). We tested whether this interaction occurred in mammalian cells and also tested histone 4 (H4), since other WD40 proteins interact with this pair of histones (Li et al., 2000; Magnaghi et al., 1998; Yoon et al., 2005). We found that FLAG-ADP co-immunoprecipitated with either myc-H2B or myc-H4 (Figure 7K). Several proteins that interact with H2B and H4 function in transcriptional corepressor complexes that contain HDAC3, a regulator of adipocyte biology (Fajas et al., 2002; Fu et al., 2005; Guenther et al., 2000; Li et al., 2000; Yoon et al., 2003; Yoon et al., 2005). We therefore examined whether ADP interacts with HDAC3, and found that these two molecules co-purify. (Figure 7L). These data indicate that H2B, H4 and HDAC3 may exist in complexes that contain ADP and raise the possibility that Adp functions as a transcriptional corepressor.
Next, we attempted to address the functional relevance of ADP and HDAC3 interactions. For this, we infected 3T3-L1s with GFP or Adp virus, adipogenically induced and treated the cells with vehicle or the HDAC inhibitors sodium butyrate and 4-phenyl butyrate, which are limited as they inhibit multiple HDAC family members (Jung, 2001). The HDAC inhibitors significantly reversed the Adp-dependent blockade of adipogenesis (Figures 7M and 7N), suggesting that Adp functions upstream of histone deacetylation during adipogenesis.
If ADP does function in a corepressor complex, it may inhibit key adipogenic transcription factors such as C/EBPs, PPARγ, and SREBP. To investigate this possibility, we assessed the effect of ADP on C/EBP-, PPARγ-, and SREBP-dependent transcriptional reporters. We found that ADP inhibited the action of PPARγ, but not the other factors (Figure 7O, supplemental Figure S4). Conversely, Adp RNAi significantly stimulated PPARγ reporter expression (Figure 7P). These results were consistent with the prior observations that PPARγ target gene expression was altered by Adp levels in cell culture adipogenesis (Figures 2H and 4D). Next, we examined PPARγ target gene expression in fat depots of the Adp heterozygous and the aP2-Adp transgenic mouse models. The levels of expression of all PPARγ targets were increased in Adp heterozygous fat and reduced in aP2-Adp transgenic fat, which may result from a direct effect on PPARγ action or a secondary response to altered fat accumulation (Figure 7Q and 7R).
DISCUSSION
The search to identify molecules that underlie fat accumulation and glucose homeostasis has taken on additional urgency due to the recent dramatic increase in obesity and diabetes (Campbell and Dhand, 2000; Must et al., 1999). Mammalian adipocytes store large amounts of lipid and secrete a variety of hormones that regulate feeding behavior and metabolism (Friedman and Halaas, 1998). The ability to store fat was acquired early in evolution and is essential for survival of multi-cellular animals. Adp encodes an evolutionarily conserved protein that displays functional conservation between invertebrate and mammalian systems. Loss of Adp function leads to increased fat accumulation in worms, flies, mammalian tissue culture, and mice. Conversely, increasing Adp activity blocks fat formation in flies, mammalian cell culture and mice. In the fly model, a brief induction of Adp activity in adult fat tissues reduced fat accumulation. If this phenotypic response is conserved to mammals, the Adp pathway could be a rational target for obesity and diabetes therapies.
The conservation of Adp function appears to extend to dosage-sensitive phenotypes. Adp heterozygous flies have intermediate levels of fat accumulation between wild-type and homozygous mutants, and Adp heterozygous mice are also obese. Such autosomal dominant phenotypes caused by loss-of-function mutations are uncommon and can occur in genes that are key regulators of the process under study, such as the rate limiting enzyme in a metabolic pathway (Wilkie, 1994). Other WD40 repeat proteins also display haploinsufficient phenotypes (Hirotsune et al., 1998; Li and Roberts, 2001; Sidow et al., 1999; Zhang et al., 2004). This feature of WD40 proteins is thought to stem from their role as organizing centers of protein complexes.
Adp null flies were isolated as a naturally occurring obese variant. However, nullizygosity at the D. melanogaster Adp locus engenders negative consequences (Figure 1C) (Doane, 1960a; Ruden et al., 2005). The deleterious effects of Adp loss are also observed in mammals, as the majority of the Adp homozygous mutant mice that we attempted to generate for this study died in utero. We have yet to ascertain the cause of the embryonic lethality, which could result from non-adipose functions as Adp is widely expressed. Since Adp has high levels of expression in the brain and testis these tissues could plausibly be affected and deserve significant scrutiny.
Worms, flies, mice and humans all contain only one copy of Adp. ADP contains 9 protein interaction domains (6 WD40, 3 TPR) and no predicted catalytic domains. Although WD40 proteins have other functions, a common theme is that they act as transcriptional corepressors through interactions with (and connections to) transcription factors, histones, and histone-modifying enzymes (Cerna and Wilson, 2005; Chen and Courey, 2000; Perissi et al., 2004; Yoon et al., 2005). ADP associates with H2B, H4, and HDAC3 raising the possibility that ADP functions in a transcriptional corepressor complex (Guenther et al., 2000; Li et al., 2000; Lorain et al., 1998; Magnaghi et al., 1998; Yoon et al., 2003). HDAC3 corepressor complexes are important in mammalian adipogenesis (Fajas et al., 2002; Fu et al., 2005). PPARγ has been identified as a target of the HDAC3 corepressor and we find that Adp levels can influence PPARγ activity in various contexts. The ability of ADP to regulate PPARγ function may account for at least part of Adp’s anti-adipogenic role and supports the notion that Adp may act in a therapeutically relevant pathway.
Although the mechanism by which Adp reduces mammalian fat storage might involve inhibiting PPARγ, no PPARγ ortholog has yet been identified in flies. So despite the conservation of primary structure and biological function, it is possible that part of Adp’s fat inhibitory mechanisms evolved in concert with the formation of dedicated adipocytes present in higher organisms. Since flies and other invertebrates contain fat but no clear PPARγ homolog, it is likely that Adp functions in a more primordial protein complex, for example the corepressor complex, that functioned to restrain fat accumulation before PPARγ existed.
Invertebrates and vertebrates store fat, which in turn controls many diverse aspects of the life cycle. However, a burgeoning epidemic of obesity and diabetes affects millions and is altering our health care system. Therefore, elucidating the molecules that underlie fat accumulation and glucose homeostasis is an important task. The accumulated data suggest that Adp restrains invertebrate and vertebrate fat storage and does so in a dosage-sensitive manner. The functional conservation from worms to mammals implies that ADP may be a component of an ancient fat regulatory pathway.
EXPERIMENTAL PROCEDURES
Worm studies
Two non-overlapping RNAi constructs targeting C. elegans Adp were generated by PCR amplification of cDNA isolated from wild-type (N2) worms. RNAi and Nile Red stains were as described (McKay et al., 2003).
Fly stocks
The adp60 mutant was a gift of Dr. Doane (Clark and Doane, 1983). Newly eclosed flies reared under identical conditions were cultured for a week with abundant yeast paste before analysis. UAS-Adp stocks were a gift of Dr. Kuhnlein (Hader et al., 2003) and the Dcg-GAL4 fat body driver was described previously (Suh et al., 2006). Dcg-GFP fat body reporter flies were generated by P-element mediated transformation of a plasmid with ~ 10 kb upstream of the ATG of the Drosophila collagen gene (Dcg) fused to GFP. FBI-GAL4 lines were generated by mobilizing the p[Switch] element (gift of Dr. Davis) and screening for lines with specific GFP expression in the fat body after feeding 200 μM RU486 (Sigma) (Roman et al., 2001). FBI-GAL4 drivers were crossed to either UAS-GFP or UAS-Adp and the resulting 5-day old adult progeny, or the salient controls, were fed yeast containing vehicle (1.6% ethanol) or 200 μM RU486 for 5 days.
Fly starvation and triglyceride assays
Adult flies emerging from uncrowded cultures on the same day were collected and cultured for another week under well-fed conditions. Food was removed from cultures of ~100 flies of each sex while providing unlimited water and death was scored daily. Triglyceride quantitation was performed as described (Suh et al., 2006).
Fat body visualization and Nile Red staining
Larvae or adult flies were briefly immersed in methanol prior to microscopic analysis or dissection. For Nile Red, whole flies or dissected fat bodies were fixed in formalin, permeabilized in 0.2% Triton X-100 solution and stained with Nile Red.
Retrovirus production and infection
Standard methods (Suh et al., 2006) were used to generate recombinant retroviruses and to virally transduce 3T3-L1, NIH3T3 and MC3T3-E1 cells.
Cell culture, adipogenic and osteogenic differentiation
Mouse NIH3T3 fibroblasts, 3T3-L1 preadipocytes, MC3T3-E1 preosteoblast cells, and C3H10T1/2 cells were purchased from ATCC and maintained in DMEM or α-MEM [for MC3T3-E1] with 10% calf serum. 3T3-L1 and NIH3T3 cells were induced to undergo adipogenesis as described (McKay et al., 2003; Suh et al., 2006). NIH3T3 cells were cultured on gelatin coated plates, induced for 6 days in insulin, dexamethasone, and IBMX, and then documented after 2 weeks of culture in 10% FBS and insulin. MC3T3-E1 cells were osteogenically differentiated as described (Wang et al., 1999). Sodium butyrate and 4-phenyl butyrate (Calbiochem) were resuspended in sterile water.
RNA extraction, cDNA synthesis and qPCR
Total RNA from mouse tissues or cultured cells was extracted with Trizol (Invitrogen), RNase-free DNAse I-treated, and reverse-transcribed using random hexamers and M-MLV-reverse transcriptase (Invitrogen). Gene expression was measured through real-time PCR analysis using SYBR Green Master Mix reagent (Applied Biosystems, 7500 Real-Time PCR System). Real-time PCR values for gene expression were normalized over endogenous β-actin expression. Real-time primer sequences are available upon request.
Analysis of cell culture lipid accumulation
Lipid droplets were stained with Oil Red O; Oil Red O content was measured spectrophotometrically as previously described (McKay et al., 2003; Suh et al., 2006). To quantify triglyceride levels, cells were lysed in 0.5% SDS/PBS and triglyceride content was measured using the Infinity Triglyceride Reagent (ThermoElectron). Protein concentrations used to normalize triglyceride content were measured with a BCA protein assay (Pierce).
Cell culture RNAi
The indicated cell lines were transfected with either control mU6neo shRNA plasmid or mU6neo-Adp shRNA plasmids that contain the appropriate hairpins to reduce the expression of murine Adp. Stable clones were selected in 400 μg/ml G418 for one week and then the remaining G418-resistant stable clones were pooled together for further experiments. shRNA mediated knockdown of the targeted message was determined by qPCR.
Transgenic mice
aP2-Adp and aP2-AdpC1 transgenic constructs were generated by cloning mouse Adp or the AdpC1 fragment downstream of the 5.4 kb aP2 enhancer (gift of Dr. Spiegelman). Transgenic founders were further bred to establish lines (aP2-Adp), backcrossed two generations into ICR, and then intercrossed or used directly (aP2-AdpC1) for the studies.
Adp mutant mice
Adp mutant gene trap ES cell line RRF015, containing an insertion between the 1st and 2nd coding exons, was purchased from BayGenomics. We confirmed the insertion site and injected the Adp mutant ES cells into C57BL/6J blastocysts to produce chimeric mice. The chimeras were bred to ICR strains and heterozygous mice were backcrossed into ICR for > 6 generations.
Mouse studies
Mice were housed in a 12:12 light:dark cycle. Chow (Teklad) and water were provided ad libitum unless otherwise noted. Body weight was recorded weekly. Total body fat mass of overnight fasted mice was measured by NMR spectroscopy on the Minispec mq spectrometer (Bruker). Food intake and core body temperature were recorded daily for 5 consecutive days in the week prior to sacrifice. Mouse tissues were harvested and weighed before freezing at −80°C for RNA extraction or fixed in formalin for paraffin embedding. For histology, 8 μm sections were stained with hematoxylin and eosin. Ob mutant and C57BL/6J mice were purchased from Jackson Laboratories. For GTTs, overnight fasted mice received a 1.5 g glucose/kg body weight intraperitoneal injection of 75 mg/ml glucose-PBS solution. Tail blood was drawn at the indicated intervals and blood glucose levels were measured with a TrueTrack glucometer. For diet-induced obesity (DIO), we randomized 5-week old inbred C57BL/6J littermates to either normal (4% fat, Teklad) or high fat (60% fat, Research Diets) chow. After four months, the identical fat depots were explanted from all mice in both cohorts and RNA was extracted and analyzed for gene expression with qPCR as described above. For genetic obesity, ob/ob mice and control littermates were provided normal chow (4% fat, Teklad) and at six months of age fat pad gene expression was analyzed as described. Fat depot gene expression was also analyzed in 5-month old inbred C57BL/6J littermates randomized to either ad libitum food or to a 24 hour fast with water provided. Veterinary care was provided by the Division of Comparative Medicine. All animals were maintained under the guidelines of the U.T. Southwestern Medical Center Animal Care and Use Committee according to NIH guidelines.
Yeast two hybrid
The yeast two hybrid screen was done as we described (Peters et al., 1999). Full-length murine Adp was cloned into the pGBKT7 bait vector (BD Biosciences) and transformed into L40 yeast. 1 × 10⁵ clones of a mouse library (pGAD) were screened and several in-frame, independent isolates of H2B were obtained.
Supplementary Material
Acknowledgments
We thank Drs. Douglas Benson, Michael Brown, William Dauer, Ron Davis, Winifred Doane, Ron Evans, Joe Goldstein, Jin Jiang, Steven Kliewer, Ronald Kuhnlein, Achim Luetz, Richard Lu, David Mangelsdorf, Gary Nolan, Eric Olson, Luis Parada, Bruce Spiegelman, and Hongtau Yu for invaluable assistance with techniques, reagents, manuscript preparation, and for helpful discussions. We thank Jim McKay, Wei Tang and members of the Graff lab for expert technical assistance support, reagents, and insights. This work was supported by awards to JMG from the NIH and the NIDDK.
Footnotes
Publisher's Disclaimer: This is a PDF file of an unedited manuscript that has been accepted for publication. As a service to our customers we are providing this early version of the manuscript. The manuscript will undergo copyediting, typesetting, and review of the resulting proof before it is published in its final citable form. Please note that during the production process errors may be discovered which could affect the content, and all legal disclaimers that apply to the journal pertain.
References
- Ashrafi K, Chang FY, Watts JL, Fraser AG, Kamath RS, Ahringer J, Ruvkun G. Genome-wide RNAi analysis of Caenorhabditis elegans fat regulatory genes. Nature. 2003;421:268–272. doi: 10.1038/nature01279. [DOI] [PubMed] [Google Scholar]
- Blatch GL, Lassle M. The tetratricopeptide repeat: a structural motif mediating protein-protein interactions. Bioessays. 1999;21:932–939. doi: 10.1002/(SICI)1521-1878(199911)21:11<932::AID-BIES5>3.0.CO;2-N. [DOI] [PubMed] [Google Scholar]
- Bluher M, Kahn BB, Kahn CR. Extended longevity in mice lacking the insulin receptor in adipose tissue. Science. 2003;299:572–574. doi: 10.1126/science.1078223. [DOI] [PubMed] [Google Scholar]
- Campbell P, Dhand R. Obesity. Nature. 2000;404:631–671. [Google Scholar]
- Cerna D, Wilson DK. The structure of Sif2p, a WD repeat protein functioning in the SET3 corepressor complex. J Mol Biol. 2005;351:923–935. doi: 10.1016/j.jmb.2005.06.025. [DOI] [PubMed] [Google Scholar]
- Chen G, Courey AJ. Groucho/TLE family proteins and transcriptional repression. Gene. 2000;249:1–16. doi: 10.1016/s0378-1119(00)00161-x. [DOI] [PubMed] [Google Scholar]
- Clark AG, Doane WW. Desiccation tolerance of the adipose60 mutant of Drosophila melanogaster. Hereditas. 1983;99:165–175. doi: 10.1111/j.1601-5223.1983.tb00888.x. [DOI] [PubMed] [Google Scholar]
- Djawdan M, Chippindale AK, Rose MR, Bradley TJ. Metabolic reserves and evolved stress resistance in Drosophila melanogaster. Physiol Zool. 1998;71:584–594. doi: 10.1086/515963. [DOI] [PubMed] [Google Scholar]
- Doane WW. Developmental physiology of the mutant female sterile(2)adipose of Drosophila melanogaster. I. Adult morphology, longevity, egg production, and egg lethality. J Exp Zool. 1960a;145:1–21. doi: 10.1002/jez.1401450102. [DOI] [PubMed] [Google Scholar]
- Doane WW. Developmental physiology of the mutant female sterile(2)adipose of Drosophila melanogaster. II. Effects of altered environment and residual genome on its expression. J Exp Zool. 1960b;145:23–41. doi: 10.1002/jez.1401450103. [DOI] [PubMed] [Google Scholar]
- Evans RM. The nuclear receptor superfamily: a rosetta stone for physiology. Mol Endocrinol. 2005;19:1429–1438. doi: 10.1210/me.2005-0046. [DOI] [PubMed] [Google Scholar]
- Fajas L, Egler V, Reiter R, Hansen J, Kristiansen K, Debril MB, Miard S, Auwerx J. The retinoblastoma-histone deacetylase 3 complex inhibits PPARgamma and adipocyte differentiation. Dev Cell. 2002;3:903–910. doi: 10.1016/s1534-5807(02)00360-x. [DOI] [PubMed] [Google Scholar]
- Friedman JM, Halaas JL. Leptin and the regulation of body weight in mammals. Nature. 1998;395:763–770. doi: 10.1038/27376. [DOI] [PubMed] [Google Scholar]
- Fu M, Rao M, Bouras T, Wang C, Wu K, Zhang X, Li Z, Yao TP, Pestell RG. Cyclin D1 inhibits peroxisome proliferator-activated receptor gamma-mediated adipogenesis through histone deacetylase recruitment. J Biol Chem. 2005;280:16934–16941. doi: 10.1074/jbc.M500403200. [DOI] [PubMed] [Google Scholar]
- Gronke S, Mildner A, Fellert S, Tennagels N, Petry S, Muller G, Jackle H, Kuhnlein RP. Brummer lipase is an evolutionary conserved fat storage regulator in Drosophila. Cell Metab. 2005;1:323–330. doi: 10.1016/j.cmet.2005.04.003. [DOI] [PubMed] [Google Scholar]
- Guenther MG, Lane WS, Fischle W, Verdin E, Lazar MA, Shiekhattar R. A core SMRT corepressor complex containing HDAC3 and TBL1, a WD40-repeat protein linked to deafness. Genes Dev. 2000;14:1048–1057. [PMC free article] [PubMed] [Google Scholar]
- Hader T, Muller S, Aguilera M, Eulenberg KG, Steuernagel A, Ciossek T, Kuhnlein RP, Lemaire L, Fritsch R, Dohrmann C, et al. Control of triglyceride storage by a WD40/TPR-domain protein. EMBO Rep. 2003;4:511–516. doi: 10.1038/sj.embor.embor837. [DOI] [PMC free article] [PubMed] [Google Scholar]
- Hirotsune S, Fleck MW, Gambello MJ, Bix GJ, Chen A, Clark GD, Ledbetter DH, McBain CJ, Wynshaw-Boris A. Graded reduction of Pafah1b1 (Lis1) activity results in neuronal migration defects and early embryonic lethality. Nat Genet. 1998;19:333–339. doi: 10.1038/1221. [DOI] [PubMed] [Google Scholar]
- Jung M. Inhibitors of histone deacetylase as new anticancer agents. Curr Med Chem. 2001;8:1505–1511. doi: 10.2174/0929867013372058. [DOI] [PubMed] [Google Scholar]
- Lazar MA. Nuclear receptor corepressors. Nucl Recept Signal. 2003;1:e001. doi: 10.1621/nrs.01001. [DOI] [PMC free article] [PubMed] [Google Scholar]
- Lehrke M, Lazar MA. The many faces of PPARgamma. Cell. 2005;123:993–999. doi: 10.1016/j.cell.2005.11.026. [DOI] [PubMed] [Google Scholar]
- Li D, Roberts R. WD-repeat proteins: structure characteristics, biological function, and their involvement in human diseases. Cell Mol Life Sci. 2001;58:2085–2097. doi: 10.1007/PL00000838. [DOI] [PMC free article] [PubMed] [Google Scholar]
- Li J, Wang J, Nawaz Z, Liu JM, Qin J, Wong J. Both corepressor proteins SMRT and N-CoR exist in large protein complexes containing HDAC3. EMBO J. 2000;19:4342–4350. doi: 10.1093/emboj/19.16.4342. [DOI] [PMC free article] [PubMed] [Google Scholar]
- Lorain S, Quivy JP, Monier-Gavelle F, Scamps C, Lecluse Y, Almouzni G, Lipinski M. Core histones and HIRIP3, a novel histone-binding protein, directly interact with WD repeat protein HIRA. Mol Cell Biol. 1998;18:5546–5556. doi: 10.1128/mcb.18.9.5546. [DOI] [PMC free article] [PubMed] [Google Scholar]
- Magnaghi P, Roberts C, Lorain S, Lipinski M, Scambler PJ. HIRA, a mammalian homologue of Saccharomyces cerevisiae transcriptional co-repressors, interacts with Pax3. Nat Genet. 1998;20:74–77. doi: 10.1038/1739. [DOI] [PubMed] [Google Scholar]
- Makowski L, Boord JB, Maeda K, Babaev VR, Uysal KT, Morgan MA, Parker RA, Suttles J, Fazio S, Hotamisligil GS, Linton MF. Lack of macrophage fatty-acid-binding protein aP2 protects mice deficient in apolipoprotein E against atherosclerosis. Nat Med. 2001;7:699–705. doi: 10.1038/89076. [DOI] [PMC free article] [PubMed] [Google Scholar]
- Mangelsdorf DJ, Thummel C, Beato M, Herrlich P, Schutz G, Umesono K, Blumberg B, Kastner P, Mark M, Chambon P, Evans RM. The nuclear receptor superfamily: the second decade. Cell. 1995;83:835–839. doi: 10.1016/0092-8674(95)90199-x. [DOI] [PMC free article] [PubMed] [Google Scholar]
- McKay RM, McKay JP, Avery L, Graff JM. C. elegans. A model for exploring the genetics of fat Storage. Dev Cell. 2003;4:131–142. doi: 10.1016/s1534-5807(02)00411-2. [DOI] [PMC free article] [PubMed] [Google Scholar]
- Must A, Spadano J, Coakley EH, Field AE, Colditz G, Dietz WH. The disease burden associated with overweight and obesity. JAMA. 1999;282:1523–1529. doi: 10.1001/jama.282.16.1523. [DOI] [PubMed] [Google Scholar]
- Olshansky SJ, Passaro DJ, Hershow RC, Layden J, Carnes BA, Brody J, Hayflick L, Butler RN, Allison DB, Ludwig DS. A potential decline in life expectancy in the United States in the 21st century. N Eng J Med. 2005;352:1138–1145. doi: 10.1056/NEJMsr043743. [DOI] [PubMed] [Google Scholar]
- Perissi V, Aggarwal A, Glass CK, Rose DW, Rosenfeld MG. A corepressor/coactivator exchange complex required for transcriptional activation by nuclear receptors and other regulated transcription factors. Cell. 2004;116:511–526. doi: 10.1016/s0092-8674(04)00133-3. [DOI] [PubMed] [Google Scholar]
- Peters JM, McKay RM, McKay JP, Graff JM. Casein kinase I transduces Wnt signals. Nature. 1999;401:345–350. doi: 10.1038/43830. [DOI] [PubMed] [Google Scholar]
- Poznanski WJ, Waheed I, Van R. Human fat cell precursors. Morphologic and metabolic differentiation in culture. Lab Invest. 1973;29:570–576. [PubMed] [Google Scholar]
- Roman G, Endo K, Zong L, Davis RL. P[Switch], a system for spatial and temporal control of gene expression in Drosophila melanogaster. Proc Natl Acad Sci U S A. 2001;98:12602–12607. doi: 10.1073/pnas.221303998. [DOI] [PMC free article] [PubMed] [Google Scholar]
- Rosen E, Walkey C, Puigserver P, Spiegelman B. Transcriptional regulation of adipogenesis. Genes Dev. 2000;14:1293–1307. [PubMed] [Google Scholar]
- Rosen ED. New drugs from fat bugs? Cell Metab. 2006;3:1–2. doi: 10.1016/j.cmet.2005.12.002. [DOI] [PubMed] [Google Scholar]
- Rosen ED, Spiegelman BM. Molecular regulation of adipogenesis. Annu Rev Cell Dev Biol. 2000;16:145–171. doi: 10.1146/annurev.cellbio.16.1.145. [DOI] [PubMed] [Google Scholar]
- Rosenfeld MG, Lunyak VV, Glass CK. Sensors and signals: a coactivator/corepressor/epigenetic code for integrating signal-dependent programs of transcriptional response. Genes Dev. 2006;20:1405–1428. doi: 10.1101/gad.1424806. [DOI] [PubMed] [Google Scholar]
- Ross SR, Graves RA, Greenstein A, Platt KA, Shyu HL, Mellovitz B, Spiegelman BM. A fat-specific enhancer is the primary determinant of gene expression for adipocyte P2 in vivo. Proc Natl Acad Sci U S A. 1990;87:9590–9594. doi: 10.1073/pnas.87.24.9590. [DOI] [PMC free article] [PubMed] [Google Scholar]
- Ruden DM, De Luca M, Garfinkel MD, Bynum KL, Lu X. Drosophila nutrigenomics can provide clues to human gene-nutrient interactions. Annu Rev Nutr. 2005;25:499–522. doi: 10.1146/annurev.nutr.25.050304.092708. [DOI] [PubMed] [Google Scholar]
- Sidow A, Bulotsky MS, Kerrebrock AW, Birren BW, Altshuler D, Jaenisch R, Johnson KR, Lander ES. A novel member of the F-box/WD40 gene family, encoding dactylin, is disrupted in the mouse dactylaplasia mutant. Nat Genet. 1999;23:104–107. doi: 10.1038/12709. [DOI] [PubMed] [Google Scholar]
- Smith CL, O’Malley BW. Coregulator function: a key to understanding tissue specificity of selective receptor modulators. Endocr Rev. 2004;25:45–71. doi: 10.1210/er.2003-0023. [DOI] [PubMed] [Google Scholar]
- Smith TF, Gaitatzes C, Saxena K, Neer EJ. The WD repeat: a common architecture for diverse functions. Trends Biochem Sci. 1999;24:181–185. doi: 10.1016/s0968-0004(99)01384-5. [DOI] [PubMed] [Google Scholar]
- Soukas A, Socci ND, Saatkamp BD, Novelli S, Friedman JM. Distinct transcriptional profiles of adipogenesis in vivo and in vitro. J Biol Chem. 2001;276:34167–34174. doi: 10.1074/jbc.M104421200. [DOI] [PubMed] [Google Scholar]
- Spiegelman BM, Flier JS. Obesity and the regulation of energy balance. Cell. 2001;104:531–543. doi: 10.1016/s0092-8674(01)00240-9. [DOI] [PubMed] [Google Scholar]
- Suh JM, Gao X, McKay J, McKay R, Salo Z, Graff JM. Hedgehog signaling plays a conserved role in inhibiting fat formation. Cell Metab. 2006;3:25–34. doi: 10.1016/j.cmet.2005.11.012. [DOI] [PubMed] [Google Scholar]
- Tong Q, Dalgin G, Xu H, Ting CN, Leiden JM, Hotamisligil GS. Function of GATA transcription factors in preadipocyte-adipocyte transition. Science. 2000;290:134–138. doi: 10.1126/science.290.5489.134. [DOI] [PubMed] [Google Scholar]
- Wang D, Christensen K, Chawla K, Xiao G, Krebsach PH, Franceschi RT. Isolation and characterization of MC3T3-E1 preosteoblast subclones with distinct in vitro and in vivo differentiation/mineralization potential. J Bone Miner Res. 1999;14:893–903. doi: 10.1359/jbmr.1999.14.6.893. [DOI] [PubMed] [Google Scholar]
- Wilkie AO. The molecular basis of genetic dominance. J Med Genet. 1994;31:89–98. doi: 10.1136/jmg.31.2.89. [DOI] [PMC free article] [PubMed] [Google Scholar]
- Yoon HG, Chan DW, Huang ZQ, Li J, Fondell JD, Qin J, Wong J. Purification and functional characterization of the human N-CoR complex: the roles of HDAC3, TBL1 and TBLR1. EMBO J. 2003;22:1336–1346. doi: 10.1093/emboj/cdg120. [DOI] [PMC free article] [PubMed] [Google Scholar]
- Yoon HG, Choi Y, Cole PA, Wong J. Reading and function of a histone code involved in targeting corepressor complexes for repression. Mol Cell Biol. 2005;25:324–335. doi: 10.1128/MCB.25.1.324-335.2005. [DOI] [PMC free article] [PubMed] [Google Scholar]
- Zhang Z, Kostetskii I, Moss SB, Jones BH, Ho C, Wang H, Kishida T, Gerton GL, Radice GL, Strauss JF., 3rd Haploinsufficiency for the murine orthologue of Chlamydomonas PF20 disrupts spermatogenesis. Proc Natl Acad Sci U S A. 2004;101:12946–12951. doi: 10.1073/pnas.0404280101. [DOI] [PMC free article] [PubMed] [Google Scholar]
Associated Data
This section collects any data citations, data availability statements, or supplementary materials included in this article.