Abstract
Quantitative histomorphometry is the current gold standard for objective measurement of nerve architecture and its components. Many methods still in use rely heavily upon manual techniques that are prohibitively time consuming, predisposing to operator fatigue, sampling error, and overall limited reproducibility. More recently, investigators have attempted to combine the speed of automated morphometry with the accuracy of manual and semi-automated methods. Systematic refinements in binary imaging analysis techniques combined with an algorithmic approach allow for more exhaustive characterization of nerve parameters in the surgically relevant injury paradigms of regeneration following crush, transection, and nerve gap injuries. The binary imaging method introduced here uses multiple bitplanes to achieve reproducible, high throughput quantitative assessment of peripheral nerve. Number of myelinated axons, myelinated fiber diameter, myelin thickness, fiber distributions, myelinated fiber density, and neural debris can be quantitatively evaluated with stratification of raw data by nerve component. Results of this semi-automated method are validated by comparing values against those obtained with manual techniques. The use of this approach results in more rapid, accurate, and complete assessment of myelinated axons than manual techniques.
Introduction
Nerve histomorphometry, the measurement of attributes on a prepared nerve section, has long provided important contributions to peripheral nerve research. The ability to quantitate nerve features allows a potentially unbiased way to evaluate nerve characteristics in cases such as regrowth or pathology, and yields data less subject to variability than more subjective measures such as functional recovery. Despite their importance and widespread use, histomorphometric techniques vary widely.
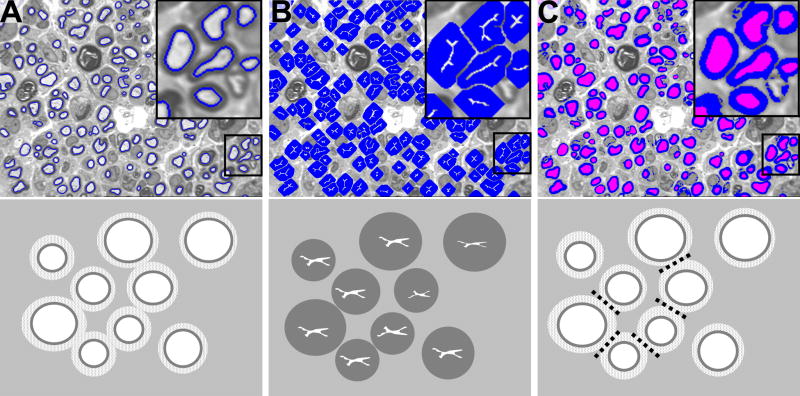
The ideal histomorphometry method is accurate, complete, efficient, easy to use, and inexpensive. Depending on a researcher's needs, these attributes are weighed differently and different programs are produced, perhaps with particular attention to cost (Urso-Baiarda, 2006) or to speed (Romero, 2000). Here we present the histomorphometry method our lab implemented in 1989 and has continued to refine, to evaluate both non-injured and pathological nerve sections during our work on peripheral nerve regeneration (FIGURE 1). This approach is driven by a desire to evaluate by direct measurement as many nerve attributes as possible and to address the fiber debris and nonviable fibers frequently seen in our pathological nerve sections using a highly customizable, rapid, computer-based technique.
Figure 1.
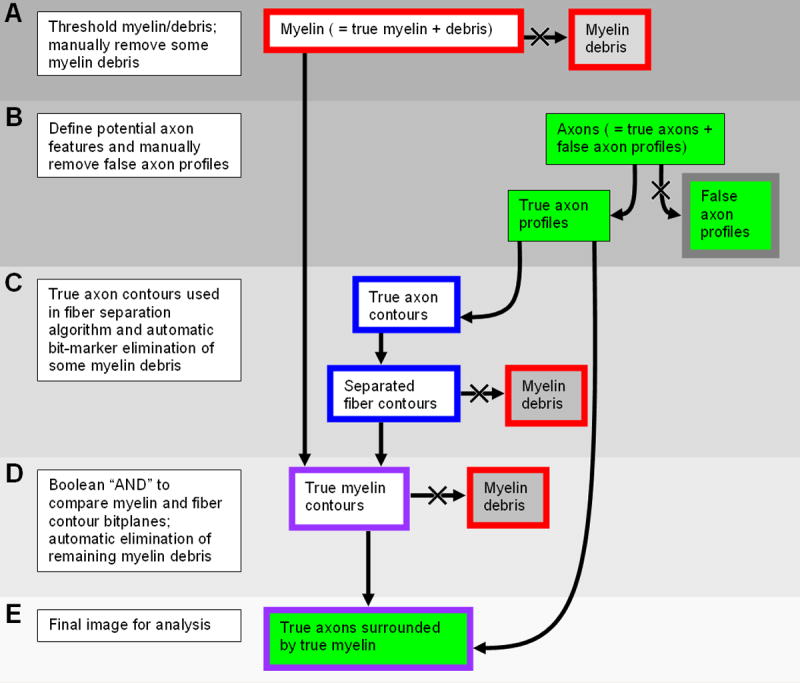
Image Processing Algorithm. Outline and background colors of components correspond to the bitplane colors as described in the text. For a detailed description, please refer to the following subsections in the semiautomated histomorphometry section of Materials & Methods: A, Thresholding and manual fiber debris elimination; B, Axon definition and manual feature elimination; C and D, Fiber separation and further delineation of nonmyelinated profiles; E, Mathematical morphometry.
We customized a semi-automated binary imaging analysis method to avoid the limitations seen with other techniques such as the active contour model (Fok, 1996) or common clustering technique (Costa, 1997). Often in peripheral nerve analysis, we encounter differing nerve fibers sizes, non-neural elements, and other thresholded gray-level profiles which are not well characterized and therefore can result in significant error during analysis. In the active contour model, fibers in close proximity may not be separated and nonviable fibers are not distinguished from viable ones. As a result, there is little verification of the identity of fibers and false positives can arise. A similar critique pertains to the clustering technique. In this method, the nearest neighbor approach is used as an automatic separation mechanism. In contrast to the axon-based method of nerve fiber separation, the older cluster method does not make use of clearly discrete axons; it instead uses the whole fiber for identification. The cluster method has not been formally compared with axon-based counting in the literature, but in our experience, it is prone to undercounting of fibers and is therefore less robust. We present and validate our novel approach to nerve morphometry, a method that is fast, reliable, facile, and available to peripheral nerve laboratories. Most importantly, our method is the only published technique assessed and validated with pathologic nerve sections.
Materials & Methods
Adult male Lewis rat (Harlan Sprague–Dawley, Indianapolis, IN) sciatic nerves were used in this study. All sections were randomly selected from prior experiments evaluating non-injury and pathologic conditions which had the approval of the animal studies committee at our institution. Selected nerve models included: an un-injured sciatic nerve, a section distal to a transection site one month after repair, and a section of a nerve allograft after three months in situ in an animal treated with FK506.
Tissue preparation
Harvested nerves were fixed in 3% EM grade glutaraldehyde (Polysciences Inc., Warrington, PA) at 4° C, postfixed with 1% osmium tetroxide and serially dehydrated in ethanol. Specimens were embedded in Araldite 502 (Polysciences), and cut into 1-um cross-sections with an ultramicrotome (LKB III Produkter A.B., Bromma, Sweden). Sections were stained with 1% toluidine blue dye, and mounted on slides for imaging. It is important to note that excellent fixation is required for accurate analysis.
Equipment
A Hitachi CCD KP-M1AN digitizing camera was mounted on a Leitz Laborlux S microscope with a manually-controlled stage. A 100X oil immersion objective lens (Leitz) was used to produce a digital image at a final magnification of 1000X, with a pixel size of 0.125μm.
The Leco IA32 Image Analysis System (Leco, St. Joseph, MI), and its earlier versions, has been used in our lab since 1989. Originally developed for analysis of compound metals, the program's measurement capabilities can be naturally extended to address nerve features. Although measurement of properties relevant to metallurgy such as grain size and porosity are built into the program, its true strength lies in the ability of the user to compose custom calculation routines (macros), expanding its analytical potential to nerve parameters.
The operator programs macros that use binary imaging with eight layers (called bitplanes) and familiar Boolean logic operators to produce artificially colored maps. Bitplanes are visibly superimposed over the original grey image, and any of the eight bitplanes can be displayed in any combination. The program can calculate descriptive parameters about contiguous objects in the binary bitplane, including area, maximum and minimum diameters, and sieve diameter. Data is returned in the form of parameters describing each individual contiguous object. Different calculation routines can return information about myelin, axons, fibers, or virtually any other feature that can be entered onto a binary bitplane. Because all calculations are performed on the binary images in the program's eight bitplanes, the original image is never modified and can easily be referenced to ensure that both automatic and manual object definition is accurate and complete.
The Leco program includes most metallurgical analysis routines, but an operator is required to assemble custom macros to evaluate nerve. Macro development is straightforward and easily performed by an experienced operator. Once the user-defined calculation routines are properly assembled, a nerve fiber can be analyzed by simply running the routine. The customized macros are available upon request. An individual familiar with nerve morphology can operate the program with minimal training.
The Leco software is a highly specialized software package that offers image processing techniques that can be implemented more easily than in the more common Matlab or C programming language. For example, dilation done in the Leco software is performed without extensive additional codes explaining the shape to be dilated; the Leco software has intelligent macros that implement the dilation code quickly. An experienced user of Matlab or C would be needed to code this process to perform the operation, but it may be possible to approximate this program using these alternative platforms. Another advantage of the Leco system is that when the macros have been assembled, an operator with no programming background can make minor changes to the procedure as required. For example, when a nerve is made up of unusually large fibers the number of dilations needed to separate fibers can be increased.
Semiautomated histomorphometry
Thresholding
Images are acquired with a monochrome camera with pixel values ranging from 0 (black) to 255 (white) (FIGURE 2A). The operator manually sets a threshold level below which all dark (myelin) features fall. Those pixel values that are less than the threshold value correspond to the myelin features which are highlighted by the computer in red on the first binary bitplane. The operator can manually change the highlighting of different objects, which is essential in complex specimens (FIGURE 2B).
Figure 2.
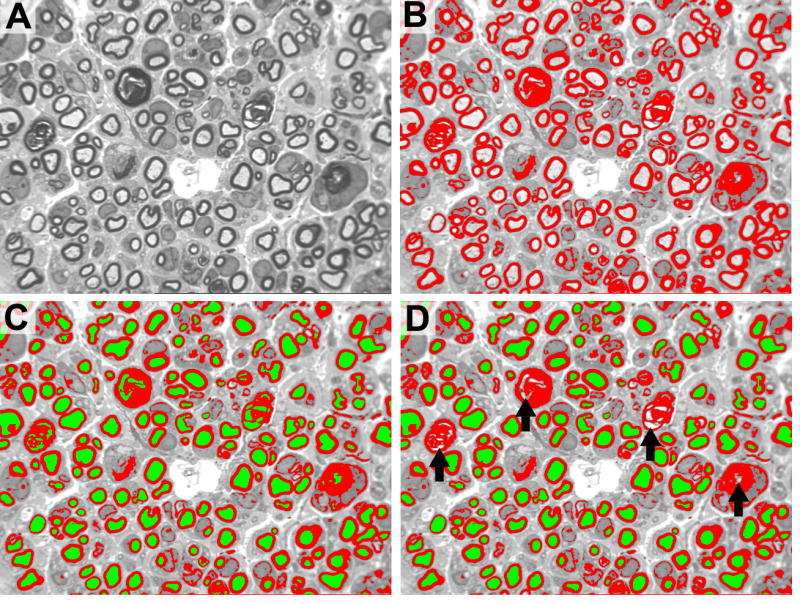
A. Original gray scale image. B. Red myelin bitplane. During the initial manual myelin thresholding step, all gray level profiles are colored red. C. Axon bitplane. All features with myelin thresholded are colored green. D. Manual elimination of non-axon features initially colored green by the program. Black arrows demonstrate areas where incorrect axon identification is manually eliminated.
The thresholding technique to define myelin has been used in several previously described histomorphometry methods (Torch, 1989; Usson, 1991; Vita, 1992; Auer, 1994; Romero, 2000; Urso-Baiarda, 2006; Silva, 2007). Accurate thresholding is perhaps the most essential step in the program; under-thresholded images will underestimate myelin area, and over-thresholded images will overestimate myelin area secondary to excessive highlighting of nonmyelin features.
The Leco software allows the user to view the thresholding performed with a wide range of user versatility as made possible by a sliding threshold. This dynamic thresholding capability markedly increases the precision of analysis. Additionally, subjectivity has not proven to be a significant problem with this technique because we routinely review the initial thresholding using the initial gray level picture. Subsequent binary imaging analysis is done in a separate imaging buffer. Most automated systems fail to normalize against neural tissue and do not allow adjustment for section thickness, staining technique, and heterogeneity of tissue between field areas of specimens which can lead to needless variability. One exception is the auto-thresholding technique presented by Romero and colleagues (Romero, 2000), which thresholds based on a local intensity threshold. Although we chose not to include an auto-thresholding step, this would be a reasonable addition to our procedure, although not necessary to ensure the low degree of inter-observer variability seen with operator thresholding as reported here.
Manual fiber debris elimination
The operator is now given the opportunity to manually eliminate the highlighting of non-myelin features. Most of the fiber debris (also highlighted in red) will be automatically eliminated later in the program based on the assumption that “myelin features” must surround “axon features”. If a dark, non-myelin feature surrounds a lighter area, and the lighter area is not later manually eliminated (see Manual feature elimination), the non-myelin feature and its enclosed area will be automatically counted by the software as an axon/myelin feature. Manual elimination at this step and the subsequent “axon” elimination step prevents erroneous inclusion of non-fiber features.
Axon definition
Axons are defined as areas that are both not myelin and not background. A Boolean “not” logic operation is used to identify background. First we produce a second (green) bitplane by taking the inverse of the myelin (red) bitplane which is our original thresholded image; so if pixels are “not” in bitplane 1 then they are copied to bitplane 2. Bitplane 2 is the new and separate bitplane identifying both the background and the axon areas. The large contiguous background feature is then filtered out based on area size, reducing the second bitplane's contents to green areas representing axons. Subsequently, when the myelin and axon bitplanes are viewed together the image will have axons represented in green, surrounded by myelin features represented in red (FIGURE 2C).
Manual feature elimination
It is not uncommon for other features in a nerve, such as cell nuclei, nonviable fibers, and irregular fiber debris, to fit the computer's definition of a fiber: a light area surrounded by a dark area. The operator is given the opportunity to eliminate non-axon features highlighted on the green bitplane (FIGURE 2D). This is done with considerable comparison to the original image, because the highlighting obscures the details which indicate to the operator whether a feature is a viable fiber or not. After this manual intervention, the operator has had the opportunity to eliminate manually both non-axon and non-myelin features; the red and green bitplanes should now only highlight myelin, viable axons, and myelin debris, which is eliminated automatically later in the program.
Fiber separation
As an artifact of the thresholding process, closely opposed fibers may appear merged on the thresholded myelin bitplane (FIGURE 2A). Applications which separate myelin contours are required to prevent merged features from being miscounted by the software. While most semiautomated methods of histomorphometry incorporate manual separation of fibers by the operator, Euclidean distance transformation, based on the brightness “contour” from one myelin sheath to another, has been successfully used (Romero, 2000). Because of the binary nature of our analysis, and the frequency of confounding fiber debris in our samples, we found a dilation algorithm to be more accurate and less subject to error.
First, the software uses the axon contours defined on the green bitplane, dilates them by two pixels, and moves the dilated two-pixel contour to a third, blue bitplane (FIGURE 3A). This produces a bitplane in which a two-pixel line is drawn around the inner perimeter of each myelin feature.
Figure 3.
Bitplane images and corresponding schematic of the binary imaging process used to achieve fiber separation. A. Initial myelin separation step. Axons, rather than full fiber circumference, are used to identify distinct nerve fibers and overcome the problem of myelin overlap. A 2-pixel overlay of axon onto the myelin maintains the shape and orientation of the profile. B. Ultimate dilation. Axons are maximally dilated without overlap, thereby modeling the dimensions of the myelin surrounding these axons. C. Separated myelin contours. These dilated axons are then superimposed on the formerly identified myelin profiles and Boolean logic is used to reconstitute original myelin shape and configuration. The original myelinated nerve fibers are accurately represented and effectively separated.
The Leco program has an operation called ultimate dilation, wherein a feature can be dilated by successive iterations (the number of which is defined by the user) until it almost intersects a nearby feature. The dilation is then stopped, defining a line of separation between the two features. The ultimate dilation is performed on the contours in the third bitplane (FIGURE 3A). This expands the artificially defined myelin area, stopping before it hits an adjacent expanding feature (FIGURE 3B). Then, using the Boolean “AND” command, the red myelin bitplane is compared with the blue dilated myelin contour bitplane, and regions that were defined as myelin on the initial thresholding step are moved to a fourth bitplane (FIGURE 3C). Because the myelin separation step begins by using contours defined from the axon bitplane, the inner myelin perimeter is produced by a two-pixel dilation of the axon perimeter resulting in the separation of the myelin. The myelin contours thus retain their original shape, but are separated at their points of intersection (FIGURE 3C).
Further Delineation of Nonmyelinated Profiles
After fiber separation is completed, further refinement is achieved using a bitmarker plane function. This step allows for filtering out of debris that has intensity comparable to that of myelin. A two pixel bitplane is generated based upon the outer perimeter of the axon resulting in an overlap with the myelin (FIGURE 4A). This bit-marker step identifies axons with the corresponding myelin for future measurement. Fiber debris and other non-axon features are eliminated (FIGURE 4B). Automatic elimination of fiber debris is extremely helpful when evaluating complex nerves, such as those exhibiting Wallerian degeneration and subsequent regeneration.
Figure 4.
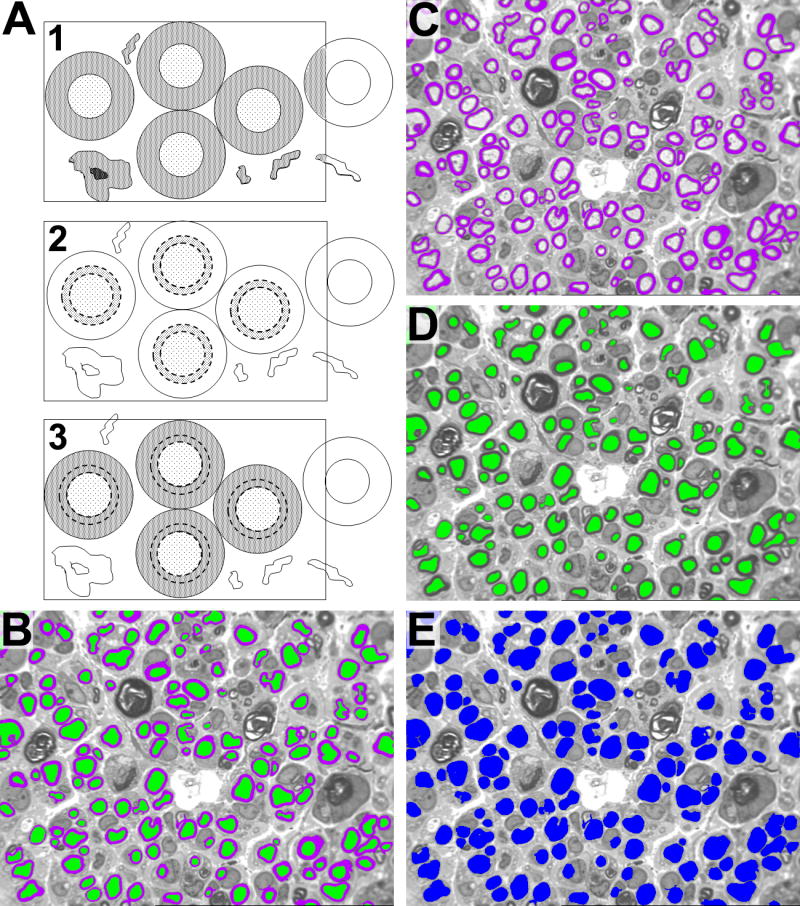
A1. Final delineation of myelin from debris and other background. Myelin profiles are initially identified based on intensity only. As a result, debris, cellular infiltrate, and other background with similar intensity to myelin is also identified. A2. The axons are dilated by adding a 2-pixel rim (dotted lines). This dilated rim, which straddles the axon/myelin interface, is called a bitmarker. The bitmarker is then fused with the axon to create a source bitplane. A3. The source bitplane is then transposed onto the myelin-intensity profiles. If the source bitplane is in contact with a myelin-intensity profile, then myelin is confirmed. If the myelin-intensity profile fails this test, it will be filtered out. Myelin is thus counted only if its axon is in the region of interest. B. Final Image for Analysis after automatic fiber debris elimination. C. Image used to measure myelin features. D. Image use to analyze axon features. E. Image used to measure fiber features by combining bitplanes from image C and D utilizing Boolean logic.
Mathematical morphometry
The final images, on three separate binary bitplanes, are: (1) separated myelin contours, (2) verified axons, and (3) verified fibers (axon plus myelin) (FIGURE 4C-E). The software can evaluate each contiguous feature in each separate bitplane, directly measuring the following feature parameters: myelin area, axon area, fiber area, axon diameter, fiber diameter, and fiber count. Fiber and axon perimeters can also be directly measured if desired. Other parameters can be calculated from measured data; fiber density: count number of features divided by the true area encompassed by the image, myelin thickness: axon diameter subtracted from the fiber diameter, and g ratio: axon diameter divided by fiber diameter.
Note that no assumption of axon or fiber circularity is ever made. This assumption is universally erroneous in our experience, and introduces unnecessary error. The Leco program can measure a sieve diameter as well as maximum and minimum diameters of each fiber. The sieve diameter is more closely correlated with axon area than either the maximum or minimum diameter of the axon (Orgel, 1980), and we regard it as a more accurate way to quantitate axon sizes.
An additional strength of our program is its ability to quantitate myelin fiber debris, although this must be done manually. This is an important function because fiber debris has been shown to deter axon regeneration, and may be an indicator of a nerve's potential for regrowth (Genden, 2002).
We have also modified the program to allow for manual measurement of unmyelinated fibers when evaluating images with electron microscopy. Although morphometry of unmyelinated fibers with the Leco program is comparable in speed and operator fatigue to the digitizing tablet method, the Leco program allows the operator to quantify peripheral nerve features on electron micrographs. Stereology offers comparable assessment of fiber distribution in a non-biased manner, although it is more expensive and requires a similar amount of manual measurement procedures (Dorph-Petersen KA, 2000).
Output
Over 20 parameters can be directly measured, and from these basic measurements further values can be derived with statistics for graphical representations. For peripheral nerve morphometry; fiber width and area, axon width and area, myelin area, and fiber debris (manual) are measured. From this information, myelin width, fiber density, g-ratio, fiber distribution and percent nerve can be mathematically derived. The program will sum data over as many microscopic fields as desired and output the distributions in a template format.
Comparison of Our Semi-Automated Method to Manual Quantification of Nerve Parameters
The semiautomated method of histomorphometry described above was compared with a manual method based on the digitizing tablet. Digitizing tablets were used extensively before the availability of robust computing power, and have been used to validate previously published semiautomated histomorphometric methods (Usson, 1991; Vita, 1992; Urso-Baiarda, 2006; Silva, 2007). For evaluation on the digitizing tablet, a photomicrograph of a non-injured sciatic nerve section, taken at 1000X and comprising approximately 100 axons, was printed on an HP Laserjet 4350n printer. A digitizing tablet (Summasketch II+, Summa Inc., Seattle, WA) and SigmaScan v. 3.90 (Jandel Scientific, Corte Madera, CA) software were used by one observer to manually trace fiber area and sieve diameter.
The semiautomated method described above was also used to measure fiber area and sieve diameter for comparison with the digitizing tablet measurements. Measurements were taken for each axon by both methods and compared graphically. Fiber area and diameter were selected as representative two- and one-dimensional measures; other nerve features (e.g. axon area and diameter, myelin area) are measured in the same way by the Leco software. Manual counting was performed by five observers on three printed photomicrographs: a non-injured sciatic nerve section, a section distal to a transection site one month after repair, and a section of a nerve allograft after three months in situ. Manual counts were compared with those obtained by semiautomated analysis. Semiautomated analysis was performed by four observers on 30 digital photomicrographs, including the three used for manual counting, plus an additional nine images from each of the three nerve conditions. Findings were compared to address reproducibility among the four observers.
Statistical analysis
Statistical analysis was performed using SAS statistical software. A p-value of 0.05 was considered statistically significant. Counts obtained by the manual method were compared with those obtained with the semiautomated method using an unpaired Mann-Whitney U test. Cumulative descriptive data (mean fiber width and area) for each of the three nerve conditions were compared between observers using analysis of variance, followed by Tukey's Studentized Range (HSD) tests.
Results
Fiber area and sieve diameter as measured with the semiautomated method were compared to measurements obtained manually using a Bland-Altman plot (Figure 5A, B). A single photomicrograph of uninjured sciatic nerve section, encompassing 85 complete fibers, was assessed. There was no apparent directional shift in data obtained with the semiautomated method for a range of fiber sizes from the same photomicrograph (Figure 6 A, B). Correlation with manually-measured sieve diameter appears to worsen slightly at larger fiber diameters. The two methods produced considerably different measurements when assessing fibers cut through a cleft of Schmidt-Lantermann, due to the thresholding procedure (Figure 7). There were no significant differences between measurements of average fiber diameter or area obtained by four observers using the semiautomated method to evaluate 10 different photomicrographs from each nerve condition (uninjured, cut-and-repair, and allograft).
Figure 5.
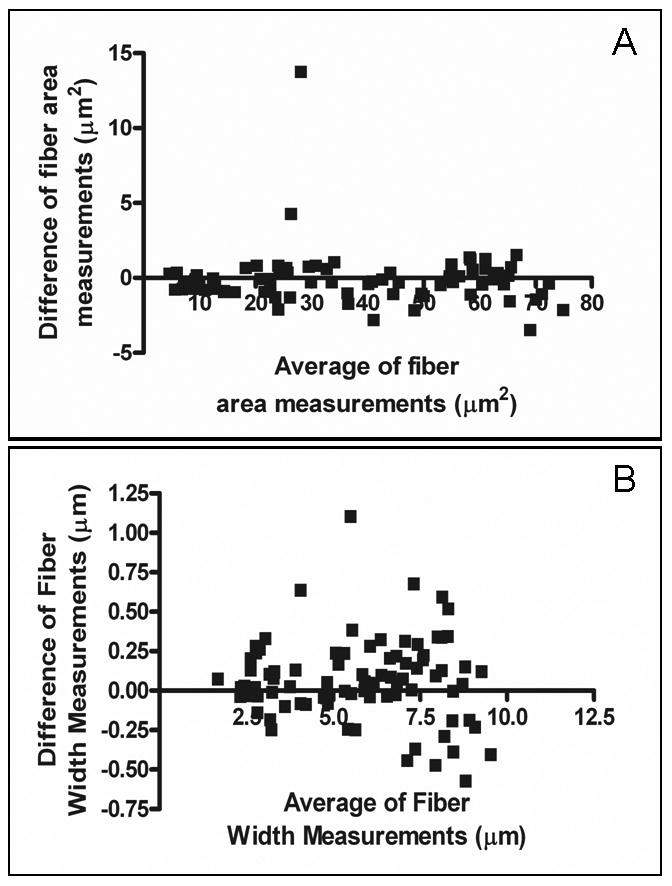
Verification of concordance of manual versus digital measurements using a Bland-Altman plot. The absolute difference in the measurements generated by manual versus digital bitplane analysis are shown for (A) fiber area measurements and (B) fiber width.
Figure 6.
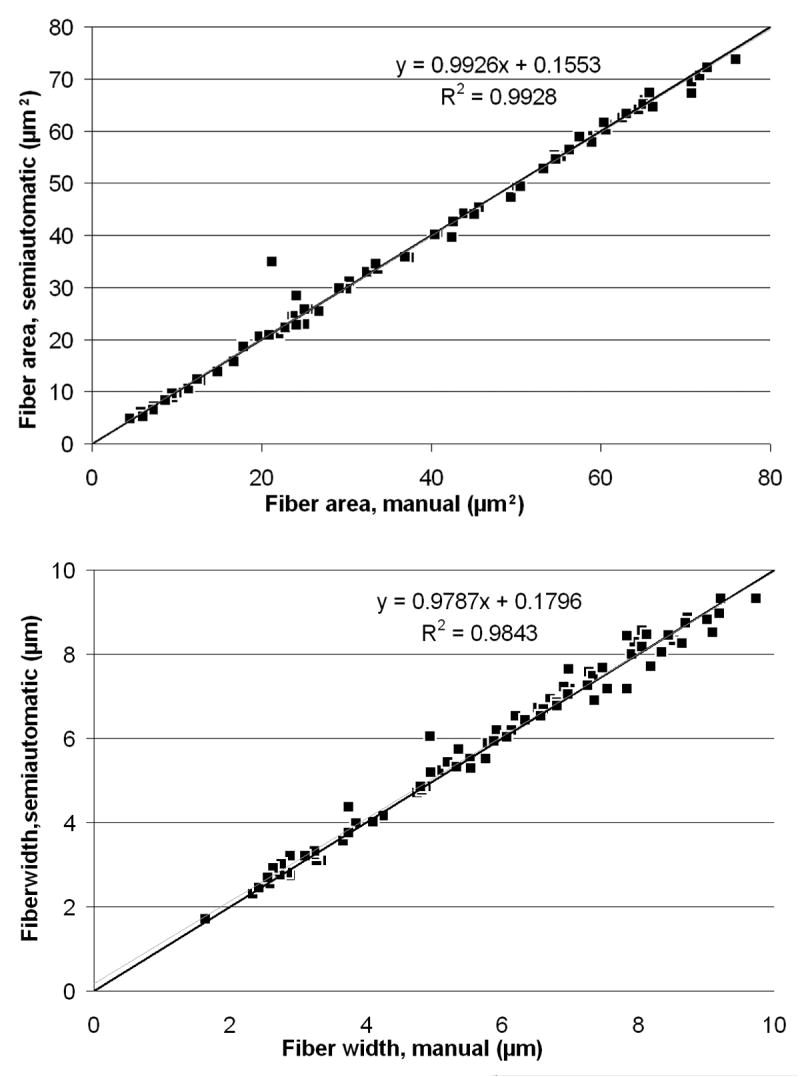
Regression Analysis. A. A comparison of fiber area between manual and semiautomated methods. B. A comparison of fiber width between manual and semiautomated methods. In both images, the black line is y=x; the blue line is the line of best fit for the data, for which the equation and correlation coefficient are displayed on the graph.
Figure 7.
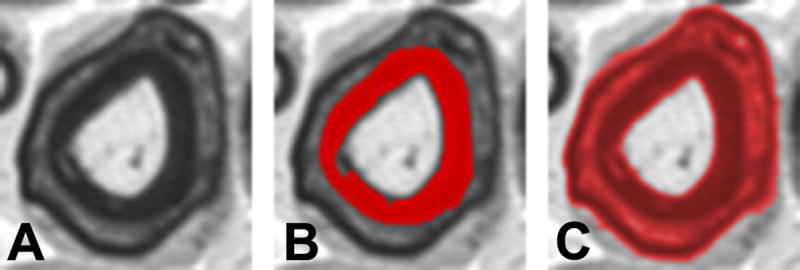
Analysis of Schmidt-Lantermann incisures (clefts). A. Schmidt-Lantermann incisures, which are often attributed to compression injury, appear as concentric layers of myelin with an interposed layer of myelin lamina. B. For standard histomorphometric analysis, the inner myelin ring is used for measures of myelin thickness, as this maintains the original axon-myelin relationship. C. Threshold adjustment can be used to identify Schmidt-Lanterman clefts for specific study of this histopathological entity. Conventional image analysis systems will fail to identify these clefts, and as result the average myelin thickness is distorted due to overestimation of myelination among fibers with these incisures.
When allowing for variation between observers, manual fiber counts were not significantly different than those obtained with the semiautomated method (Table I). Maximum variability in semiautomated counts from a single image ranged from 3.5% in non-injured nerve to 9.1% in a three month allograft specimen; variability in manual counts from the same images ranged from 10.1% in non-injured nerve to 17.3% in the three month allograft. Additionally, when considering whole-nerve characteristics obtained from ten randomly-selected fields from a single nerve, differences in semiautomated counts varied 4.5% or less between observers in both non-injured and pathological nerve sections.
Table I.
Fiber counts obtained with the semiautomated method as compared to those obtained manually are presented as the mean ± standard deviation of counts from 5 observers for the manual method and 4 for the semiautomated. P-values are reported for a Mann-Whitney U test.
| Nerve section | Semiautomated | Manual | P value |
|---|---|---|---|
| Non-injured sciatic | 114 ± 1.83 | 109 ± 4.32 | 0.062 |
| 1 month cut and repair | 116 ± 3.30 | 112 ± 4.69 | 0.171 |
| 3 month graft | 164 ± 6.38 | 164 ± 7.05 | 0.966 |
Discussion
As compared with manual measurement by digitizing tablet, the method of semiautomated nerve histomorphometry described here is both accurate and precise when evaluating area and diameter of nerve features in non-injured and pathological sections. When evaluating larger fiber diameters, there appears to be less correlation between the manual and semiautomated methods. We suggest that this disparity is likely due to the difficulty of manually obtaining an accurate sieve diameter in a large near-circular axon.
Clefts of Schmidt-Lantermann, which appear as a fissure in the myelin surrounding an axon, result from either a compression injury or the plane of section passing through a larger region of myelinating Schwann cell cytoplasm near a node of Ranvier. A search of the literature yielded no standard practice as to whether the inner or outer apparent myelin contours are measured. Depending on thresholding and myelin editing by the operator, the semiautomated method described here could be used to measure either the inner or outer contour. However, we routinely measure the inner myelin contour because we believe the outer contour is a result of a compressive phenomenon. If a consistent technique is applied in dealing with the infrequently encounter clefts, then measurement error can be minimized.
Four observers, three newly trained to the application of the semiautomated technique, returned the same descriptive characteristics for three different nerve conditions, suggesting excellent reproducibility even among inexperienced operators. No other method of histomorphometry described in the literature has used pathological nerve sections for its published evaluation, despite the extreme importance of measuring pathological sections with approximately the same rapidity and accuracy as non-injured sections. Our data, as well as our 18 years of experience with this histomorphometry technique, demonstrate this method's value for measurement of a variety of nerve conditions (Atchabahian, 1998; Grand, 2002; Brenner, 2004; Nichols, 2004; Fox, 2005; Hess, 2007).
Counts obtained manually were not statistically different from those obtained by the semiautomated method. The semiautomated method has the greater advantage of less variability between observers, which amounted to a difference of 4.5% or less for whole-nerve measurements. This is less than the variability between manual and semiautomated counts obtained by other methods (Usson, 1991; Urso-Baiarda, 2006). The novice observers only required one hour of training before becoming comfortable using the software suggesting that limited training is needed to produce accurate, precise results using our semiautomated method. This suggests that reproducible results could be easily obtained by different operators both within and among research laboratories allowing for standardization of nerve morphometry in the research community.
To avoid sampling bias, it is necessary to sample from 10 to 50% of the nerve fiber population in a nerve under study, so a rapid method of histomorphometry is highly desirable (Torch, 1989). The semiautomated method described here requires approximately 20 minutes for a trained observer to evaluate 1000 fibers and obtain data stratified by nerve component (fiber distribution), a complete statistical analysis, and a graphical representation of fiber characteristics. We are currently investigating the integration of our approach with stereology, a statistical method of sampling morphological parameters from specimens with a large area precisely and without bias (Larsen, 1998). We feel that the combination of stereology techniques with semiautomated binary imaging analysis will likely emerge as the gold standard of nerve morphometry.
The greatest drawback of our technique is the considerable cost of the proprietary Leco software. The training required to produce the customized macros that make the Leco program so versatile is also considerable, particularly for someone with little previous programming experience; however, the custom macros are available upon request. The cost and effort have been well worthwhile for our lab's peripheral nerve research focus, which requires histomorphometry of both light and electron microscope images to obtain or confirm most of our published results. A lab that requires less detailed histomorphometric analysis may be better served with a less expensive, simpler method.
In conclusion, we have found that the Leco morphometry software can be well adapted to measure characteristics of nerve histological sections precisely, accurately and rapidly (Nichols, 2004; Fox, 2005). Our program thoroughly analyzes nerve components by direct measurement, produces data that is very reproducible between observers, and requires little training for proficiency. It also has the asset of being highly customizable, and, as in our research laboratory, an experienced operator will likely find it useful for nerve morphometry for many years.
Acknowledgments
This study was funded, in part, by a National Institutes of Health grant awarded to Dr. Susan Mackinnon, (RO1 grant NS051706-01A2) and a training grant obtained by Dr. John G. Neely, MD (T32DC000022-20). This material was presented at the American Society for Peripheral Nerve on January 14, 2007 in Rio Mar Puerto Rico.
Footnotes
Publisher's Disclaimer: This is a PDF file of an unedited manuscript that has been accepted for publication. As a service to our customers we are providing this early version of the manuscript. The manuscript will undergo copyediting, typesetting, and review of the resulting proof before it is published in its final citable form. Please note that during the production process errors may be discovered which could affect the content, and all legal disclaimers that apply to the journal pertain.
References
- Atchabahian A, Genden EM, Mackinnon SE, Doolabh VB, Hunter DA. Regeneration Through Long Nerve Grafts In The Swine Model. Microsurgery. 1998;18:379–382. doi: 10.1002/(sici)1098-2752(1998)18:6<379::aid-micr7>3.0.co;2-5. [DOI] [PubMed] [Google Scholar]
- Auer RN. Automated nerve fibre size and myelin sheath measurement using microcomputer-based digital image analysis: theory, method and results. J Neurosci Methods. 2004 Mar;51(2):229–38. doi: 10.1016/0165-0270(94)90015-9. [DOI] [PubMed] [Google Scholar]
- Brenner MJ, Lowe JB, Fox IK, Mackinnon SE, Hunter DA, Darcy MD, Duncan JR, Wood P, Mohanakumar T. Effects of Schwann Cells and Donor Antigen on Long-nerve Allograft Regeneration. Microsurgery. 2004;24:1–10. doi: 10.1002/micr.20083. [DOI] [PubMed] [Google Scholar]
- Costa AF, Mascarenhas ND, De Andrade Netto ML. Cell Nuclei Segmentation in Noisy Images Using Morphological Watersheds. Proc SPIE. 1997;3164:314–324. [Google Scholar]
- Dorph-Petersen KA, Gundersen HJ, Jensen EB. Non-uniform systematic sampling in stereology. J Microsc. 2000 Nov;200(2):148–57. doi: 10.1046/j.1365-2818.2000.00750.x. [DOI] [PubMed] [Google Scholar]
- Fok YL, Chan JCK, Chin RT. Automated Analysis of Nerve-Cell Images Using Active Contour Models. IEEE Trans, on Medical Imaging. 1996;15(3):353–368. doi: 10.1109/42.500144. [DOI] [PubMed] [Google Scholar]
- Fox IK, Jaramill A, Hunter DA, Rickman SR, Mohanakumar T, Mackinnon SE. Prolonged Cold-preservation of Nerve Allografts. Muscle Nerve. 2005;31:59–69. doi: 10.1002/mus.20231. [DOI] [PubMed] [Google Scholar]
- Genden EM, Watanabe O, Mackinnon SE, Hunter DA, Strasberg SR. Peripheral Nerve Regeneration on the Apolipoprotein-E-Deficient Mouse. J Recostructive Microsurgery. 2002;18(2):495–501. doi: 10.1055/s-2002-33321. [DOI] [PubMed] [Google Scholar]
- Grand AG, Myckatyn TM, Mackinnon SE, Hunter DA. Axonal Regeneration after cold preservation of nerve allografts and immunosuppresion with tacrolimus in mice. J Neurosurg. 2002;96:924–932. doi: 10.3171/jns.2002.96.5.0924. [DOI] [PubMed] [Google Scholar]
- Hess JR, Brenner MJ, Fox IK, Nichols CM, Myckatyn TM, Hunter DA, Rickman SR, Mackinnon SE. Use of Cold-preserved allografts seeded with autologous Schwann cells in the treatment of a long-gap peripheral nerve injury. Plast Reconstr Surg. 2007;119:246–259. doi: 10.1097/01.prs.0000245341.71666.97. [DOI] [PubMed] [Google Scholar]
- Larsen JO. Stereology of nerve cross sections. J Neurosci Methods. 1998;85:107–118. doi: 10.1016/s0165-0270(98)00129-0. [DOI] [PubMed] [Google Scholar]
- Nichols CM, Brenner MJ, Fox IK, Tung TH, Hunter DA, Rickman SR, Mackinnon SE. Effect of motor versus sensory nerve grafts on peripheral nerve regeneration. J Exp Neurol. 2004;190:347–355. doi: 10.1016/j.expneurol.2004.08.003. [DOI] [PubMed] [Google Scholar]
- Orgel MG. A critical review of histological methods used in the study of nerve regeneration. In: Jewett DL, McCarrol HR, editors. Nerve Repair and Regeneration: its clinical and experimental basis. Vol. 14. Mosby; St Louis: 1980. pp. 141–149. [Google Scholar]
- Romero E, Cuisenaire O, Denef JF, Delbeke J, Macq B, Veraart C. Automatic morphometry of nerve histological sections. J Neurosci Methods. 2000;97(2):111–22. doi: 10.1016/s0165-0270(00)00167-9. [DOI] [PubMed] [Google Scholar]
- Russ JC. Computer-Assisted Microscopy: The Measurement and Analysis of Images. Plenum Press; New York: 1990. p. 8. [Google Scholar]
- Silva AP, Jordao CE, Fazan VP. Peripheral nerve morphometry: Comparison between manual and semi-automated methods in the analysis of a small nerve. J Neurosci Methods. 2007 Jan 15;159(1):153–7. doi: 10.1016/j.jneumeth.2006.06.012. [DOI] [PubMed] [Google Scholar]
- Torch S, Usson Y, Saxod R. Automated morphometric study of human peripheral nerves by image analysis. Path Res Pract. 1989;185:567–71. [Google Scholar]
- Urso-Baiarda F, Grobbelaar AO. Practical nerve morphometry. J Neurosci Methods. 2006 Sep 30;156(12):333–41. doi: 10.1016/j.jneumeth.2006.02.014. [DOI] [PubMed] [Google Scholar]
- Usson Y, Torch S, Saxod R. Morphometry of human nerve biopsies by means of automated cytometry: assessment with reference to ultrastructural analysis. Anal Cell Path. 1991;3:91–102. [PubMed] [Google Scholar]
- Vita G, Santoro M, Trombetta G, Leonardi L, Messina C. A computer-assisted automatic method for myelinated nerve fiber morphometry. Acta Neurol Scand. 1992 Jan;85(1):18–22. doi: 10.1111/j.1600-0404.1992.tb03990.x. [DOI] [PubMed] [Google Scholar]


