

Abstract
The initial events in protein aggregation involve fluctuations that populate monomer conformations which lead to oligomerization and fibril assembly. The highly populated structures, driven by a balance between hydrophobic and electrostatic interactions in the protease-resistant wild type Aβ21–30-peptide and mutants E22Q (Dutch), D23N (Iowa), and K28N, are analyzed using molecular dynamics simulations. Intra-peptide electrostatic interactions were connected to calculated pKa values that compare well with the experimental estimates. The pKa values of the titratable residues show that E22 and D23 side-chains form salt-bridges only infrequently with the K28 side-chain. Contacts between E22–K28 are more probable in “dried” salt-bridges whereas D23–K28 contacts are more probable in solvated salt-bridges. The strength of the intra-peptide hydrophobic interactions increase as D23N<WT<E22Q<K28A. Free energy profiles and disconnectivity representation of the energy landscapes show that the monomer structures partition into four distinct basins. The hydrophobic interactions cluster the Aβ21–30-peptide into two basins, differentiated by the relative position of the DVG(23–25) and GSN(25–27) fragments about the G25 residue. The E22Q mutation increases the population with intact VGSN turn, compared to the WT peptide. The increase in the population of the structures, in the aggregation-prone Basin I in E22Q, that occurs solely due to the difference in charge states between the Dutch mutant and the WT, gives a structural explanation of the somewhat larger aggregation rate in the mutant. The D23N mutation dramatically reduces the intra-peptide interactions. The K28A mutation increases the intra-peptide hydrophobic interactions that promotes population of structures in Basin I and Basin II whose structures are characterized by hydrophobic interaction between V24 and K28 side chains but with well-separated ends of the backbone atoms in the VGSN turn. The intra-peptide electrostatic interactions in the WT and E22Q peptides roughen the free energy surface compared to the K28A peptide. The D23N mutation has a flat free energy surface, corresponding to an increased population of random coil-like structures with weak hydrophobic and electrostatic interactions. We propose that mutations or sequences which enhance the probability of occupying Basin I would promote aggregation of Aβ-peptides.
Keywords: Alzheimer’s disease, amyloid β-protein, molecular dynamics simulation, transition disconectivity graphs, free energy surface
1. Introduction
Amyloid β-protein (Aβ) is a major component of proteinaceous mass involved in Alzheimer’s disease (AD).1,2 Produced by proteolytic cleavage of Aβ precursor protein, Aβ consists of 40 or 42 residue peptides in vivo.1 It was initially proposed that ordered extracellular fibrilar aggregates of Aβ were pathogenic agents that led to neuronal cell death in the brains of AD patients.3 Recently,4–7 neurotoxicity has been associated with metastable low molecular weight (LMW) oligomers, which are intermediates in the fibrilization process of Aβ.8 The Aβ monomers were proposed to nucleate and form amyloid fibrils through a linear aggregation mechanism.9 It remains an outstanding problem to characterize the aggregation mechanism in terms of key intra- and inter-peptide interactions in the monomer, LMW oligomers, and fibrils.
Based on general theoretical arguments, several scenarios for protein aggregation have been proposed.10,11 In all scenarios, the key early event is the structural transitions in the monomer, due to fluctuations, denaturant stress or interactions with other monomers, that populate aggregation-prone conformations. Thus, it is imperative to describe the structural characteristics that the monomers adopt, and to assess whether these structures can trigger ordered oligomer formation upon inter-peptide interactions. It is also important to decipher how variations in sequences shift the population of the most probable low free energy monomer structures. In the Aβ monomers, it has long been appreciated that the VGSN region (residues 24–27) plays a key role in imparting a degree of local order even though globally they are best treated as random coils. Kirschner and coworkers12 used theoretical predictors of β-turn propensity13 to show that the region of sequence centered about residue 26 (as well as residue 8) as having high β-turn potential. Limited proteolysis studies14 identified β-turn in the SNKG(26–29) region of the full length peptide. NMR and CD spectroscopy15 for the full length Aβ-protein and fragments in a trifluoroethanol and water solution to show that the VGSN(24–27) region forms stable turn structures. Several other studies16–19 also identified a helix-turn-helix structure for the Aβ-peptide in non-polar or membrane mimicking environments.
The aqueous solution phase NMR structure of the Aβ10–35 congener peptide20,21 shows that, in addition to the LVFFA(17–21) “central hydrophobic cluster” region, a turn centered at the VGSN(24–27) region of the peptide is a key structural motif. Subsequent studies of the Aβ10–35-peptide demonstrated that the Cα proton chemical shift in the VGSNKG(24–29) region does not change over a range of temperature, which suggests that the peptide structure surrounding the VGSN(24–27) region is stable in the temperature range from 5°–35°.21,22
Simulation studies21,23,24 lent support for the stability of the proposed structure of the LVFFA(17–21) central hydrophobic cluster and VGSN(24–27) turn regions on the nanosecond time scale.21 The conservation of the VGSN(24–27) turn region in the putative β-fibril25 and the “collapsed coil” structures leads to the conjecture that the VGSN(24–27) may nucleate the formation of Aβ aggregates. Recent MD simulations26–28 and solid-state NMR experiments29 on the Aβ21–30-peptide revealed a highly fluctuating structure of this decapeptide, with relatively low-probability of intra-peptide E22–K28 and D23–K28 salt-bridges and the V24–K28 hydrophobic interaction also supporting the role of the VGSN(24–27) in higher ordered structures.
The bend in the VGSN(24–27) fragment also plays a crucial role in the stability of the Aβ1–40 fibril structures.30–32 Both intra-30,31 and inter-32 peptide D23–K28 salt-bridge are key structural elements that may stabilize the bend in the VGSN(24–27) region of the peptide in the fibril state. The monomeric structural construct with the characteristic bend in the VGSN region satisfies the principle of amyloid self-assembly (PASA),33 namely, structures that maximize both intra- and inter-molecular hydrophobic interactions and the number of salt-bridges are the most stable.
Here, we investigate the interplay between hydrophobic and electrostatic intra-peptide interactions in stabilizing the structure of the VGSN(24–27) region in the wild type (WT) and mutants of the Aβ21–30-peptide. The intra-peptide electrostatic interactions were investigated through estimates of pKa values. Explicit-solvent MD simulation pKa estimates were compared with the experimental values measured through solution-state NMR chemical-shift titrations.34 Free energy surfaces of the Aβ21–30(WT)-peptide and three mutant peptides, E22Q (“Dutch” mutant), D23N (“Iowa” mutant), and K28A, were projected on coordinates defined by the V24–K28 and V24–N27 distances to unveil how intra-peptide hydrophobicity is modulated by electrostatic interactions. Transition disconnectivity graphs were used to uncover key details of the free energy surfaces of the WT and the E22Q, D23N, and K28A mutant peptides. We find that mutants, such as E22Q, that lead to even modest enhancement of aggregation prone structures (intact D23–K28 salt-bridge and stable VGSN turn), can lead to an increase in rates of fibril formation.)
2. Results
2.1. pKa values indicate weak intra-peptide electrostatic interactions
Since Aβ21–30 is a small peptide, its interior is mainly formed by the backbone, while the polar and charged residues are exposed to water. As a result, the most important polar or charged groups are solvated. Consequently, electrostatic interactions are unlikely to be sufficiently strong to change the protonation state of a titratible residue compared to its value in isolation. These expectations are borne out by computing the Born, background, and interaction contributions to the pKa shifts (see Eq. (2)). We used two values (4 and 20) for the dielectric constant of the protein, and found that pKa values are similar (data not shown).
pKa for WT
The computed pKa values of residues E22, D23, and K28 in the WT, presented in Table 1 and Fig. 1a, are in good accord with the experimental pKa values.34 We used a value of 10.5 as a model pKa for K28. The pKa values of residues E22 and D23 (4.5 and 4.0, respectively) are the same as the model values, which implies that these two residues are solvated. The computationally determined pKa values of E22 and D23, 4.6 and 3.8, respectively, (Table 1) suggest that there is a weak, unfavorable, electrostatic interaction between E22 and the negative partial charges of the peptide. The pKa shift of K28, 11.2, compared to the model value, 10.5, suggests that K28 engages in favorable electrostatic interactions with the peptide.
Table 1.
Computational pKa values are compared with the experimental34 (in parenthesis) pKa values for titratable residues E22, D23, and K28 in the Aβ21–30-peptide. The pKa values of the isolated residues and the residues in the peptide structure are similar, indicating that the pKa shifts result from weak intra-peptide electrostatic interactions.
| E22 | D23 | K28 | |
|---|---|---|---|
| Model’s pKa | 4.5 | 4.0 | 10.5 |
| Ac-Aβ21–30-NH2(WT) | 4.6±0.3 (4.5.±.02) |
3.8±0.7 (4.0±0.02) |
10.7±0.2 (11.2±0.01) |
| Ac-Aβ21–30-NH2(E22Q) | - - |
3.7±0.3 (4.0±0.02) |
10.5±0.2 (11.1±0.01) |
| Ac-Aβ21–30-NH2(D23N) | 4.3±0.2 (4.5±0.01) |
- - |
10.5±0.2 (10.4±0.01) |
| Ac-Aβ21–30-NH2(K28A) | 4.9±0.2 (4.9±0.04) |
3.9±0.3 (4.7±0.03) |
- - |
Fig. 1.
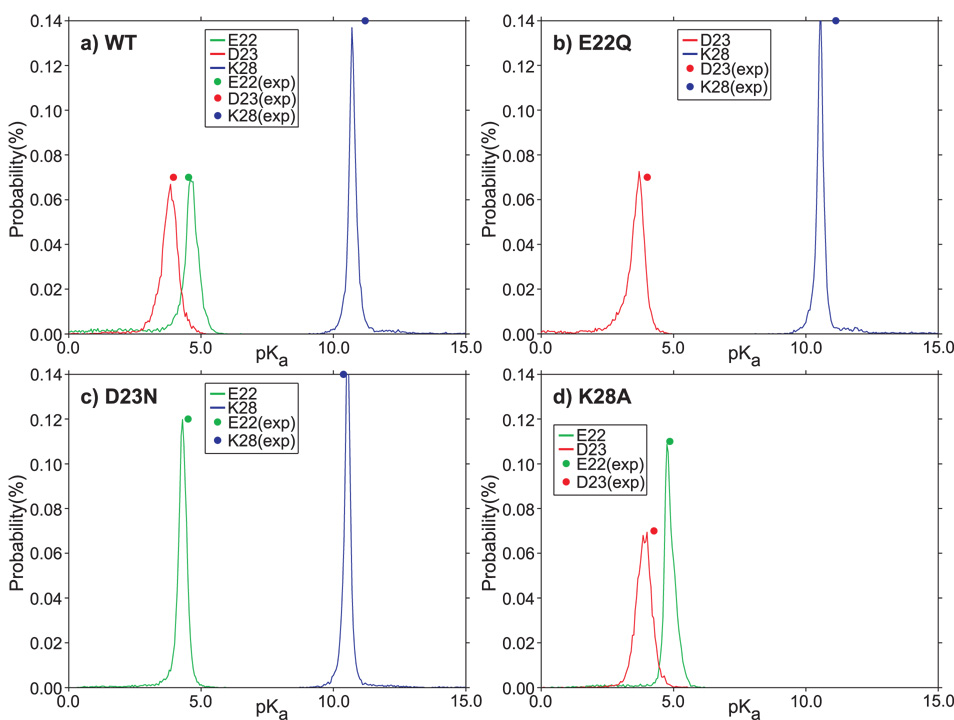
Comparison of calculated and experimental pKa values of WT and mutants of the Aβ21–30-peptide. The computed pKa values of the titratable residues are in good agreement with the experimental34 pKa values. The reported pKa values are computed with a dielectric coefficient of 4.
pKa for mutants
The experimental pKa values of residues D23 and K28 in the E22Q “Dutch” mutant (4.0 and 11.1, respectively, in Table 1) are close to the WT, implying that the D23 side-chain is mainly solvated and the K28 side-chain interacts favorably with the polar groups of the peptide. The corresponding computationally determined pKa values of D23 and K28 in the E22Q mutant peptide are 3.7 and 10.5, respectively, (Table 1) suggesting that the D23 side-chain engages in a slightly favorable interaction with the peptide, while the K28 side-chain is more tightly solvated.
In the D23N “Iowa” mutant (Table 1 and Fig. 1c), the E22 side-chain is isolated, with both experimental and calculated pKa (4.5 and 4.3, respectively) being close to the model value. A decrease of the pKa for K28 compared to the WT and E22Q indicates that the favorable intra-peptide electrostatic interactions of the K28 side-chain in the WT and E22Q peptides are diminished in the D23N mutant. Taken together, these results show that the D23 side-chain in the WT and the E22Q can infrequently form salt-bridge with K28.
In the K28A mutant, the favorable electrostatic influences on the E22 and D23 residues from the rest of the peptide are abolished. The negatively-charged side-chains of the E22 and D23 residues interact unfavorably, increasing their pKa values relative to the model values (Table 1 and Fig. 1d). Thus, substitution of K28 by a hydrophobic residue drastically alters the nature of the electrostatic interactions.
A couple of comments about the accuracy of the pKa calculations and their implications are worth making. (i) One way to test the accuracy of the method used to calculate the pKa values is to verify the linearity of the equation:35
where i is the titratible residue, E22, D23, or K28. and are the experimental pKa and the one for the isolated residue. The electrostatic free energy ΔG i is obtained by solving the linearized Poisson-Boltzmann equation and includes the Born free energy, the background free energy, and the electrostatic free energy of interaction (Eq. 2). A good correlation between calculated and measured pKa values should give intercepts at pKa of the isolated residue with a slope of −1/(2.303kBT) or −0.73 kcal/mol. A plot of the experimental pKa values versus the ΔGi yields intercepts close to the pKa values of the isolated E22, D23, and K28 residues (Fig. 2). The decreased correlation between the experimental and computed pKa values of K28 (Fig. 2) suggests interactions of K28 with the peptide are not accurately described by the simulations. However, the difference between the experimental (11.1±0.01) and computational (10.5±0.2) pKa for the K28 side-chain in the E22Q mutant is equivalent only to 0.8 kcal/mol favorable electrostatic interaction between the K28 side-chain and the rest of the peptide. This value is comparable with the thermal fluctuations, 0.6 kcal/mol at 300 K, and hence is relatively small.
Fig. 2.
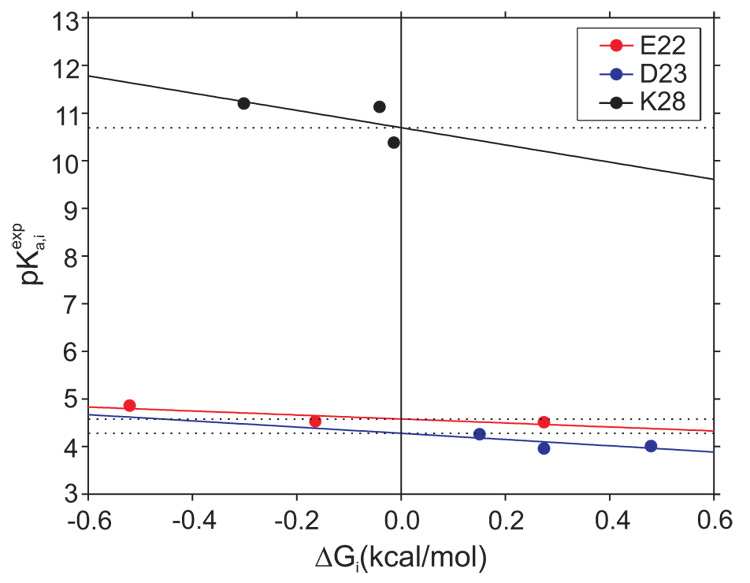
Variation of the experimental pKa, , as a function of the electrostatic free energy, ΔGi. The linear dependence validates the computational method used to calculate the pKas. The intercepts for the E22, D23, and K28 residues are 4.6, 4.3, and 10.7, respectively, with the slopes of −0.4, −0.7, and −1.8, respectively. The root mean squared errors are 0.1, 0.2, and 0.5, respectively.
(ii) Both the experimental and computed small values of the pKa shift values of the titratible residues within the Aβ21–30(WT) and its variants, E22Q, D23N, and K28A, suggest that the titratible residues are largely exposed to solvent. Our simulations, that show relatively small pKa shifts, suggest that the probability of forming structures with intact salt-bridge with a stable bend (aggregation-prone structures) is small.
2.2. Strength of salt bridges varies greatly from WT to mutants
The experimentally measured pKa values do not allow us to directly interpret the strength of electrostatic interaction between the E22–K28 and D23–K28 charged side-chain pairs. The distribution of the electrostatic energies for the E22–K28 and D23–K28 pairs shows that ΔGinter (Eq. 2) for most of the simulated structures (between 78% and 95%) is centered around zero (Fig. 3). This implies that the E22, D23, and K28 side-chains are highly solvated, in accordance with the experimental and calculated pKa values (see Table 1) and the computed pKa -shift values (see Fig. 1). The strength of the electrostatic interactions between the E22–K28 and D23–K28 side-chain pairs appears to be similar in the WT peptide (Fig. 3).
Fig. 3.
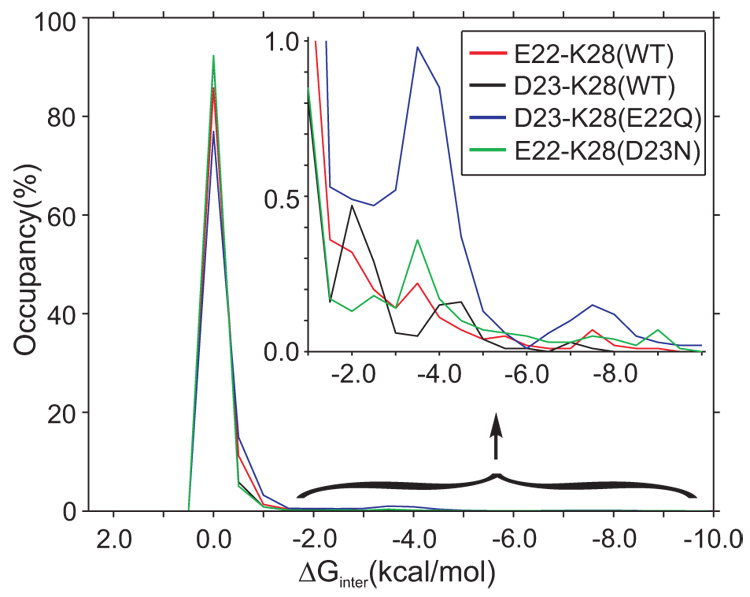
The electrostatic interaction energy distributions between the residues E22–K28 and D23–K28 indicate that the titratable residues in the Aβ21–30-peptide are highly solvated during the simulation. Hydrated electrostatic contacts associated with weakly favorable interactions are of low favorable energies, explaining their instability. In the WT peptide, the D23–K28 electrostatic interaction is more frequent in a low favorable energy domain (around −2.0 kcal/mol), while the E22–K28 is more frequent in a larger favorable energy domain (around −3.5 kcal/mol). The E22Q mutation increases the probability of electrostatic interaction between the D23 and K28 residues. The D23N mutation decreases the probability of electrostatic interaction between the E22 and K28 residues in the low-value domain (−2.0 kcal/mol), while it increases the probability in the larger-value domain (around −3.5 kcal/mol).
The E22Q Dutch mutation increases the importance of electrostatic interaction between the D23 and K28 side-chains, around −2.0 kcal/mol and −3.5 kcal/mol, and introduces stronger electrostatic interactions, around −7.5 kcal/mol (Fig. 3). A value of −2.0 kcal/mol corresponds to a solvated electrostatic interaction between two unlike unit charges. A lower value, such as −7.5 kcal/mol, implies exclusion of the solvating water molecules through burial of the salt-bridge in the peptide interior. The somewhat more favorable interaction between D23 and K28 results in a modest increase in the probability salt bridge formation in the Dutch mutant compared to the WT. The tendency to form this stable salt bridge with intact VGSN turn provides a structural explanation for the E22Q to aggregate more rapidly than the WT. The D23N mutation (see Fig. 3) decreases the frequency of the weaker electrostatic interactions (−2.0 kcal/mol) and only slightly increases the moderate electrostatic interactions (−3.5 kcal/mol) between the E22 and K28 residues.
2.3. Nature of salt-bridge depends on the sequence
The strength of the electrostatic interactions within the E22–K28 and D23–K28 pairs depends on both the distance between the charged side-chains and the local dielectric coefficient, which is related to the solvent-exposure. The distributions of distances between the atoms Cδ(E22)-Nζ(K28) and Cγ(D23)-Nζ(K28) in the WT, E22Q, and D23N are shown in Fig. 4a. A basin centered at 4.3 Å between the Nζ(K28) and Cδ(E22) or Cγ(D23) atoms, respectively, accommodates one hydrogen bond between the donor Nζ(K28) atom and the acceptor atoms of either E22 or D23 side-chains, Oε(E22) or Oδ(D23), respectively, corresponding to hydrogen-bonded salt-bridges. A second basin, centered on 5.5 Å (Fig. 4), accommodates one water molecule between the Nζ(K28) and Oε(E22) or Oδ(D23), and corresponds to water-mediated salt-bridges. The border between the water-mediated salt-bridges and the highly solvated side-chains corresponds to the first desolvation barrier, DB1, at 7.5 Å. A second desolvation barrier, DB2, separates the water-mediated and hydrogen-bonded salt-bridges at 4.5 Å. The E22–K28 and D23–K28 pairs form hydrogen-bonded salt-bridges with low probability, 1.3%, in the WT (Fig. 4a). The interactions between the negatively-charged E22 and D23 side-chains and positively-charged K28 are somewhat more probable, 6.4% and 4.4%, respectively, when mediated by a water molecule. Fig. 4a suggests that the formation of the water-mediated E22–K28 contact is not an activated process but the D23–K28 water-mediated contact must overcome a small barrier at 7.5 Å, DB1 in Fig. 4a. Removal of the last solvation shell between the E22–K28 or D23–K28 side-chains in the WT is an activated process characterized by poorly populated basins separated by the solvated charged residues with a barrier at 4.5 Å, DB2 in Fig. 4a.
Fig. 4.
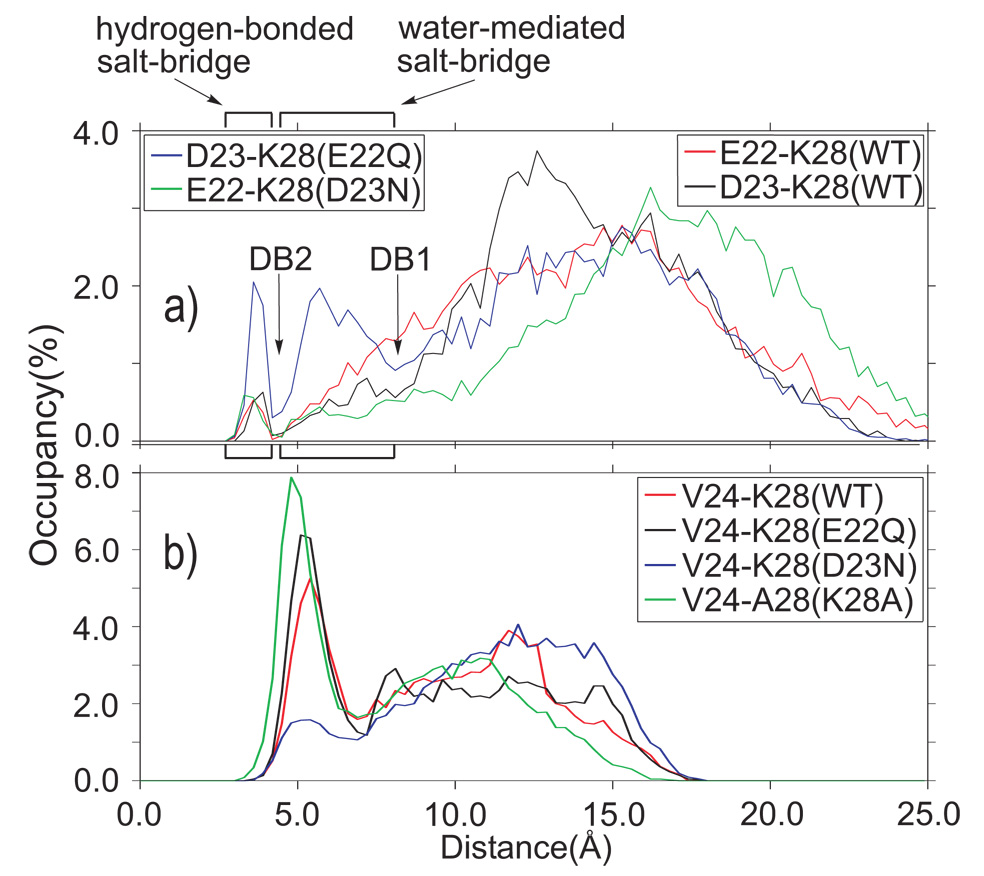
Distribution of distances characterizing the intra-peptide electrostatic (a) and hydrophobic (b) interactions. (a) The distributions of the distances between Cδ(E22)–Nζ(K28) and Cγ(D23)–Nζ(K28) indicate the weak electrostatic interaction between these titratable residue pairs. The hydrogen-bonded salt-bridge of the E22–K28 and D23–K28 pairs are equally populated in the Aβ21–30(WT)-peptide, while the water-mediated salt-bridge is more populated for the E22–K28 pair. The E22Q mutation increases the D23–K28 close-interaction probability. The D23N mutation does not change the probability of the hydrogen-bonded E22–K28 salt-bridge compared to the WT, while the water-mediated E22–K28 salt-bridge is less probable. DB1 indicates the first desolvation barrier, while DB2 indicates the second desolvation barrier. (b) The distance between the centers of mass of the V24 side-chain and the hydrophobic portion of residue 28 reveals the distribution of the hydrophobic intrapeptide interactions. The position 28 is occupied by K in the WT and E22Q, and D23N variants, and by A in the K28A mutant. Two distinct basins characterize the distributions. The distances between the side-chain V24 and the residue 28 in contact are centered around 5.0 Å. The solvated side-chains 24 and 28 have their centers-of-mass separated by at least one solvation shell, with a minimum distance of 7.5 Å. The E22Q mutation increases the intra-peptide hydrophobic interaction while the D23N decreases it. The K28A mutation maximizes the population of the 24–28 hydrophobic contacts.
The E22Q mutation increases the stability of the D23–K28 hydrogen-bonded and water-mediated salt-bridges, with formation probabilities of 5% and 14%, respectively (see Fig. 4a). The increase in the population (cumulatively by a factor of 3) of structures with D23–K28 salt-bridge is sufficient to explain the modest enhancement in the rate of fibril formation in E22Q. The D23N mutation generates structures with hydrogen-bonded E22–K28 salt-bridge similarly populated (1.6%) as in the WT (1.3%), and is also separated by an activation barrier at 4.5 Å, (see DB2 in Fig. 4a). The probability to observe E22–K28 water-mediated salt-bridges is reduced to 3.2% compared to the similar contact in the WT peptide (6.4%). The water-mediated salt-bridge formation does not involve crossing of activation barrier in order to remove the solvation water in the D23N peptide.
2.4. Intra-peptide hydrophobic contacts are similar in the WT and E22Q
We focused on the interaction between the side-chain of V24 and the aliphatic portion of the K28 side-chain as the main contribution to intra-peptide hydrophobicity. Recent NMR experimental measurements29 and coarse-grained MD simulations,26 suggest that the V24 propyl side-chain and the butyl portion of K28 side-chain are in contact. We have examined the correlation between the electrostatic and hydrophobic intra-peptide interactions by selectively modifying the electrostatic charge state of the residues 22, 23, and 28.
Fig. 4b shows the distributions of the distances between centers-of-mass of the V24 side-chain and the aliphatic part of the K28 side-chain, for the WT and the E22Q and D23N mutants. The distribution of the distance between the V24 and A28 is also shown for the K28A mutant. The V24 packs against K28 in 29% of conformations in the WT. In the Dutch mutant, E22Q, the fraction of molecules with V24–K28 hydrophobic contact increases to ≈33%. This observation supports the inference that the major difference between the WT and the Dutch mutant must arise largely from the differences in the charge states. The mutant K28A diminishes the strong electrostatic interaction of the K28 ammonium group with the surrounding water molecules, thus increasing the population of the hydrophobic interactions between the V24 and A28 side-chains to 42%. We find that the desolvation of the space between the V24 side-chain and the butyl group of K28 (or methyl of A28) is a one-barrier process, in contrast to the two-barrier desolvation observed in the contact between the D23 and K28 side-chains (see Fig. 4b).
2.5. K28 makes transient contacts with the peptide backbone
The delicate balance of hydrophilic and hydrophobic forces that act on the K28 side-chain can be influenced by the change in the electrostatic charge state of the E22 or D23 side-chains. We monitored the disruptions in the hydrophilic/hydrophobic balance by counting the hydrogen-bond contacts between the ammonium group of K28 and the oxygen atoms of the peptide backbone. Fig. 5 demonstrates that the number of contacts between the K28 side-chain and peptide backbone is slightly larger in the WT and E22Q mutant (≈9%) than in the D23N mutant peptide (≈6%). The contacts between the K28 ammonium group and the peptide backbone has a maximum around the E22, D23, and V24 residues, suggesting a combined influence of the electrostatic (between E22–K28 and D23–K28) and hydrophobic (V24–K28) forces act on the K28 side-chain. The increased tendency of K28 to make hydrogen bonds with the peptide backbone in the WT and E22Q mutant compared to the D23N mutant provides an explanation for the more favorable pKa(K28) values for the WT and E22Q peptides (11.2 and 11.1, respectively) and the less favorable pKa for the D23N mutant peptide (10.4) (see Table 1).
Fig. 5.
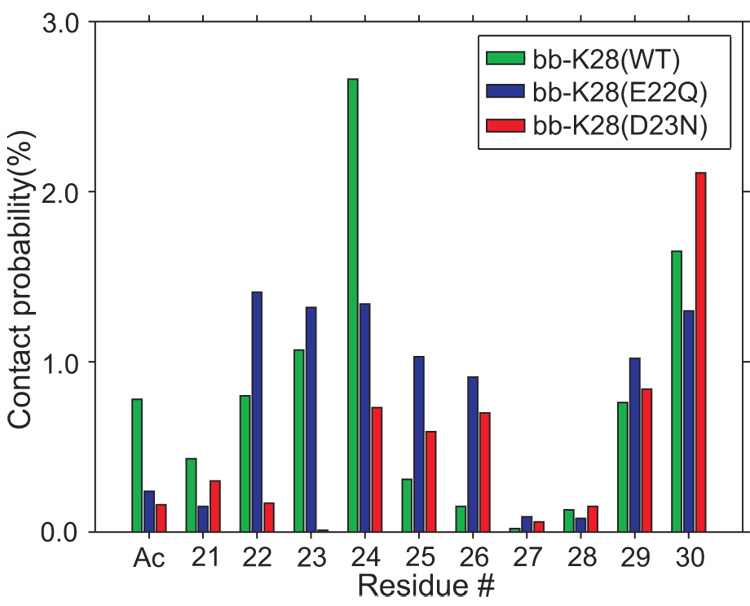
The distance between the Nζ(K28) and the backbone oxygen atoms is used as a measure of interaction between the K28 residue and the peptide backbone. The WT and the E22Q mutant of the Aβ21–30-peptide increases the contact probability between the K28 side-chain and peptide backbone. The D23N mutation reduces the probability of the K28-backbone contact.
2.6. Sequence determines intra-peptide folding elements
Hydrophobic intra-molecular interactions are more probable than intra-molecular electrostatic interactions (compare Fig. 4a and Fig. 4b). It is thus reasonable to consider the hydrophobic intra-peptide interactions, i.e. the interaction between the side-chain of V24 and the hydrophobic part of the side-chain (SC) at position 28, either K, in WT, E22Q, and D23N, or A in K28A, as making a dominant contribution to the conformations of the Aβ21–30-peptide. The main effect of the intra-molecular interactions is a stabilization of the VGSN(24–27) turn. The Cα(V24)–Cα(N27) distance was implied to monitor the stability of the VGSN(24–27) turn. Fig. 6 shows the free energy surface projected onto two coordinates, the SC(V24)–SC(K28) and Cα(V24)–Cα(N27) distances. A projection of the free energy on the radius-of-gyration, Rg, of the Aβ21–30-peptide, and the root-mean-squared displacement, RMSD, from the initial structure used in simulation resulted in a narrow basin, with small RMSD values and a wide basin corresponding to large RMSD values (data not shown).
Fig. 6.
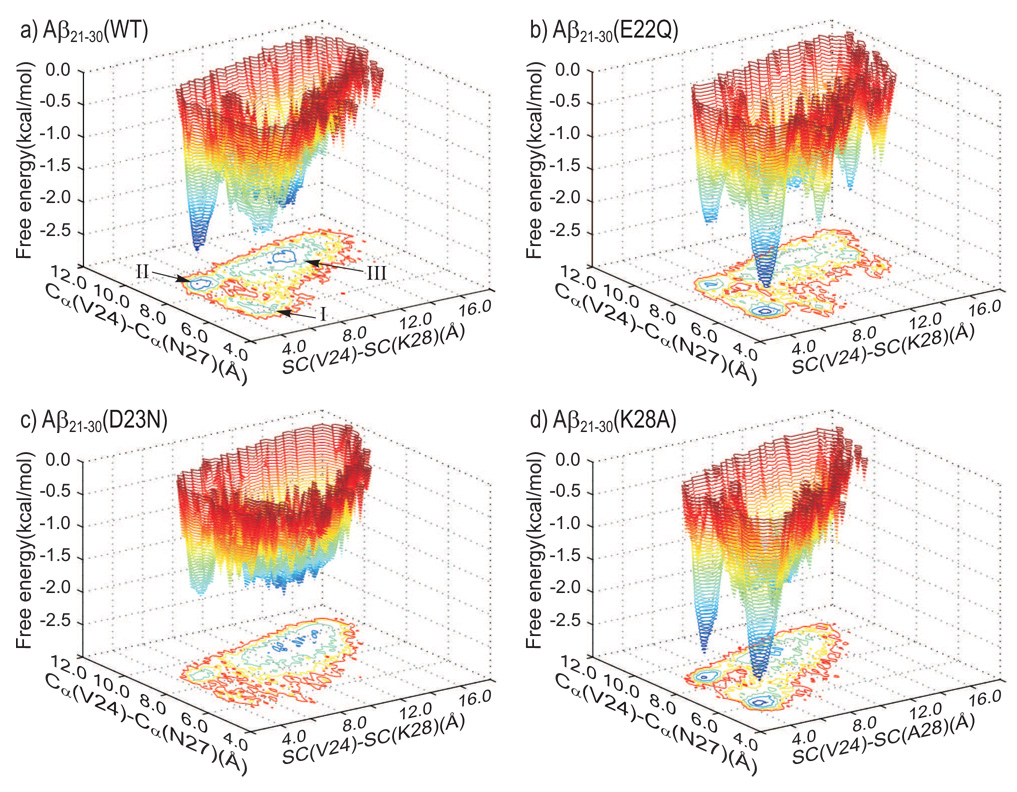
The free energy hyper-surface is projected on the space defined by the distance between the center-of-mass of the V24 side-chain (SC) and the hydrophobic part of the K28 side-chain (SC) (the X axis) and the distance between the Cα atoms of the residues V24 and N27 (the Y axis). Three hyper-basins are observed in the Cα(V24)–Cα(N27) vs. SC(V24)–SC(K28) projection of the free energy. Basin I is characterized by a compact structure of the VGSN(24–27) segment of the Aβ21–30-peptide. The peptide structures in basin II are described by strong hydrophobic interaction between the V24 and K28 side-chains, while the ends of the VGSN(24–27) backbone are well separated. The flexible structures of the Aβ21–30-peptide have large values of the X and Y coordinates and define Basin III. Basin II is deeper than Basin I in the WT (panel a), contrary to the E22Q mutant (panel b). The D23N mutation makes the decapeptide more flexible, with Basin I almost canceled and Basin III deeper and wider (panel c). The K28A mutation enhances the hydrophobic interaction between the V24 side-chain and the side-chain of A28, particularly through cancelation of the electrostatic interaction of K28 side-chain with the neighboring water molecules. Basins I and II are deep and equally populated (panel d).
The coordinate Cα(V24)–Cα(N27) introduces details to the two superbasins generated by the hydrophobic interaction between the V24 and K28 side-chains (see Fig. 4b). The packing of the V24 side-chain against the K28 side-chain defines two basins, I and II, corresponding to small (5.5–7.0 Å) and larger (8.5–10.0 Å) Cα(V24)–Cα(N27) distances, respectively (see Fig. 6). The energy landscape of the Aβ10–35 monomer33 shows a similar bimodal distribution. The mobility around the G25 residue modulates the relative position of the DVG(23–25) and GSN(25–27) fragments. The two fragments of structures in Basin I define a loop centered on the G25 residue. The maximum stability (minimum free energy) in the basin I is associated with a helix-like structure. The two fragments DVG(23–25) and GSN(25–27), shifted out-of-plane, are stabilized by hydrogen bonds between the O(D23)–N(K28) and N(G25)–O(K28) atoms, hydrophobic interaction between V24 and K28, and salt-bridge between D23 and K28. The DVG(23–25) and GSN(25–27) fragments of the structures in Basin II converge to an “S-like” peptide structure with a bend about the G25 residue. Basin III is broader than Basin I or II, with the two fragments DVG(23–25) and GSN(25–27) oscillating about residue G25.
2.6.1. Electrostatic interactions subtly influence the hydrophobic effect
The electrostatic charge of the 23–27 fragment influences the populations and the positions of the three basins of attraction in the free energy landscape. Basin II is deeper in the WT (Fig. 6a), with a minimum free energy and a population of 13%; Basin I has and a population of 9%. The population in Basin III in the WT is 39% with . The electrostatic neutralization of the residue in position 22 in the E22Q mutant peptide (Fig. 6b) shifts the balance between Basin I, with and a population of 19%, and Basin II, with and a population of only 7%. Basin III is depopulated compared to the WT, with a population of 30% and . The D23N mutation (Fig. 6c) dramatically reduces the populations in Basin I, to only 3% and , and Basin II, with and 5% population. Basins I and II have the same minimum free energy, , kcal/mol, in the K28A mutant (Fig. 6d). However, Basin I is broader, with a population of 23%, than Basin II, with a population of 12%. The population of Basin III in the K28A mutant is 33% and . It should be stressed, as in the case with all MD simulations, that the equilibrium populations of the various basins are not quantitative. However, a number of measures suggest that the relative shifts occur in the probability of D23–K28 in the Dutch mutant.
2.7. Electrostatic interactions roughen the free energy surface
In addition to computing the reduced dimensional representation of the free energy landscape (Fig. 6), we have also obtained a free energy representation that uses a clustering procedure. Following Krivov and Karplus,36,37 we used a Transition Disconnectivity Graph (TRDG) representation of the free energy hypersurface to analyze the combined influence of both electrostatic and hydrophobic intra-peptide interactions on the Aβ21–30-peptide behavior. The TRDG representations of the free energy hypersurface are shown in Fig. 7. The nodes with a free energy higher than −0.6 kcal/mol and separated by barriers lower than 0.6 kcal/mol form an entropic basin (grey color). Table 2 presents the total number of nodes N, direct transitions Ndir, and nodes in the entropic basin associated with the WT, E22Q, D23N, and K28A peptides. Peptide structures corresponding to local minima energies in the TRDG representation form the association with the basins I (blue), II (green), and III (red) defined in Fig. 6. The global minimum free energy of the WT peptide (Fig. 7a), −4.0 kcal/mol, corresponds to an “S-like” peptide structure of the 23–27 fragment, associated with Basin II. Basin I has a minimum free energy of −2.5 kcal/mol. The WT peptide structure, corresponding to the local minimum free energy in Basin I, has a helix-like shape and is separated by a barrier of 2.5 kcal/mol from the remaining of basins in the TRDG representation. Basin III, with a minimum free energy of −2.6 kcal/mol, is separated from Basin II by a barrier of 2.1 kcal/mol.
Fig. 7.
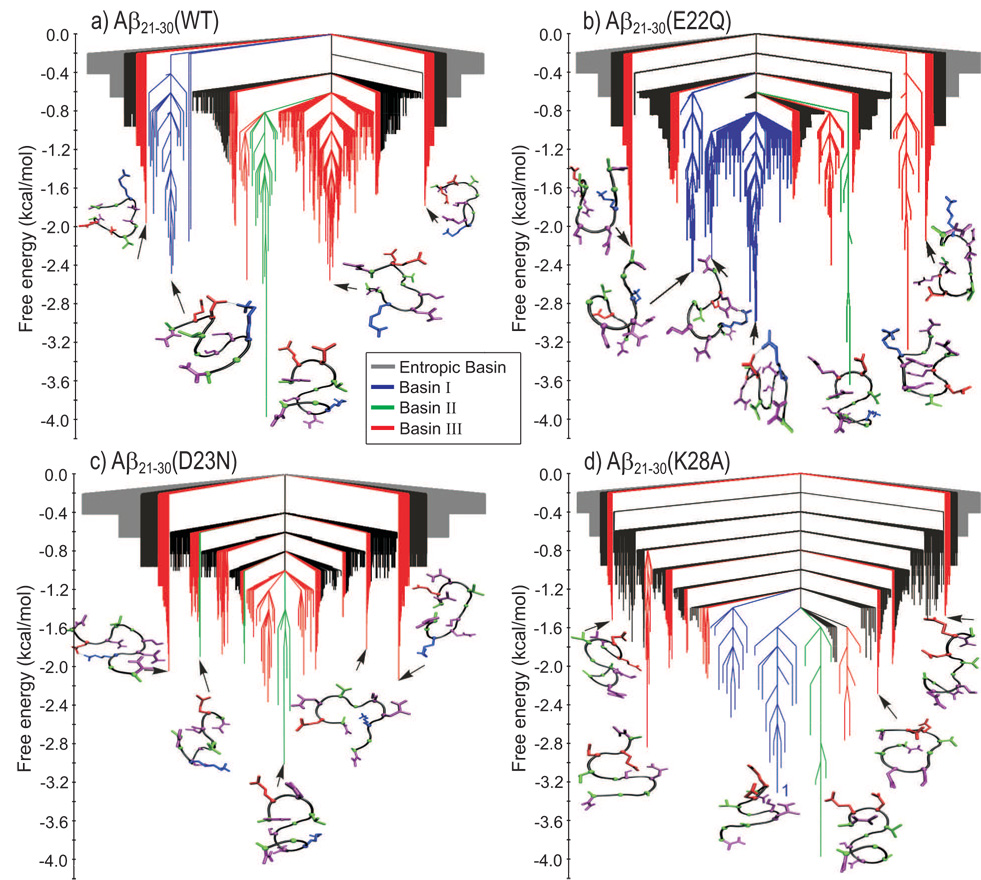
The change of the electrostatic properties of the E22, D23, and K28 side-chains in the Aβ21–30-peptide induces pronounced changes in the TRDS representations of the peptide free energy. The grey color defines the entropic basin of unstructured configurations. The colors blue, green, and red corresponds to structures belonging to Basins I, II, and III, respectively, defined in Fig. 6. The hydrophobic interaction between the V24 and K28 side-chains and the electrostatic interactions within the E22–K28 and D23–K28 side-chain pairs generate a rough free energy surface (multiple on-path basins) in the Aβ21–30(WT)-peptide (panel a). The roughness aspect of the free energy surface is accentuated by the E22Q mutation (panel b), especially due to the increased electrostatic interaction between D23 and K28 side-chains (see Fig. 4a). The D23N mutation (panel c) does not increase the intra-peptide electrostatic interactions (see Fig. 4a), generating a smoother free energy surface, with a weak convergence towards a configuration stabilized by the V24–K28 hydrophobic interaction (Basin II in Fig. 6c). The K28A mutation (panel d) generates a deep and relatively smooth free energy funnel.
Table 2.
The number of nodes, N, and direct transitions among nodes, Ndir, associated with the free energy transition disconnectivity graphs of the WT, E22Q, D23N, and K28A peptides. Ndir is reduced to N−1 using the minimum-cut algorithm.60 NS nodes with free energies higher than −0.6 kcal/mol define the entropic basin.
| N | Ndir | NS | |
|---|---|---|---|
| Ac-Aβ21–30-NH2(WT) | 1942 | 2799 | 751 |
| Ac-Aβ21–30-NH2(E22Q) | 1932 | 2979 | 750 |
| Ac-Aβ21–30-NH2(D23N) | 2739 | 3599 | 1195 |
| Ac-Aβ21–30-NH2(K28A) | 1515 | 2561 | 527 |
The energy landscape of the E22Q mutant peptide is characterized by a similar number of nodes, direct transitions, and weight of the entropic basin (see Table 2). Note that Basin I in the E22Q peptide (in blue in Fig. 7b), with a minimum of −3.0 kcal/mol, is broader compared to the WT and is divided into three sub-basins, un-identified in the projected representation of the free energy in Fig. 6b. As in the WT FE-TRDG, the local minimum (−3.6 kcal/mol) corresponding to Basin II defines the global minimum in the E22Q FE-TRDG. A barrier of 2.4 kcal/mol separates the local minimum in Basin I from the local minimum in Basin II. The minimum free energy in Basin III of the E22Q FE-TRDG is lower (−3.1 kcal/mol) compared to the corresponding minimum in the WT FE-TRDG (−2.6 kcal/mol). Both the FE-TRDG representations for the WT and E22Q peptides consist of multiple sub-basins (Figs. 7a and 7b).
The D23N mutation, Fig. 7c, produces a flat funnel-like free energy surface. The global minimum free energy, −3.0 kcal/mol, is associated to Basin II and is connected through multiple transitions to Basin III. The increased number of total nodes, direct transitions, and nodes in the entropic basin associated with the D23N peptide (Table 2) indicate diminished intra-peptide interaction energies compared to either WT or E22Q peptides.
The K28A mutation generates the lowest number of nodes, direct transitions, and nodes in the entropic basin of the four peptide variants studied (Table 2). The free energy surface, Fig. 7d, converges to two associated sub-basins, I and II, with free energy minima of −3.3 kcal/mol and −4.0 kcal/mol, respectively. Fig. 7d shows that Basin I is divided into two sub-basins, separated by a transition state (TS) of −1.2 kcal/mol. Overall, the K28A mutant produces a deep and smooth funnel-like free energy surface, with reduced transitions into Basin III.
3. Discussion and Conclusions
3.1. Balance between hydrophobic and electrostatic forces determines the structures in the dominant Basins
In order to elucidate the balance between hydrophobic and electrostatic interactions in the most structured region of Aβ-peptide, we determine the energy landscape of Aβ21–30(WT) peptide and three mutants, E22Q, D23N, and K28A. Low pKa shift values of the E22, D23, and K28 residues indicate that the titratable residues are mostly exposed to solvent, suggesting a flexible structure for the Aβ21–30-peptide, in accord with recent experimental and computational studies.26–29 A key finding of this work is that the monomer conformations of the WT and the mutants are highly mobile and do not adopt a unique structure, i.e., there is no folding transition as implied in recent studies.28,29 Rather, the conformations can be clustered into distinct basins depending on the extent of order in some regions and the probability of being in these clusters. The nature of the energy landscape varies depending on the balance between electrostatic and hydrophobic interactions. The shift in the population among the various basins can be manipulated by point mutations as well changes in the external conditions.
Rank-ordered intra-peptide hydrophobicity increases with D23N, WT, E22Q, and K28A variants. The differences in the intra-peptide hydrophobic interactions were explained using estimates of the peptide free energy. The free energy was projected on two coordinates, associated with the hydrophobic intra-peptide interactions, SC(V24)–SC(K28) and Cα(V24)–Cα(N27) distances. A third “coordinate,” that measures the effect of successive point mutations of the titratable residues, revealed the role of the intra-peptide electrostatic interactions on the peptide behavior. Hydrophobic interactions cluster the peptide structures into two basins, I and II, with close contacts between the V24 and K28 side-chains. Fluctuating structures with solvent-separated SC(V24)–SC(K28) and Cα(V24)–Cα(N27) pairs are clustered in Basin III.
The G25 residue divides the DVGSN(23–27) fragment into two halves, DVG(23–25) and GSN(25–27). Mobility of the backbone about the residue G25 causes the difference between Basins I and II. In Basin I, the DVG(23–25) and GSN(25–27) fragments form a loop centered on the G25 residue. The two fragments form a plane at the top-edges of Basin I. An out-of-plane shift in the two fragments creates a helix-like motif, stabilized by D23–K28 salt-bridge, V24–K28 hydrophobic interaction, and hydrogen bonds between O(D23)–N(K28) and N(G25)–O(K28) atoms. In Basin II, the fragments DVG(23–25) and GSN(25–27) adopt an “S-like” structure centered on the G25 residue, stabilized by hydrophobic interaction between the V24 and K28 residues. The hydrophobic interaction between the V24 and K28 side-chains is modulated by the hydrogen bonds between the ammonium group of K28 with water. The titratable residues E22, D23, and K28 are involved in the intra-peptide interactions. The role of these three residues in the peptide stability was dissected by modifying their electrostatic charge through successive mutations. The hydrogen bonds between the E22 side-chain and water control the desolvation around the ED(22–23) fragment. The hydrogen bonds between the K28 side-chain and water opposes the V24–K28 hydrophobic interaction. The electrostatic charge of the D23 side-chain controls the strength of the D23–K28 salt-bridge.
3.2. Point mutations shift the populations between Basins
The relative populations of Basins I and II are controlled by the intra-peptide electrostatic and hydrophobic interactions. The E22Q mutation decreases the strength of the electrostatic interactions between the E22 side-chain and water, reducing the desolvation barrier for the 22–23 fragment. Consequently, the hydrogen bond between the D23 and K28 side-chains is more populated in Basin I. Electrostatic neutralization of D23 in the D23N mutant peptide completely destabilizes Basin I and drastically reduces the depth of Basin II. We conclude that the hydrophobic interaction between V24 and K28 and the hydrogen-bonds between the N23 and K28 side-chains are destabilized by the solvation of the E22 and K28 side-chains in the D23N mutant peptide. Moreover, the E22–K28 contact does not occur frequently enough in the D23N mutant peptide to populate either Basin I or Basin II. The K28A mutation enhances the hydrophobic interactions between the side-chains of the V24 and residue A28. Consequently, Basins I and II are observed to be more populated in the K28A mutant.
Rough FE TRDG surfaces obtained for the Aβ21–30(WT) and E22Q peptides are due to the intra-peptide electrostatic interactions E22–K28 and D23–K28. The more frequent D23–K28 electrostatic contacts in the E22Q peptide increase the population in the associated basin compared to the WT. The lack of intra-peptide interaction in the D23N mutant generates a smooth and flat FE TRDG profile. The lack of favorable intra-peptide electrostatic interactions and enhancement of the hydrophobic interactions in the K28A peptide generates a smoother and deeper funnel-like profile of the FE TRDG.
3.3. Sequence context determines the energetics of salt-bridges
The simulations show that the E22 and D23 side-chains make infrequent electrostatic interactions with the K28 side-chain in the WT. The energies of the independent E22–K28 and D23–K28 electrostatic interactions revealed differences in the energy range preferences. Low energy levels, between −3.0 to −4.0 kcal/mol and −5.0 to −8.0 kcal/mol, are more populated with the E22–K28 salt-bridge in the WT (see the inset in Fig. 3). Energy levels −1.5 to −2.5 kcal/mol and −4.0 to −5.0 kcal/mol are more populated with the D23–K28 salt-bridge in the WT (see the inset in Fig. 3). It appears that the D23–K28 salt-bridge is more probable in a “wet” environment, while the E22–K28 salt-bridge is more probable in a “dry” environment. The lack of clear-cut preference for either of the salt bridges is in accord with recent experiments and implicit-solvent simulations.26,29
The E22–K28 and D23–K28 residue pairs were found to equally populate hydrogen-bonded salt-bridge states in the WT, while the E22–K28 water-mediated salt-bridges are energetically inactivated and more frequent compared to the D23–K28 water-mediated salt-bridges. A one-barrier desolvation process was observed for the E22–K28 pair in the WT peptide, in contrast to the D23N peptide, where a two-barrier desolvation was observed. The D23–K28 pair desolvates in two activated steps in both the WT and E22Q peptides.
3.4. Charge states and shifts in population in aggregation-prone structures explain enhanced fibrilization rate of E22Q over the WT
Recently,26 it was suggested that the E22–K28 salt-bridge and the V24–K28 hydrophobic interaction stabilize the VGSN(24–27) loop in a polar environment, while a hydrophobic environment enhances the D23–K28 salt-bridge and destabilizes the V24–K28 hydrophobic contact. Based on this result, it was speculated26 that the enhanced fibrilization of the E22Q mutant is induced by a reorganization of VGSN(24–27) loop followed by a destabilization of the V24–K28 hydrophobic contact and an enhancement of the D23–K28 salt-bridge. Such an interpretation fails to take into account the desolvation barrier of the D23 side-chain associated with the protofibril formation.
Our results indicate that there is a tendency to form D23–K28 salt bridge in the isolated monomer. The E22 side-chain makes infrequent salt-bridges with the K28 side-chain, especially modulated by an increase of the local hydrophobicity. This explains the lack of the first desolvation barrier of the E22 residue. The tendency of E22 is to be solvated, thus increasing the desolvation barrier around the 22–23 region. The E22Q mutation decreases the desolvation barrier around the 22–23 fragment, enhancing the D23–K28 contacts, while there is no significant change in the V24–K28 hydrophobic contact. In our previous study24 we rationalized the enhanced rate of fibril formation of E22Q based on this physical picture. The results in Fig. 6 and Fig. 7, which show a greater population of the aggregation-prone structures in Basin I in E22Q compared to the WT, provide a structural explanation for increased fibrilization rate in the Dutch mutant. The structures within Basin I are prone to aggregation based on both the increased hydrophobicity38 and on the increased probability of the D23–K28 electrostatic interaction. Such a structure is topologically similar with that observed in the amyloid fibril model.30–32 Thus, mutations (E22Q) that enhances the probability of sampling the aggregation-prone structures will have higher fibril formation rate.
Given that the intra-peptide hydrophobic interactions in E22Q and the WT are similar, it follows that the differences in the charge states24 between the two sequences account for the rate of fibril growth in the two sequences. The larger tendency of the D23 side-chain to make a salt-bridge with the K28 side-chain compared to E22 is supported by the depopulation of Basin I in the D23N mutant. The K28A mutation enhances the intra-peptide hydrophobic interactions between V24 and A28 side-chain, increasing the population in Basin I characterized by a helix-like structure. The observed intermediary helix structure in our simulations, stabilized by the V24–K28 hydrophobic interaction, is in accord with the experimental α-helix structures observed during the fibrilization process of the Aβ1–40-protein.39 The V24–K28 hydrophobic interaction is destabilized by removing of the solvation water in the putative protofibril structures of Aβ1–4030,31 and Aβ1–4232 proteins.
The succession of helix structure formation, driven by the V24–K28 hydrophobic interaction and stabilized by intra-peptide hydrogen-bonds and electrostatic interaction, followed by destabilization in low-polar environment, is an exemplification of the principle of amyloid self-assembly (PASA).33 According to our results, the V24–K28 hydrophobic interaction decreases the distance between the D23 and K28 residues, enhancing the salt-bridge between the side-chains. Our work shows that the VGSN(24–27) loop, centered on S26 and stabilized by the V24–K28 hydrophobic interaction, is a transitory state between Basin I and Basin II, with small SC(V24)–SC(K28) and medium-ranged Cα(V24)–Cα(N27) distances. The flexibility about the G25 residue causes the peptide to fall into either Basin I or Basin II. The strong V24–K28 hydrophobic interaction forces the 23–25 and 25–27 fragments to shift out-of-plane, converging to a helix-like structure. In a reduced polar environment, like the protofibril structure, the hydrophobic interaction is diminished, and the two fragments 23–25 and 25–27 are stabilized in a planar loop structure by the D23–K28 salt-bridge. The increased amyloidogenic propensity of the E22Q mutant compared to the WT peptide appears to be correlated with the increased D23–K28 contact probabilities in the isolated monomer. The V24–K28 hydrophobic interaction, which drives the D23–K28 salt-bridges, is “dissolved” in the reduced-solvent environment of the putative protofibril structures.30–32
The multitude of the amyloid-like conformers, which contain mainly β-sheets, suggested that formation of amyloid fibrils is a general property of any polypeptide chain,38 while the sequence of the protein and the environmental conditions control the rate of aggregation.38 Increased hydrophobicity, through single point mutation, of the residues not involved in the folding core of the acylphosphatase (AcP) protein was shown to increase the rate of the aggregation process.40 The hydrophobicity of the side-chains of the quadrupole mutated S6 protein was proven to be responsible for the protein aggregation in a tetramer, with the Aβ homologous fragment forming inter-peptide antiparallel β-sheets.41 In contrast, a decrease of the hydrophobicity in the Aβ1–42-protein using random screening mutations, proved to make the protein less prone to aggregate.42 The net charge of proteins also influences the aggregation of proteins. The E22Q mutation increases the amyloidogenic propensity of the Aβ10–35-protein through a decrease of the desolvation barrier in the proximity of the hydrophobic core LVFFA(17 – 21).43 Inverse correlation of the aggregation propensity with the net charge of the muscle acylphosphatase (AcP) protein was found in denaturing conditions.44 In contrast, increase of the net charge of the RNase Sa at pH close to the pI of the protein was shown to destabilize the protein and further convert it into amyloid.45 A larger net charge compared to the hydrophobicity of a protein at physiological conditions was suggested to stabilize natively unstructured proteins.46 We expect that the increased propensity for α-helix formation compared to propensity for β-sheet should diminish the amyloidogenicity of the protein.40
4. Computational methods and models
4.1. Molecular dynamics
The molecular dynamics simulations were carried out using the program CHARMM47 version c29b1 with the PARAM2248 all-atom force field. The solvent was treated explicitly using the three point (TIP3P) model for water molecules.49 The structures of amyloid fibrils of the Aβ10–35-peptide forms fibrils with structures that are similar to the ones formed by the Aβ1–40 and Aβ1–42 proteins. A loop centered on the 21–30 segment brings the β-strands of the central hydrophobic core LVFFA(17–21) and the C-terminal region 29–3530,50 into contact. This observation and the fact that Aβ10–35-peptide forms parallel fibrils justifie the use of the Aβ10–35-protein as a model for the Aβ1–40 and Aβ1–42 proteins. The coordinates of the fragment 21–30 of the NMR structure of Aβ10–35-protein20 were used as initial coordinates of the Aβ21–30-peptide. The peptide N- and C- termini were acetylated and amidated, respectively. The protonation state of the titratable amino acids was fixed to the expected values at neutral pH in all simulations. The monomer was centered in a truncated octahedron cell that was carved from a larger pre-equilibrated cell of pure water. The size of the primary cell was set according to the minimum-image convention and periodic boundary conditions. To remove steric clashes between atoms, the steepest descent energy minimization algorithm was used for an initial 200 minimization steps, while the peptide atoms were fixed in their positions, achieving a RMS gradient of the potential energy of 0.9 kcal/mol/Å. The potential energy of the system was further minimized, using the adopted basis Newton-Raphson algorithm, until the RMS gradient of the potential energy was less than 0.1 kcal/mol/Å.
The system was heated linearly to 300 K over 120 ps followed by an equilibration phase involving two steps: the system was equilibrated for 80 ps using NVE molecular dynamics with a leapfrog integrator, followed by an additional 70 ps of NPT molecular dynamics. The pressure was restrained to 1 atm using a variant of the extended system method, the Langevin piston algorithm.51 The temperature was restrained to 300 K using the Nosé-Hoover thermostat.52 In order to prevent any conformational change of the peptide during the heating and equilibration phases, the monomer atoms were restrained about the starting structure using a harmonic restraint with force constant 20 kcal/mol/Å2. To assure a gentle equilibration of the water surrounding the monomer, the restraints were gradually reduced to zero. The center-of-mass of the monomer was constrained to the center-of-mass of the box of water using the miscellaneous mean field potential (MMFP) commands implemented in CHARMM. The electrostatic interactions were calculated with no truncation, using the particle mesh Ewald summation algorithm53 with a FFT grid point spacing of 0.95 Å, and a fifth-degree B-spline interpolation. The width of the Gaussian distribution in real-space was 0.32 Å−1. In order to reach the convergence of the electrostatic energy, the system was electrostatically neutralized by randomly adding one or two sodium ions in the WT or K28A systems, respectively. The real-space electrostatic and van der Waals interactions were smoothly shifted to zero at 10 Å, using an atom-based cutoff. The list of the non-bonded interactions was truncated at 12 Å. The lengths of the bonds containing hydrogen atoms were fixed with the SHAKE algorithm54 and the equation of motion was iterated using a time step of 2 fs in the leapfrog integrator.
4.2. Computational estimation of pKa
The effect of electrostatic interactions on a titratible residue at atomistic resolution and short time scales can be obtained from computationally derived pKa values. The electrostatic influence of the environment and sequence context result in a shift of the pKa value of the ith titratable residue, ΔpKa,i, relative to the value appropriate for the residue isolated in solution.55 The shift, ΔpKa,i was estimated by computing the for a given protein conformation as
| (1) |
A negative value of ΔpKa corresponds to a relatively favorable deprotonation of the ionizable residue, while a positive value implies a relatively favorable protonation state. The pKa shift is expressed as55
| (2) |
Where ΔGBorn is the difference between the free energy change associated with growing the distribution of the atomic partial charges in the protein and model structures, respectively. ΔGback is the background electrostatic free energy of interaction between the charged residue i and the atomic partial charges of the neutralized protein structure relative to the free energy in the model structure. ΔGinter is the electrostatic free energy of interaction between residue i and all the other j≠i titratable residues in the protein structure. In order to compute the terms in Eq. (2) one must first characterize the protonation state of each titratable residue in the protein structure. The probability of finding ionizable residue i in a protonated state is55
| (3) |
Where ∑{x} denotes a summation over all possible protonation states. For N ionizable residues in a protein structure, there are 2N protonation states. Ax depends on the interaction of titratable residue i with the solvated protein at a given pH. The pKa of residue i is defined to be the pH at which θi=0.5.
The Macroscopic Electrostatics with Atomic Detail (MEAD)56,57 package was used to compute the pKa values the titratable groups (E22, D23, and K28) in Aβ21–30-peptide structure. The dimension of the grid box was obtained by multiplying the maximum cartesian dimension of the peptide structure by a factor of 2. A grid size of 1.0 Å was used in the first iteration step. A second “focusing” iteration step used a grid size of 0.25 Å, while the grid box was centered on the ionizable residue. A value of 80 was used as the dielectric constant for aqueous solution, while for the peptide structure, values of both 4 and 20 were used, and the results were compared. The pKa were computed for Aβ21–30 structures separated by 10 ps in the simulated trajectories.
4.3. Free energy analysis
The disconnectivity graph representation of the free energy hypersurface (FEDG)36 is a complement to the potential energy disconnectivity graph.58,59 A 2 Å all-atom root-mean-squared displacement of structures separated by at least 10 ps in the simulated trajectories was used as a definition of distinct configurations in a cluster-based algorithm.37 The free energy is expressed as36
| (4) |
where kB is the Boltzmann’s constant and T is the absolute temperature of the system. Nii represents the number of microstates in basin i, while Nij is the number of transitions between basins i and j. The free energy of basin i is obtained for i=j. The free energy of transition between basins i and j is acquired for i≠j. The number of transitions between basins i and j was maximized using the Gomory-Hu “minimum cut” algorithm.60 Here, i and j define the number of structures within 0.2 Å bins along the two coordinates. Two consecutive analyzed structures are separated by 10 ps.
The free energy surface was estimated using a similar approach and projected on two coordinates: (1) the distance between the centers-of-mass of the V24 side-chain and the hydrophobic portion of the K28 side-chain and (2) the distance between the Cα atoms of the V24 and N27 residues.
Acknowledgments
We thank Dr. David Wales and Dr. Mark Miller for stimulating discussions about TRDG. This work was supported by a grant from the National Institutes of Health (R01 GM076688-05).
Abbreviations used
- Aβ
amyloid β-protein
- AD
Alzheimer’s disease
- CHARMM
Chemistry at HARvard Molecular Mechanics
- DB
desolvation barrier
- FE-TRDG
free energy transition disconnectivity graph
- FFT
fast Fourier transform
- LMW
low molecular weight
- MD
molecular dynamics
- MEAD
macroscopic electrostatics with atomic detail
- MMFP
miscellaneous mean field potential
- PASA
principle of amyloid self-assembly
- SC
side-chain
- TIP3P
transferable intermolecular potential 3 point
- TRDG
transition disconnectivity graph
- TS
transition state
- WT
wild type
Footnotes
Publisher's Disclaimer: This is a PDF file of an unedited manuscript that has been accepted for publication. As a service to our customers we are providing this early version of the manuscript. The manuscript will undergo copyediting, typesetting, and review of the resulting proof before it is published in its final citable form. Please note that during the production process errors may be discovered which could affect the content, and all legal disclaimers that apply to the journal pertain.
Contributor Information
John E. Straub, Email: straub@bu.edu.
D. Thirumalai, Email: thirum@umd.edu.
References
- 1.Glenner GG, Wong CW. Alzheimer’s disease: Initial report of the purification and characterization of a novel cerebrovascular amyloid protein. Biochem. Biophys. Res. Comm. 1984;120:885–890. doi: 10.1016/s0006-291x(84)80190-4. [DOI] [PubMed] [Google Scholar]
- 2.Masters CL, Simms G, Weinman NA, Multhaup G, McDonald BL, Beyreuther K. Amyloid plaque core protein in Alzheimer disease and Down syndrome. Proc. Natl. Acad. Sci. USA. 1985;82:4245–4249. doi: 10.1073/pnas.82.12.4245. [DOI] [PMC free article] [PubMed] [Google Scholar]
- 3.Selkoe DJ. Alzheimer’s disease: A central role for amyloid. J. Neuropathol. Exp. Neurol. 1994;53:438–447. doi: 10.1097/00005072-199409000-00003. [DOI] [PubMed] [Google Scholar]
- 4.Lambert MP, Barlow AK, Chromy BA, Edwardsdagger C, Freed R, Liosatos M, Morgan TE, Rozovsky I, Trommer B, Viola KL, Wals P, Zhang C, Finch CE, Krafft GA, Klein WL. Diffusible, nonfibrillar ligands derived from Aβ1–42 are potent central nervous system neurotoxins. Proc. Natl. Acad. Sci. USA. 1998;95:6448–6453. doi: 10.1073/pnas.95.11.6448. [DOI] [PMC free article] [PubMed] [Google Scholar]
- 5.Walsh DM, Hartley DM, Kusumoto Y, Fezoui Y, Condron MM, Lomakin A, Benedek GB, Selkoe DJ, Teplow DB. Amyloid β-protein fibrillogenesis: Structure and biological activity of protofibrillar intermediates. J. Biol. Chem. 1999;274:25945–25952. doi: 10.1074/jbc.274.36.25945. [DOI] [PubMed] [Google Scholar]
- 6.Hardy J, Selkoe DJ. The amyloid hypothesis of Alzheimer’s disease: Progress and problems on the road to therapeutics. Science. 2002;297:353–356. doi: 10.1126/science.1072994. [DOI] [PubMed] [Google Scholar]
- 7.Yong W, Lomakin A, Kirkitadze MD, Teplow DB, Chen SH, Benedek GB. Structure determination of micelle-like intermediates in amyloid β-protein fibril assembly by using small angle neutron scattering. Proc. Natl. Acad. Sci. USA. 2002;99:150–154. doi: 10.1073/pnas.012584899. [DOI] [PMC free article] [PubMed] [Google Scholar]
- 8.Harper JD, Lansbury PT., Jr Models of amyloid seeding in Alzheimer’s disease and scrapie: Mechanistic truths and physiological consequences of the time-dependent solubility of amyloid proteins. Annu. Rev. Biochem. 1997;66:385–407. doi: 10.1146/annurev.biochem.66.1.385. [DOI] [PubMed] [Google Scholar]
- 9.Bitan G, Kirkitadze MD, Lomakin A, Vollers SS, Benedek GB, Teplow DB. Amyloid β-protein (Aβ) assembly: Aβ40 and Aβ42 oligomerize through distinct pathways. Proc. Natl. Acad. Sci. USA. 2003;100:330–335. doi: 10.1073/pnas.222681699. [DOI] [PMC free article] [PubMed] [Google Scholar]
- 10.Massi F, Straub JE. Energy landscape theory for Alzheimer’s amyloid β-peptide fibril elongation. Proteins. 2001;42:217–229. doi: 10.1002/1097-0134(20010201)42:2<217::aid-prot90>3.0.co;2-n. [DOI] [PubMed] [Google Scholar]
- 11.Thirumalai D, Klimov DK, Dima RI. Emerging ideas on the molecular basis of protein and peptide aggregation. Curr. Opin. Struct. Biol. 2003;13:146–159. doi: 10.1016/s0959-440x(03)00032-0. [DOI] [PubMed] [Google Scholar]
- 12.Kirschner DA, Inouye H, Duffy LK, Sinclair A, Lind M, Selkoe DJ. Synthetic peptide homologous to beta protein from Alzheimer disease forms amyloid-like fibrils in vitro. Proc. Natl. Acad. Sci. USA. 1987;84:6953–6957. doi: 10.1073/pnas.84.19.6953. [DOI] [PMC free article] [PubMed] [Google Scholar]
- 13.Eisenberg D, Schwarz E, Komaromy M, Wall R. Analysis of membrane and surface protein sequences with the hydrophobic moment plot. J. Mol. Biol. 1984;179:125–142. doi: 10.1016/0022-2836(84)90309-7. [DOI] [PubMed] [Google Scholar]
- 14.Hilbich C, Kisters-Woike B, Reed J, Masters CL, Beyreuther K. Aggregation and secondary structure of synthetic amyloid beta A4 peptides of Alzheimer’s disease. J. Mol. Biol. 1991;218:149–163. doi: 10.1016/0022-2836(91)90881-6. [DOI] [PubMed] [Google Scholar]
- 15.Barrow CJ, Zagorski MG. Solution structures of β peptide and its constituent fragments: Relation to amyloid deposition. Science. 1991;253:179–182. doi: 10.1126/science.1853202. [DOI] [PubMed] [Google Scholar]
- 16.Sticht H, Bayer P, Willbold D, Dames S, Hilbich C, Beyreuther K, Frank RW, Rosch P. Structure of amyloid A4-(1–40)-peptide of Alzheimer’s disease. Eur. J. Biochem. 1995;233:293–298. doi: 10.1111/j.1432-1033.1995.293_1.x. [DOI] [PubMed] [Google Scholar]
- 17.Coles M, Bicknell W, Watson AA, Fairlie DP, Craik DJ. Solution structure of amyloid beta-peptide(1–40) in a water-micelle environment. Is the membrane-spanning domain where we think it is? Biochemistry. 1998;37:11064–11077. doi: 10.1021/bi972979f. [DOI] [PubMed] [Google Scholar]
- 18.Shao H, Jao S, Ma K, Zagorski MG. Solution structures of micelle-bound amyloid β-(1–40) and β-(1–42) peptides of Alzheimer’s disease. J. Mol. Biol. 1999;285:755–773. doi: 10.1006/jmbi.1998.2348. [DOI] [PubMed] [Google Scholar]
- 19.Crescenzi O, Tomaselli S, Guerrini R, Salvadori S, D’Ursi AM, Temussi PA, Picone D. Solution structure of the Alzheimer amyloid β-peptide (1–42) in an apolar microenvironment. Similarity with a virus fusion domain. Eur. J. Biochem. 2002;269:5642–5648. doi: 10.1046/j.1432-1033.2002.03271.x. [DOI] [PubMed] [Google Scholar]
- 20.Zhang S, Iwata K, Lachenmann MJ, Peng JW, Li S, Stimson ER, Lu Y, Felix AM, Maggio JE, Lee JP. The Alzheimer’s peptide Aβ adopts a collapsed coil structure in water. J. Struct. Biol. 2000;130:130–141. doi: 10.1006/jsbi.2000.4288. [DOI] [PubMed] [Google Scholar]
- 21.Massi F, Peng JW, Lee JP, Straub JE. Simulation study of the structure and dynamics of the Alzheimer’s amyloid peptide congener in solution. Biophys. J. 2001;80:31–44. doi: 10.1016/S0006-3495(01)75993-0. [DOI] [PMC free article] [PubMed] [Google Scholar]
- 22.Zhang S. Ph.D. Thesis. Boston: Boston University; 1999. Studies of beta amyloid congeners directed toward understanding the molecular mechanism underlying the formation of amyloid deposits in Alzheimer’s disease. [Google Scholar]
- 23.Massi F, Straub JE. Structural and dynamical analysis of the hydration of the Alzheimer’s β-amyloid peptide. J. Comput. Chem. 2003;24:143–153. doi: 10.1002/jcc.10101. [DOI] [PubMed] [Google Scholar]
- 24.Massi F, Klimov D, Thirumalai D, Straub JE. Charge states rather than propensity for β-structure determine enhanced fibrillogenesis in wild-type Alzheimer’s β-amyloid peptide compared to E22Q Dutch mutant. Protein Sci. 2002;11:1639–1647. doi: 10.1110/ps.3150102. [DOI] [PMC free article] [PubMed] [Google Scholar]
- 25.Chaney MO, Webster SD, Kuo YM, Roher AE. Molecular modeling of the Aβ1–42 peptide from Alzheimer’s disease. Protein Eng. 1998;11:761–767. doi: 10.1093/protein/11.9.761. [DOI] [PubMed] [Google Scholar]
- 26.Borreguero JM, Urbanc B, Lazo ND, Buldyrev SV, Teplow DB, Stanley HE. Folding events in the 21–30 region of amyloid β-protein (Aβ) studied in silico. Proc. Natl. Acad. Sci. USA. 2005;102:6015–6020. doi: 10.1073/pnas.0502006102. [DOI] [PMC free article] [PubMed] [Google Scholar]
- 27.Cruz L, Urbanc B, Borreguero JM, Lazo ND, Teplow DB, Stanley HE. Solvent and mutation effects on the nucleation of amyloid β-protein folding. Proc. Natl. Acad. Sci. USA. 2005;102:18258–18263. doi: 10.1073/pnas.0509276102. [DOI] [PMC free article] [PubMed] [Google Scholar]
- 28.Baumketner A, Bernstein SL, Wyttenbach T, Lazo ND, Teplow DB, Bowers MT, Shea JE. Structure of the 21–30 fragment of amyloid β-protein. Protein Sci. 2006;15:1239–1247. doi: 10.1110/ps.062076806. [DOI] [PMC free article] [PubMed] [Google Scholar]
- 29.Lazo ND, Grant MA, Condron MC, Rigby AC, Teplow DB. On the nucleation of amyloid β-protein monomer folding. Protein Sci. 2005;14:1581–1596. doi: 10.1110/ps.041292205. [DOI] [PMC free article] [PubMed] [Google Scholar]
- 30.Petkova AT, Ishii Y, Balbach JJ, Antzutkin ON, Leapman RD, Delaglio F, Tycko R. A structural model for Alzheimer’s β-amyloid fibrils based on experimental constraints from solid state NMR. Proc. Natl. Acad. Sci. USA. 2002;99:16742–16747. doi: 10.1073/pnas.262663499. [DOI] [PMC free article] [PubMed] [Google Scholar]
- 31.Petkova AT, Yau WM, Tycko R. Experimental constraints on quaternary structure in Alzheimer’s β-amyloid fibrils. Biochemistry. 2006;45:498–512. doi: 10.1021/bi051952q. [DOI] [PMC free article] [PubMed] [Google Scholar]
- 32.Lührs T, Ritter C, Adrian M, Riek-Loher D, Bohrmann B, Döbeli H, Schubert D, Riek R. 3D structure of Alzheimer’s amyloid-Aβ1–42 fibrils. Proc. Natl. Acad. Sci. USA. 2005;102:17342–17347. doi: 10.1073/pnas.0506723102. [DOI] [PMC free article] [PubMed] [Google Scholar]
- 33.Tarus B, Straub JE, Thirumalai D. Dynamics of Asp23-Lys28 salt bridge formation in Aβ10–35 monomers. J. Am. Chem. Soc. 2006;128:16159–16168. doi: 10.1021/ja064872y. [DOI] [PubMed] [Google Scholar]
- 34.Hernandez G. Ph.D. Thesis. Boston: Boston University; 2005. Unusual chemical and conformational properties in the Alzheimer’s disease Aβ peptide. [Google Scholar]
- 35.Forsyth WR, Antosiewicz JM, Robertson AD. Empirical relationships between protein structure and carboxyl pKa values in proteins. Proteins Struct. Funct. Genet. 2002;48:388–403. doi: 10.1002/prot.10174. [DOI] [PubMed] [Google Scholar]
- 36.Krivov SV, Karplus M. Free energy disconnectivity graphs: Application to peptide models. J. Chem. Phys. 2002;117:10894–10903. [Google Scholar]
- 37.Krivov SV, Karplus M. Hidden complexity of free energy surfaces for peptide (protein) folding. Proc. Natl. Acad. Sci. USA. 2004;101:14766–14770. doi: 10.1073/pnas.0406234101. [DOI] [PMC free article] [PubMed] [Google Scholar]
- 38.Chiti F, Dobson CM. Protein misfolding, functional amyloid, and human disease. Annu. Rev. Biochem. 2006;75:333–366. doi: 10.1146/annurev.biochem.75.101304.123901. [DOI] [PubMed] [Google Scholar]
- 39.Kirkitadze MD, Condron MM, Teplow DB. Identification and characterization of key kinetic intermediates in amyloid β-protein fibrillogenesis. J. Mol. Biol. 2001;312:1103–1119. doi: 10.1006/jmbi.2001.4970. [DOI] [PubMed] [Google Scholar]
- 40.Chiti F, Taddei N, Baroni F, Capanni C, Stefani M, Ramponi G, Dobson CM. Kinetic partitioning of protein folding and aggregation. Nat. Struct. Biol. 2002;9:137–143. doi: 10.1038/nsb752. [DOI] [PubMed] [Google Scholar]
- 41.Otzen DE, Kristensen O, Oliveberg M. Designed protein tetramer zipped together with a hydrophobic Alzheimer homology: A structural clue to amyloid assembly. Proc. Natl. Acad. Sci. USA. 2000;97:9907–9912. doi: 10.1073/pnas.160086297. [DOI] [PMC free article] [PubMed] [Google Scholar]
- 42.Wurth C, Guimard NK, Hecht MH. Mutations that reduce aggregation of the Alzheimer’s Aβ42 peptide: An unbiased search for the sequence seterminants of Aβ amyloidogenesis. J. Mol. Biol. 2002;319:1279–1290. doi: 10.1016/S0022-2836(02)00399-6. [DOI] [PubMed] [Google Scholar]
- 43.Massi F, Straub JE. Probing the origins of increased activity of the E22Q “Dutch” mutant Alzheimer’s β-amyloid peptide. Biophys. J. 2001;81:697–709. doi: 10.1016/S0006-3495(01)75734-7. [DOI] [PMC free article] [PubMed] [Google Scholar]
- 44.Chiti F, Calamai M, Taddei N, Stefani M, Ramponi G, Dobson CM. Studies of the aggregation of mutant proteins in vitro provide insights into the genetics of amyloid diseases. Proc. Natl. Acad. Sci. USA. 2002;99:16419–16426. doi: 10.1073/pnas.212527999. [DOI] [PMC free article] [PubMed] [Google Scholar]
- 45.Schmittschmitt JP, Scholtz MJ. The role of protein stability, solubility, and net charge in amyloid fibril formation. Protein Sci. 2003;12:2374–2378. doi: 10.1110/ps.03152903. [DOI] [PMC free article] [PubMed] [Google Scholar]
- 46.Uversky VN. Natively unfolded proteins: A point where biology waits for physics. Protein Sci. 2002;11:739–756. doi: 10.1110/ps.4210102. [DOI] [PMC free article] [PubMed] [Google Scholar]
- 47.Brooks BR, Bruccoleri R, Olafson B, States D, Swaninathan S, Karplus M. CHARMM: A program for macromolecular energy, minimization and dynamics calculations. J. Comp. Phys. 1983;4:187–217. [Google Scholar]
- 48.MacKerell AD, Jr, Bashford D, Bellott M, Dunbrack RL, Jr, Evanseck JD, Field MJ, Fischer S, Gao J, Guo H, Ha S, Joseph-McCarthy D, Kuchnir L, Kuczera K, Lau FTK, Mattos C, Michnick S, Ngo T, Nguyen D, Prodhom B, Reiher WE, III, Roux B, Schlenkrich M, Smith JC, Stote T, Straub JE, Watanabe M, Wiorkiewicz-Kuczera J, Yin D, Karplus M. All-atom empirical potential for molecular modeling and dynamics studies of proteins. J. Phys. Chem. B. 1998;102:3586–3616. doi: 10.1021/jp973084f. [DOI] [PubMed] [Google Scholar]
- 49.Jorgensen WL, Chandrasekhar J, Madura JD, Impey RW, Klein ML. Comparison of simple potential functions for simulating liquid water. J. Chem. Physiol. 1983;79:926–935. [Google Scholar]
- 50.Antzutkin ON, Leapman RD, Balbach JJ, Tycko R. Supramolecular structural constraints on Alzheimer’s beta-amyloid fibrils from electron microscopy and solid-state nuclear magnetic resonance. Biochemistry. 2002;41:15436–15450. doi: 10.1021/bi0204185. [DOI] [PubMed] [Google Scholar]
- 51.Feller SE, Zhang YH, Pastor RW, Brooks BR. Constant pressure molecular dynamics simulation: The Langevin piston method. J. Chem. Phys. 1995;103:4613–4621. [Google Scholar]
- 52.Hoover WG. Canonical dynamics: Equilibrium phase-space distributions. Phys. Rev. A. 1985;31:1695–1697. doi: 10.1103/physreva.31.1695. [DOI] [PubMed] [Google Scholar]
- 53.Darden T, York D, Pedersen L. Particle mesh Ewald: An N·log(N) method for Ewald sums in large systems. J. Chem. Phys. 1993;98:10089–10092. [Google Scholar]
- 54.Ryckaert JP, Ciccotti G, Berendsen HJC. Numerical-integration of Cartesian equations of motion of a system with constraints: Molecular dynamics of n-alkanes. J. Comp. Phys. 1977;23:327–341. [Google Scholar]
- 55.Bashford D, Karplus M. pKa’s of ionizable groups in proteins: Atomic detail from a continuum electrostatic model. Biochemistry. 1990;29:10219–10225. doi: 10.1021/bi00496a010. [DOI] [PubMed] [Google Scholar]
- 56.Bashford D, Gerwert K. Electrostatic calculations of the pKa values of ionizable groups in bacteriorhodopsin. J. Mol. Biol. 1992;224:473–486. doi: 10.1016/0022-2836(92)91009-e. [DOI] [PubMed] [Google Scholar]
- 57.Bashford D. An object-oriented programming suite for electrostatic effects in biological molecules. In: Ishikawa Y, Oldehoeft RR, Reynders JVW, Tholburn M, editors. Scientific computing in object-oriented parallel environments. Lecture notes in computer science ISCOPE97. vol. 1343. Berlin: Springer; 1997. p. 233. [Google Scholar]
- 58.Wales DJ, Scheraga HA. Global optimization of clusters, crystals, and biomolecules. Science. 1999;285:1368–1372. doi: 10.1126/science.285.5432.1368. [DOI] [PubMed] [Google Scholar]
- 59.Becker OM, Karplus M. The topology of multidimensional potential energy surfaces: Theory and application to peptide structure and kinetics. J. Chem. Phys. 1997;106:1495–1517. [Google Scholar]
- 60.Gomory RE, Hu TC. Multi-terminal network flows. J. Soc. Indust. Appl. Math. 1961;9:551–570. [Google Scholar]