

Abstract
Studies aimed at identifying body mass index (BMI) cutoffs representing increased diseased risk for Asians are typically based on cross sectional studies. This study determines an optimal BMI cutoff for overweight that represents elevated incidence of hypertension in Chinese adults with data from the China Health and Nutrition Survey 2000–2004 prospective cohort. Cumulative incidence was calculated by dividing new cases of hypertension over the study period by the total at-risk population, aged 18–65 years, in 2000. Sex-specific receiver operating characteristic (ROC) curves were used to assess the sensitivity and specificity of BMI as a predictor of hypertension incidence. Four-year cumulative incidences of hypertension (13% and 19% for women and men, respectively) were significantly (P < 0.005) related to the increase in BMI. The crude area under the curves (AUC) were 0.62 (95% CI: 0.59–0.65) and 0.62 (95% CI: 0.58–0.65) for men and women, respectively; the age-adjusted AUC were 0.68 (95% CI: 0.65–0.70) and 0.71 (95% CI: 0.68–0.74) for men and women, respectively. A BMI of 23.5 kg/m2 for women and 22.5 kg/m2 for men provided highest sensitivity and specificity (60%). The finding was consistent in different age groups. A BMI level of 25 kg/m2 provided lower sensitivities (36% for women and 29% for men) with higher specificities (80% for women and 85% for men). Our study supported the hypothesis that the BMI cutoff to define overweight should be lower in Chinese than in Western populations.
Keywords: Body mass index cutoffs, hypertension incidence, Chinese adults, overweight, ROC curve
Introduction
Increased prevalence, attributable death, and economic burdens of overweight and non-communicable diseases are emerging problems in China and other Asian countries (1-4). Although body mass index (BMI)6 cutoffs of 25 and 30 kg/m2 for overweight and obesity, respectively, have been widely used among Western populations and recommended by the World Health Organization as international criteria for body fatness at the population level (5), controversy remains about the optimal BMI cutoffs for Asians (6-8).
Most of the work that serves as background for these debates used (a) cross-sectional samples and (b) a P-value < 0.05 or non-overlapping 95% confidence intervals (95% CI) as a decision rule (6-8). Because P-values and 95% CI widths are driven by both magnitude of effect and sample size (9), findings will vary by sample size, BMI distributions, and prevalence of risk factors. A BMI cutoff of 23 kg/m2 has been proposed by some authors, who used sensitivity, specificity, and receiver operating characteristic (ROC) curve analysis (10-14). Because these studies were based on cross-sectional samples, we are not certain that the exposure to a higher BMI had preceded the hypertension outcome (15). We used an ROC curve analysis to determine an optimal BMI cutoff for overweight that represents elevated incidence of hypertension in Chinese adults.
Subjects and Methods
Subjects
The China Health and Nutrition Survey (CHNS) is an ongoing study established in the late 1980s in nine provinces that vary substantially in geography, economic development, public resources, and health indicators. A detailed description of the study design and data collection procedures has been presented elsewhere (16, 17). Data sets and questionnaires may be downloaded from the CHNS websites (http://www.cpc.unc.edu/china). For this analysis, we used data from the CHNS conducted in 2000 and 2004 because these two surveys had the most comparable study sample, questionnaires, and protocol and equipment in measuring blood pressure, weight, height, and waist circumference. Of 6162 participants who were 18–65-year-old men, non-pregnant or non-lactating women in 2000 and who were involved in both surveys, 5543 (90%) had complete and plausible measurements of blood pressure and other anthropometric measurements (e.g., 4-year changes in height < 10 cm and in BMI < 10 kg/m2; a baseline BMI of 15–40 kg/m2, waist circumference of 45–150 cm, waist-to-hip ratio of 0.6–1.3, and hip circumference of 55–155 cm; or the difference between systolic and diastolic blood pressure < 10 mmHg). Of the 5543 participants, 4492 (81%) with normal blood pressure in 2000 were included in our longitudinal sample. We only included 18–65-year-old adults, non-pregnant, and non-lactating women because a teenager, an older person, or a pregnant or lactating woman requires different BMI cutoffs (5). The exclusion of participants with extreme or implausible values of anthropometric measures or blood pressure helped to increase estimate precision without changing overall results.
Measurements
Three blood pressure measures were taken in seated position and on the right arm by trained health workers who followed a standardized procedure using regularly calibrated mercury sphygmomanometers with appropriate-sized cuffs. Systolic blood pressure was measured at the first appearance of a pulse sound (Korotkoff phase 1) and diastolic blood pressure at the disappearance of the pulse sound (Korotkoff phase 5). Three measurements of systolic or diastolic blood pressure were averaged to reduce the effect of measurement errors. Hypertension was defined as a systolic blood pressure ≥ 140 mmHg, a diastolic blood pressure ≥ 90 mmHg, or being previously diagnosed by a doctor (18). We did not include the use of an antihypertensive medication to define hypertension because in this sample, only a small proportion of Chinese adults was diagnosed (< 5%) or treated (< 3%) with any antihypertensive medications; and none used the medications without being diagnosed by a doctor. Moreover, sensitivity analysis showed that incorporating these measures produced similar findings but with a smaller sample size. Cumulative incidence was calculated by dividing new cases of hypertension over the study period by the total at-risk population, aged 18–65 years, in 2000.
BMI (kg/m2) was calculated based on weight and height, which were measured by trained health workers who followed standardized procedures and used regularly calibrated equipment (SECA 880 scales and SECA 206 wall-mounted metal tapes) (16, 17). Waist circumference was measured using a non-elastic tape at a point midway between the lowest rib margin and the iliac crest in a horizontal plane. Hip circumference was measured at the point yielding the maximum circumference over the buttocks. Covariates such as age, sex, smoking habits, alcohol consumption, and place of residence were collected by direct interviews.
Statistical analysis
We used Poisson regression models to examine the association between BMI and hypertension. Potential confounding factors at baseline, such as age (centered at 40 years), sex, smoking habits (dichotomized to never-smoker or ever-smoker), alcohol consumption (dichotomized to current drinker or non-drinker), place of residence (urban or rural), and waist circumference were taken into account in regression models. A covariate was considered as an effect-measure modifier if its interaction term with BMI in regression models had a P-value < 0.15 (chi squared test) or as a confounder if it caused a change in incidence ratios of more than 10%. Based on these criteria, the most reduced model had age as an effect-measure modifier (the association between BMI and hypertension was stronger among the younger participants); and sex and drinking status as confounding factors. We purposely stratified our analyses by sex to make them comparable with other studies.
To evaluate an optimal BMI cutoff, we computed and looked for the shortest distance on the sex-specific receiver operating characteristic (ROC) curve, estimated at each half unit of BMI. A distance on the ROC curve is equal to (12). Crude and adjusted area under the ROC curves (AUC) were estimated by using logistic regression models. Given the large sample size of the cohort, also we performed stratified analyses by age group. We used two-tail independent t-tests to compare two means and chi squared tests to compare different levels or trends of categorized variables. The attributable population risk was estimated by summing exposure-specific attributable fractions. We conducted all analyses using Stata software version 9.2 (Stata Inc., TX, USA).
Role of the funding sources and ethical consideration
The authors had full access to all of the data in the study and take responsibility for the integrity of the data and the accuracy of the data analysis. The sponsors were not involved in the study design, the collection, analysis, or interpretation of data, the writing or submission of the manuscript for publication. Written informed consent was obtained from each participant for each CHNS round. The Institutional Review Boards (IRB) of the School of Public Health, University of North Carolina at Chapel Hill and the Chinese Center for Disease Control and Prevention reviewed and approved the study.
Results
At baseline, mean systolic and diastolic blood pressures were higher among men compared to women (about 3 mmHg; P < 0.05). Women had a higher mean BMI and prevalence of overweight compared to men. The proportions of Chinese men who were smokers (63%) and alcohol drinkers (65%) were much higher than those of women (4 and 10%, respectively) (Table 1).
Table 1.
Characteristics of 18–65-year-old, normotensive participants in 20001
| Women (n = 2415)
|
Men (n = 2077)
|
|||
|---|---|---|---|---|
| Estimate | 95% CI | Estimate | 95% CI | |
| Age (year) | 42.5 | (42.1–42.9) | 41.5* | (41.0– 41.9) |
| Systolic blood pressure (mmHg) | 111.7 | (111.2–112.1) | 115.2* | (114.7– 115.7) |
| Diastolic blood pressure (mmHg) | 73.0 | (72.7–73.4) | 75.5* | (75.2– 75.9) |
| Body mass index (kg/m2) | 22.8 | (22.6–22.9) | 22.4* | (22.3– 22.5) |
| 15–18.5 kg/m2 (%) | 6.0 | (5.1–7.0) | 6.0 | (5.0– 7.0) |
| 23–40 kg/m2 (%) | 44.0 | (42.0– 46.0) | 38.1* | (36.0– 40.2) |
| 25–40 kg/m2 (%) | 21.7 | (20.0– 23.3) | 17.5* | (15.9– 19.2) |
| Ever-smoke cigarettes (%) | 3.6 | (2.9–4.4) | 62.9* | (60.8– 65.0) |
| Alcohol drinker (%) | 10.2 | (8.9–11.4) | 64.7* | (62.6– 66.8) |
| Urban resident (%) | 32.4 | (30.6–34.3) | 32.2 | (30.2– 34.2) |
Values are means or percentages with 95% CI, n = 4492 (excluded participants with implausible anthropometric indices e.g., BMI < 15 or > 40 kg/m2)
P < 0.05, compared to women; two-tail independent t-test for continuous variables or chi squared test for categorized variables.
Although the Chinese adults had a low mean BMI (a mean of 22.6 kg/m2; 95% CI: 22.5–22.7), four-year cumulative incidences of hypertension in women and men were 12.7% (95% CI: 11.3–14.0) and 18.7% (95% CI: 17.1–20.4), respectively. In general, about one fourth of the hypertensive new cases in the Chinese population are attributed to a BMI of 23 kg/m2 or higher. In addition, a higher population attributable risk was found in women and young participants. Crude incidence of hypertension among men was statistically higher than that of women at almost all BMI levels (e.g., 21–22.9, 23–24.9, and 25–29.9; P < 0.05). There is a decline in hypertension incidence at the BMI of 30–40 kg/m2 in men. The estimate, however, might not reflect a real trend of BMI and hypertension association because of a small number of participants that lead to less precise estimate in the BMI group (Figure 1A). The adjusted incidence of hypertension in men (in a hypothesized population at age of 40 years) was statistically higher than that of women at all BMI levels (Figure 1B).
Figure 1.

Four-year cumulative incidence and 95% CI of hypertension (new cases / 100 persons at risk) by body mass index levels in 2000. A, crude incidence; B, adjusted incidence in a hypothesized population at age of 40 years
* P < 0.05 chi squared test, compared to women; P-trend < 0.005 for all
The AUC for the prediction of hypertension by BMI (about 0.62) was significantly higher than what would be expected by chance, which indicated that BMI predicts hypertension. The AUC values were higher in younger compared to older participants (Table 2). Compared to the maximum value of AUC (1.0 for perfect prediction), these AUC values suggested that other risk factors also contributed to the prediction of hypertension. Controlling for age and other potential confounding factors, the AUC increased significantly to about 0.70, without reducing estimated precision.
Table 2.
Area under the receiver operating characteristic curves (AUC), optimal body mass index (BMI) cutoff values, sensitivities, and specificities stratified by sex and age at baseline for the prediction of hypertension incidence
| Optimal BMI cutoffs (kg/m2) | At a BMI of 25 (kg/m2) | ||||||
|---|---|---|---|---|---|---|---|
| n | AUC1 | Cutoffs | Sensitivity | Specificity | Sensitivity | Specificity | |
| Both sexes | |||||||
| All ages | 4492 | 0.61 | 22.5 | 0.62 | 0.56 | 0.32 | 0.82 |
| 18–40 years | 1999 | 0.64 | 22.5 | 0.63 | 0.61 | 0.33 | 0.85 |
| 41–65 years | 2493 | 0.59 | 23 | 0.56 | 0.57 | 0.31 | 0.80 |
| Women | |||||||
| All ages | 2415 | 0.62 | 23.5 | 0.56 | 0.65 | 0.36 | 0.80 |
| 18–40 years | 1053 | 0.64 | 23 | 0.59 | 0.66 | 0.31 | 0.85 |
| 41–65 years | 1362 | 0.59 | 23.5 | 0.57 | 0.58 | 0.37 | 0.76 |
| Men | |||||||
| All ages | 2077 | 0.62 | 22.5 | 0.61 | 0.59 | 0.29 | 0.85 |
| 18–40 years | 946 | 0.64 | 22.5 | 0.62 | 0.62 | 0.34 | 0.86 |
| 41–65 years | 1131 | 0.61 | 22.5 | 0.60 | 0.57 | 0.26 | 0.84 |
AUC values range from 0.5 (no prediction) to 1.0 (perfect prediction)
In this cohort, BMI levels of 23.5 kg/m2 for women and of 22.5 kg/m2 for men provided the shortest distance on the ROC curves (corresponding to a sensitivity and specificity of about 60%). The optimal BMI cutoff for ages 41–65 years was slightly higher compared to that for age 18–40 years. A BMI cutoff of 25 provided lower sensitivities (26–37%) and higher specificities (76–86%) compared to the optimal BMI cutoffs (Table 2). Figures 2A, 2B, 2C illustrate ROC curves and optimal BMI levels in different age and sex groups.
Figure 2.
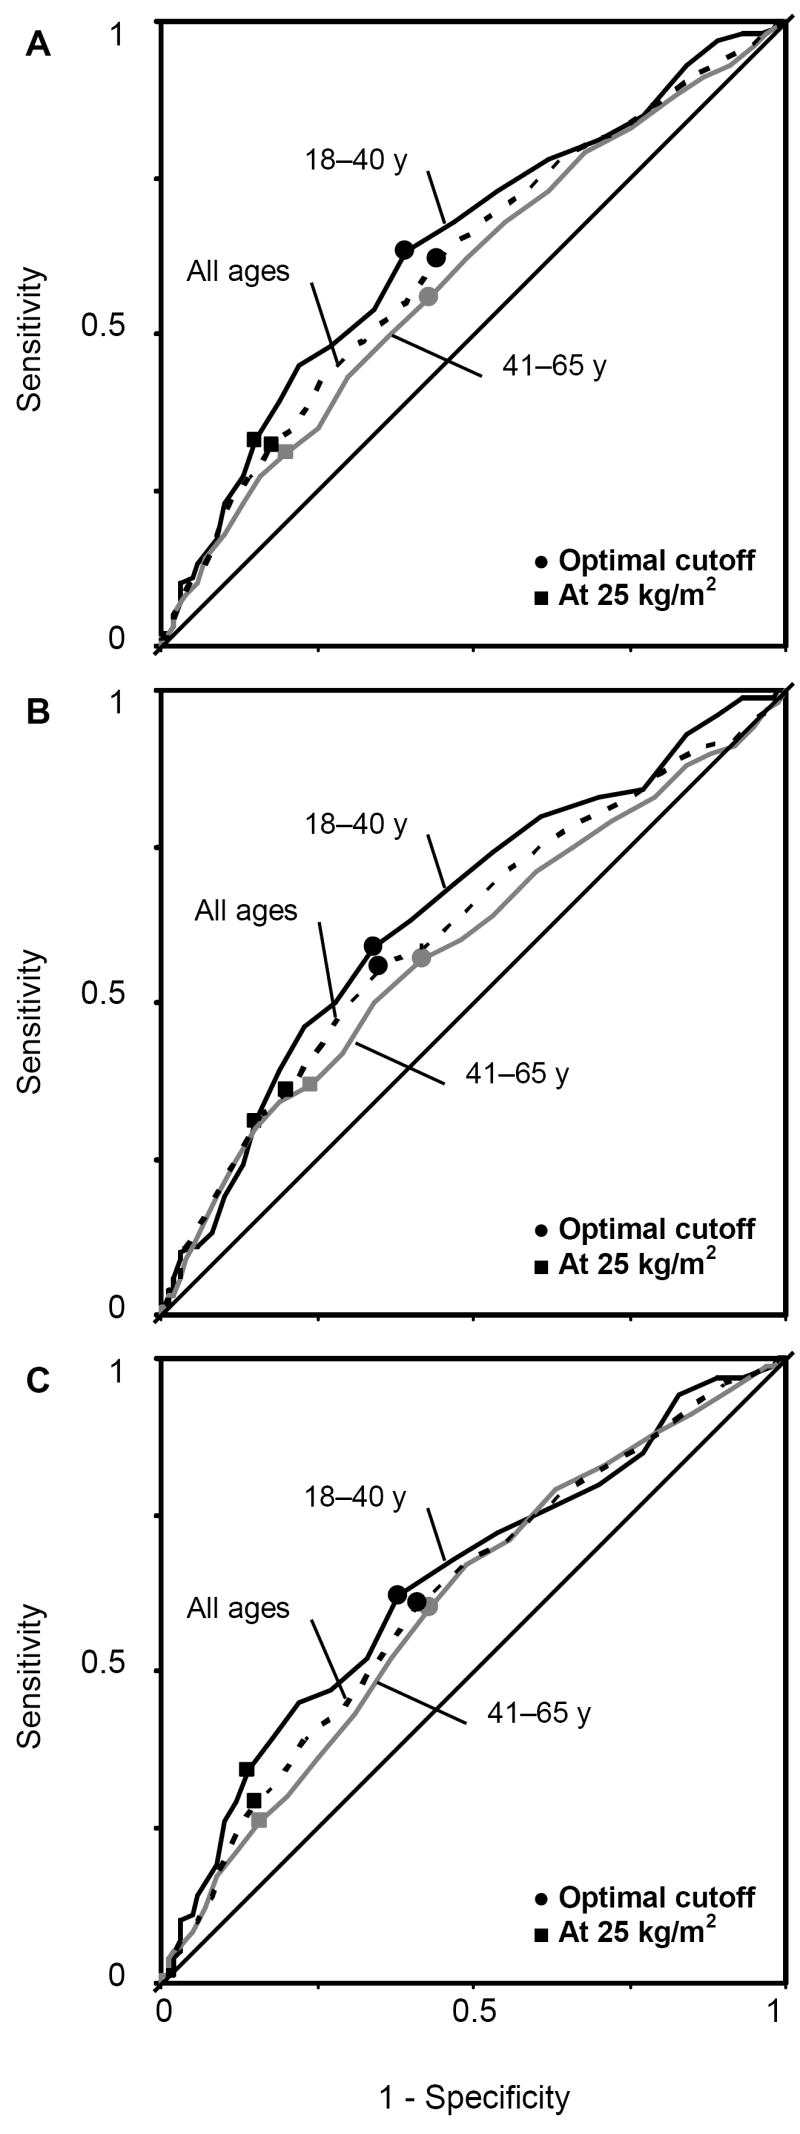
ROC curves for the prediction of hypertension by BMI by age groups. A, in both sexes; B, in women; and C, in men
Discussion
To our knowledge, we are the first to use ROC curve analyses to identify an optimal BMI cutoff for incident hypertension in an Asian sample. Our findings show a strong positive association between BMI and incidence of hypertension and suggest an optimal BMI cutoff of about 23.0 kg/m2 to define overweight in 18–65-year-old Chinese adults.
The significant trend of increased risk of hypertension with increased BMI is similar to results from cross-sectional studies in Asian populations (12, 13, 19-22). This longitudinal analysis of hypertension incidence confirms a dose-response relationship. Using the CHNS 2000–2004 cohort, Li et al. (23) also found higher hypertension incidence with higher BMI and waist circumference levels. Although both studies were based on data from the same cohort, they differ in focus. Our focus was on establishing optimal BMI cutoffs; while theirs was on comparing hypertension incidence or risk ratios among several BMI and waist circumference groups (23).
Our study suggests an optimal BMI cutoff of less than 25 kg/m2 for 18–65-year-old Chinese men and women. We found a slightly increase in the BMI cutoffs (about 0.5 kg/m2) among older compared to younger participants. There are several explanations for the lower optimal BMI cutoff for Asians compared to that of Westerners. First, Asian ethnicities tend to have a higher total body fat (24, 25) as well as a greater amount of abdominal and visceral fat (26, 27) at a given BMI compared to other races and ethnicities. Increased visceral fat mass leads to increased blood pressure via several mechanisms such as leptin resistance, insulin resistance, and inflammation (28, 29). Second, race/ethnic groups often differ in socioeconomic status, cultural factors, food habits, physical activity levels, and lifestyles (30, 31). Third, different ethnicities may have different combinations of genes associated with hypertension and gene-environment interactions that lead to the variation in blood pressure (28, 32-35). Finally, there is also speculation that insults during fetal development and infancy might have also resulted in the elevated risks. However, there is great debate about these relationships and their subsequent effects (36-40).
Our findings were consistent with results from large-scale cross-sectional studies in Chinese and Indian populations (10, 13, 21, 41). In those studies, a BMI cutoff of 22–24 kg/m2 was associated with an increase in prevalence of hypertension, diabetes mellitus, dyslipidemia, and cardiovascular diseases. Huxley et al. (14), in a sample of 263000 participants (73% Asian) from 21 cross-sectional studies in Australia and some Asian countries, also show an optimal BMI cutoff of about 24 kg/m2 for Asians.
Our proposed optimal BMI cutoff was lower than those suggested by authors who used total mortality as a study outcome in some Chinese longitudinal samples (42, 43). In those samples, a BMI of 24–24.9 kg/m2 in men, 25–26.9 kg/m2 in women (42), and 24–27.9 kg/m2 in both sexes (43) was associated with the lowest mortality rate. There are several potential explanations for the differences. First, at baseline, participants were much older in the studies by Gu et al. (42) (≥ 40 year-olds; a mean age of 56 years) and by Zhou (43) (≥ 30 year-olds, a mean age of 47 years) compared to ours (18–65 year-olds, a mean age of 42 years). The inclusion of an older participant would lead to (a) an increase in BMI due to the naturally decreased height and (b) a larger influence of other cardiovascular risks. Thus, the inclusion of an older participant would bias the association between BMI and health outcome toward the null and lead to a higher BMI cutoff. Second, mortality is influenced by factors other than BMI (e.g., diseases and pre-existing health conditions, HIV/AIDS, smoking habits, alcohol consumptions, other lifestyles factors, accidents, suicides, and health care services) (6, 7). Thus, we would see a higher BMI cutoff for an all-cause mortality outcome compared to hypertension or other cardiovascular risk. Third, in the studies by Gu et al. (42) and Zhou (43), the differences in death rates or risk ratios between different BMI levels were negligible (most of them had an overlapping 95% CI or a P-value > 0.05).
Even though the use of longitudinal data was a strength of our study, participant selection for this analysis sample may reduce the generalizability of the findings. This sample included only: (a) participants of both surveys (2000 and 2004), who tended to be older; and (b) normotensive participants in 2000, who tended to have a lower risk of hypertension (and associated risk factors, e.g., being a younger or female; having a lower BMI or smaller waist circumference; or less likely to smoke or drink alcohol). The inclusion of older participants, who had additional risk factors other than increased BMI, would bias the estimate for the association between BMI and hypertension toward the null and decrease the AUC values. In contrast, the inclusion of persons with a lower risk of hypertension in the longitudinal sample would bias the estimate away from the null and increase the AUC values.
Since a sensitivity analysis showed that optimal BMI cutoffs by level of risk factors such as age, smoking, or drinking status were similar to the overall sex-specific BMI cutoffs, selection bias was not likely to be a notable problem in this sample. Even though this participant selection did not affect our overall results, it would be better to have an open cohort to measure an incidence density, based on the number of new cases and total person-time at risk. However, we were not able to estimate the incidence density of hypertension in the CHNS samples because the exact time when the hypertension outcome occurred was unknown.
Similar to other cardiovascular risk factors, blood pressure might vary over time (18), and thus, a hypertensive patient in one survey could become normotensive in the next survey. In our study, the exclusion of hypertensive patients in 2000 would lead to a decrease in the mean blood pressures in 2000, and thus, lead to an increase in hypertension incidence. The findings need verifications from further studies that use other outcomes such as incidence of diabetes mellitus, dyslipidemia, cardiovascular disease events or mortality. Although BMI is positively associated with increased risk of cardiovascular risk, its predictions for those outcomes are moderate (AUC of 0.6–0.8) in Asian populations (11, 12, 14, 21). The moderate levels of AUC indicate that other factors also contribute to the prediction of cardiovascular risk. Thus, the BMI cutoff based on the sensitivity-specificity approach (a) is considered as a useful threshold to define overweight for public health and clinical recommendations and actions and (b) is not considered as the screening level for cardiovascular disease risk.
It is uncertain if the optimal BMI cutoffs, based on the longitudinal sample of Chinese adults, could be extrapolated to other Asian countries because Asians differ from each other in the association between BMI and non-communicable diseases. As noted earlier, Asian subpopulations may have different combinations of genes associated with hypertension and different gene-environment interactions that lead to a variation in blood pressure (28, 32-35, 44). There is a tendency of genotype clustering among residents in (a) the South Asia and some Southeast Asia (e.g., Thailand, Malaysia, and apart of Indonesia); (b) East Asia (e.g., China, Japan, and Korea) and some Southeast Asia (Vietnam, the Philippines, and apart of Indonesia) (34, 44). In combination with differences in environment, we might expect different associations between BMI and health risks in those countries.
In conclusion, this study suggests BMI values of 23.5 kg/m2 in women and 22.5 kg/m2 in men may be more appropriate for defining overweight in Chinese adults. Consistent with other cross-sectional studies, this study suggests that earlier prevention of excessive weight gain is needed to reduce hypertension in this population. Early prevention and control of hypertension and overweight are considered a cost-effective approach to decrease economic and health burdens of non-communicable diseases worldwide (2).
Acknowledgments
We thank Dr. Chirayath Suchindran for critically reading the article; Bill Shapbell for editing and Frances Dancy for administrative assistance.
Footnotes
Supported by the Vietnam Educational Foundation (VEF) and NIH (R01-HD30880, DK056350, and R01-HD38700).
Author disclosures: Nguyen T. Tuan, Linda S. Adair, Ka He, and Barry M. Popkin no conflicts of interest.
Abbreviation used: AUC, area under the curves; BMI, body mass index; CHNS, China Health and Nutrition Survey; ROC, receiver operating characteristic.
Literature cited
- 1.Liu L. Cardiovascular diseases in China. Biochem Cell Biol. 2007;85:157–63. doi: 10.1139/O07-004. [DOI] [PubMed] [Google Scholar]
- 2.WHO. The world health report 2002. Geneva: World Health Organization; 2003. [Google Scholar]
- 3.Popkin BM, Kim S, Rusev ER, Du S, Zizza C. Measuring the full economic costs of diet, physical activity and obesity-related chronic diseases. Obes Rev. 2006;7:271–93. doi: 10.1111/j.1467-789X.2006.00230.x. [DOI] [PubMed] [Google Scholar]
- 4.Popkin BM. Global nutrition dynamics: the world is shifting rapidly toward a diet linked with noncommunicable diseases. Am J Clin Nutr. 2006;84:289–98. doi: 10.1093/ajcn/84.1.289. [DOI] [PubMed] [Google Scholar]
- 5.WHO expert committee. Physical Status: the use and interpretation of anthropometry. Geneva: WHO; 1995. [PubMed] [Google Scholar]
- 6.Misra A. Revisions of cutoffs of body mass index to define overweight and obesity are needed for the Asian-ethnic groups. Int J Obes Relat Metab Disord. 2003;27:1294–6. doi: 10.1038/sj.ijo.0802412. [DOI] [PubMed] [Google Scholar]
- 7.Stevens J. Ethnic-specific revisions of body mass index cutoffs to define overweight and obesity in Asians are not warranted. Int J Obes Relat Metab Disord. 2003;27:1297–9. doi: 10.1038/sj.ijo.0802417. [DOI] [PubMed] [Google Scholar]
- 8.WHO expert consultation. Appropriate body-mass index for Asian populations and its implications for policy and intervention strategies. Lancet. 2004;363:157–63. doi: 10.1016/S0140-6736(03)15268-3. [DOI] [PubMed] [Google Scholar]
- 9.Weinberg CR. It’s time to rehabilitate the P-value. Epidemiology. 2001;12:288–90. doi: 10.1097/00001648-200105000-00004. [DOI] [PubMed] [Google Scholar]
- 10.Bei-Fan Z. Predictive values of body mass index and waist circumference for risk factors of certain related diseases in Chinese adults: study on optimal cut-off points of body mass index and waist circumference in Chinese adults. Asia Pac J Clin Nutr. 2002;11(Suppl 8):S685–93. [PubMed] [Google Scholar]
- 11.Ho SY, Lam TH, Janus ED. Waist to stature ratio is more strongly associated with cardiovascular risk factors than other simple anthropometric indices. Ann Epidemiol. 2003;13:683–91. doi: 10.1016/s1047-2797(03)00067-x. [DOI] [PubMed] [Google Scholar]
- 12.Weng X, Liu Y, Ma J, Wang W, Yang G, Caballero B. Use of body mass index to identify obesity-related metabolic disorders in the Chinese population. Eur J Clin Nutr. 2006;60:931–7. doi: 10.1038/sj.ejcn.1602396. [DOI] [PubMed] [Google Scholar]
- 13.Wildman RP, Gu D, Reynolds K, Duan X, He J. Appropriate body mass index and waist circumference cutoffs for categorization of overweight and central adiposity among Chinese adults. Am J Clin Nutr. 2004;80:1129–36. doi: 10.1093/ajcn/80.5.1129. [DOI] [PubMed] [Google Scholar]
- 14.Huxley R, James WP, Barzi F, Patel JV, Lear SA, Suriyawongpaisal P, Janus E, Caterson I, Zimmet P, et al. Ethnic comparisons of the cross-sectional relationships between measures of body size with diabetes and hypertension. Obes Rev. 2008;9:53–61. doi: 10.1111/j.1467-789X.2007.00439.x. [DOI] [PubMed] [Google Scholar]
- 15.Grimes DA, Schulz KF. Descriptive studies: what they can and cannot do. Lancet. 2002;359:145–9. doi: 10.1016/S0140-6736(02)07373-7. [DOI] [PubMed] [Google Scholar]
- 16.CPC-UNC. China Health and Nutrition Survey. 2007 Jul 13; cited 2007 September 15; Available from: http://www.cpc.unc.edu/china.
- 17.Popkin BM, Paeratakul S, Zhai F, Ge K. Dietary and environmental correlates of obesity in a population study in China. Obes Res. 1995;3(Suppl 2):135s–43s. doi: 10.1002/j.1550-8528.1995.tb00456.x. [DOI] [PubMed] [Google Scholar]
- 18.Chobanian AV, Bakris GL, Black HR, Cushman WC, Green LA, Izzo JL, Jr, Jones DW, Materson BJ, Oparil S, et al. The Seventh Report of the Joint National Committee on Prevention, Detection, Evaluation, and Treatment of High Blood Pressure: the JNC 7 report. Jama. 2003;289:2560–72. doi: 10.1001/jama.289.19.2560. [DOI] [PubMed] [Google Scholar]
- 19.Colin Bell A, Adair LS, Popkin BM. Ethnic differences in the association between body mass index and hypertension. Am J Epidemiol. 2002;155:346–53. doi: 10.1093/aje/155.4.346. [DOI] [PubMed] [Google Scholar]
- 20.Ho SC, Chen YM, Woo JL, Leung SS, Lam TH, Janus ED. Association between simple anthropometric indices and cardiovascular risk factors. Int J Obes Relat Metab Disord. 2001;25:1689–97. doi: 10.1038/sj.ijo.0801784. [DOI] [PubMed] [Google Scholar]
- 21.Lin WY, Lee LT, Chen CY, Lo H, Hsia HH, Liu IL, Lin RS, Shau WY, Huang KC. Optimal cut-off values for obesity: using simple anthropometric indices to predict cardiovascular risk factors in Taiwan. Int J Obes Relat Metab Disord. 2002;26:1232–8. doi: 10.1038/sj.ijo.0802040. [DOI] [PubMed] [Google Scholar]
- 22.Tesfaye F, Nawi NG, Van Minh H, Byass P, Berhane Y, Bonita R, Wall S. Association between body mass index and blood pressure across three populations in Africa and Asia. J Hum Hypertens. 2007;21:28–37. doi: 10.1038/sj.jhh.1002104. [DOI] [PubMed] [Google Scholar]
- 23.Li Y, Zhai F, Wang H, Wang Z, Popkin BM. A four-year prospective study of the relationship between body mass index and waist circumstances and hypertension in Chinese adults. Wei Sheng Yan Jiu. 2007;36:478–80. [PubMed] [Google Scholar]
- 24.Deurenberg P, Deurenberg-Yap M, Guricci S. Asians are different from Caucasians and from each other in their body mass index/body fat per cent relationship. Obes Rev. 2002;3:141–6. doi: 10.1046/j.1467-789x.2002.00065.x. [DOI] [PubMed] [Google Scholar]
- 25.Wang J, Thornton JC, Russell M, Burastero S, Heymsfield S, Pierson RN., Jr Asians have lower body mass index (BMI) but higher percent body fat than do whites: comparisons of anthropometric measurements. Am J Clin Nutr. 1994;60:23–8. doi: 10.1093/ajcn/60.1.23. [DOI] [PubMed] [Google Scholar]
- 26.Lear SA, Humphries KH, Kohli S, Chockalingam A, Frohlich JJ, Birmingham CL. Visceral adipose tissue accumulation differs according to ethnic background: results of the Multicultural Community Health Assessment Trial (M-CHAT) Am J Clin Nutr. 2007;86:353–9. doi: 10.1093/ajcn/86.2.353. [DOI] [PubMed] [Google Scholar]
- 27.Park YW, Allison DB, Heymsfield SB, Gallagher D. Larger amounts of visceral adipose tissue in Asian Americans. Obes Res. 2001;9:381–7. doi: 10.1038/oby.2001.49. [DOI] [PubMed] [Google Scholar]
- 28.Kaplan N. Primary hypertension: pathogenesis. In: Kaplan N, editor. Kaplan’s Clinical Hypertension. 9. Philadelphia: Lippincott Williams & Wilkins; 2006. pp. 50–121. [Google Scholar]
- 29.Sniderman AD, Bhopal R, Prabhakaran D, Sarrafzadegan N, Tchernof A. Why might South Asians be so susceptible to central obesity and its atherogenic consequences? The adipose tissue overflow hypothesis. Int J Epidemiol. 2007;36:220–5. doi: 10.1093/ije/dyl245. [DOI] [PubMed] [Google Scholar]
- 30.Bell AC, Adair LS, Popkin BM. Understanding the role of mediating risk factors and proxy effects in the association between socio-economic status and untreated hypertension. Soc Sci Med. 2004;59:275–83. doi: 10.1016/j.socscimed.2003.10.028. [DOI] [PubMed] [Google Scholar]
- 31.Merlo J, Asplund K, Lynch J, Rastam L, Dobson A. Population effects on individual systolic blood pressure: a multilevel analysis of the World Health Organization MONICA Project. Am J Epidemiol. 2004;159:1168–79. doi: 10.1093/aje/kwh160. [DOI] [PubMed] [Google Scholar]
- 32.Luft FC. Twins in cardiovascular genetic research. Hypertension. 2001;37:350–6. doi: 10.1161/01.hyp.37.2.350. [DOI] [PubMed] [Google Scholar]
- 33.Cui J, Hopper JL, Harrap SB. Genes and family environment explain correlations between blood pressure and body mass index. Hypertension. 2002;40:7–12. doi: 10.1161/01.hyp.0000022693.11752.e9. [DOI] [PubMed] [Google Scholar]
- 34.Maca-Meyer N, Gonzalez AM, Larruga JM, Flores C, Cabrera VM. Major genomic mitochondrial lineages delineate early human expansions. BMC Genet. 2001;2:13. doi: 10.1186/1471-2156-2-13. [DOI] [PMC free article] [PubMed] [Google Scholar]
- 35.Carretero OA, Oparil S. Essential hypertension. Part I: definition and etiology. Circulation. 2000;101:329–35. doi: 10.1161/01.cir.101.3.329. [DOI] [PubMed] [Google Scholar]
- 36.Adair LS, Cole TJ. Rapid child growth raises blood pressure in adolescent boys who were thin at birth. Hypertension. 2003;41:451–6. doi: 10.1161/01.HYP.0000054212.23528.B2. [DOI] [PubMed] [Google Scholar]
- 37.Barker DJ. Fetal programming of coronary heart disease. Trends Endocrinol Metab. 2002;13:364–8. doi: 10.1016/s1043-2760(02)00689-6. [DOI] [PubMed] [Google Scholar]
- 38.Demerath EW, Cameron N, Gillman MW, Towne B, Siervogel RM. Telomeres and telomerase in the fetal origins of cardiovascular disease: a review. Hum Biol. 2004;76:127–46. doi: 10.1353/hub.2004.0018. [DOI] [PMC free article] [PubMed] [Google Scholar]
- 39.Williams S, Poulton R. Birth size, growth, and blood pressure between the ages of 7 and 26 years: failure to support the fetal origins hypothesis. Am J Epidemiol. 2002;155:849–52. doi: 10.1093/aje/155.9.849. [DOI] [PubMed] [Google Scholar]
- 40.Singhal A, Lucas A. Early origins of cardiovascular disease: is there a unifying hypothesis? Lancet. 2004;363:1642–5. doi: 10.1016/S0140-6736(04)16210-7. [DOI] [PubMed] [Google Scholar]
- 41.Mohan V, Deepa M, Farooq S, Narayan KM, Datta M, Deepa R. Anthropometric cut points for identification of cardiometabolic risk factors in an urban Asian Indian population. Metabolism. 2007;56:961–8. doi: 10.1016/j.metabol.2007.02.009. [DOI] [PubMed] [Google Scholar]
- 42.Gu D, He J, Duan X, Reynolds K, Wu X, Chen J, Huang G, Chen CS, Whelton PK. Body weight and mortality among men and women in China. Jama. 2006;295:776–83. doi: 10.1001/jama.295.7.776. [DOI] [PubMed] [Google Scholar]
- 43.Zhou BF. Effect of body mass index on all-cause mortality and incidence of cardiovascular diseases--report for meta-analysis of prospective studies open optimal cut-off points of body mass index in Chinese adults. Biomed Environ Sci. 2002;15:245–52. [PubMed] [Google Scholar]
- 44.Macaulay V, Hill C, Achilli A, Rengo C, Clarke D, Meehan W, Blackburn J, Semino O, Scozzari R, et al. Single, rapid coastal settlement of Asia revealed by analysis of complete mitochondrial genomes. Science. 2005;308:1034–6. doi: 10.1126/science.1109792. [DOI] [PubMed] [Google Scholar]