Abstract
Parkinson's disease is a common progressive neurodegenerative disorder characterized by the degeneration of dopaminergic neurons in the substantia nigra pars compacta. Mitochondrial dysfunction has been strongly implicated in the pathogenesis of Parkinson’s disease. Thus, therapeutic approaches that improve mitochondrial function may prove to be beneficial. Previously, we have documented that near-infrared light via light-emitting diode (LED) treatment was therapeutic to neurons functionally inactivated by tetrodotoxin, potassium cyanide (KCN), or methanol intoxication, and LED pretreatment rescued neurons from KCN-induced apoptotic cell death. The current study tested our hypothesis that LED treatment can protect neurons from both rotenone- and MPP+-induced neurotoxicity. Primary cultures of postnatal rat striatal and cortical neurons served as models, and the optimal frequency of LED treatment per day was also determined. Results indicated that LED treatments twice a day significantly increased cellular ATP content, decreased the number of neurons undergoing cell death, and significantly reduced the expressions of reactive oxygen species and reactive nitrogen species in rotenone- or MPP+-exposed neurons as compared to untreated ones. These results strongly suggest that LED treatment may be therapeutic to neurons damaged by neurotoxins linked to Parkinson’s disease by energizing the cells and increasing their viability.
Keywords: ATP content, cytochrome oxidase, near-infrared light, nitric oxide, Parkinson’s disease, reactive oxygen species
INTRODUCTION
Parkinson’s disease (PD) is one of the major human neurodegenerative disorders characterized by a progressive loss of dopaminergic neurons and the formation of Lewy body aggregates (Hirsch et al. 1997; Kaur and Andersen, 2002). Dopamine deficiency and defects in mitochondrial complex I activity play important roles in the manifestation of PD (Javitch et al. 1985; Parker et al. 1989). Previous studies in humans and experimental animals have shown that 1-methyl-4-phenylpyridinium ion (MPP+), the ultimate metabolic product of 1-methyl-4-phenyl-1,2,3,6-tetrahydropyridine (MPTP), can induce PD-like symptoms (Lagnston et al. 1983; Schmidt and Ferger, 2001; Sherer et al. 2002). MPP+ is taken into dopaminergic neurons and presumably other neurons and accumulates in the mitochondria, where it inhibits complex I activity. Although the exact mechanism of MPP+-induced neurotoxicity is not fully understood, increasing evidence supports the involvement of reactive oxygen species (ROS) and reactive nitrogen species (RNS) (Metodiewa and Koska, 2000; Dawson and Dawson, 2003). Rotenone, another complex I inhibitor, inhibits the transfer of electrons from Fe-S centers to ubiquinone and thus reduces cellular ATP synthesis (Sherer et al., 2003; Hirata and Nagatsu, 2005). Both rotenone and MPP+ mediate a variety of neuronal dysfunction and oxidative stress, leading to cell death (Cassarino et al. 1999; Watabe et al. 2004; Wang et al. 2005).
Near-infrared light (NIR) via light-emitting diode (LED) treatment promotes wound healing in humans and animals (Whelan et al., 2001). It up-regulates cytochrome oxidase activity and ATP content in primary cultures of rat visual cortical neurons functionally inactivated by tetrodotoxin, potassium cyanide (KCN), or sodium azide (N3Na) (Wong-Riley et al. 2001; 2005). Photobiomodulation is therapeutic to rat retinal neurons poisoned by methanol-induced formate (Eells et al. 2003), a reversible inhibitor of cytochrome oxidase. LED pretreatment induces the down-regulation of apoptotic proteins and up-regulation of anti-apoptotic proteins, as well as reduces the production of reactive oxygen species in KCN-exposed neurons (Liang et al. 2006). However, whether LED will be protective of neurons suffering from neurodegenerative disorders was entirely unknown, and the optimal frequency of LED treatment per day was also not known. Previously, we found that 670 nm and 830 nm were the most effective, while 728 nm was the least effective wavelength in reversing the down-regulation of cytochrome oxidase activity and cellular ATP content induced by toxins (Wong-Riley et al., 2005). The goal of the present study was to determine the optimal frequency of LED treatment per day and to test our hypothesis that NIR-LED is therapeutic to neurons injured by toxins known to induce Parkinsonian symptoms. Primary cultures of rat striatal and cortical neurons were used to test the effects of MPP+ and rotenone exposure with and without LED treatment. Primary neurons were used instead of cell lines because they are more representative of neurons in vivo. Midbrain substantia nigral neurons from newborn rat pups were technically too difficult to culture for multiple parallel experiments because of their small size, paucity in number, and immaturity at birth. On the other hand, striatal neurons are known to be affected by Parkinson’s disease, while cortical neurons have previously been tested to respond to the therapeutic effect of LED while under the toxic influence of TTX or cyanide (Wong-Riley et al., 2005).
Results indicate that LED twice a day was most effective in protecting neurons against the toxins and that LED may serve as an effective therapeutic agent for neurons undergoing neurodegenerative changes.
EXPERIMENTAL PROCEDURES
Primary neuronal culture and treatments
Sprague Dawley rats (1-day-old) were used for primary cultures of occipital cortical and striatal neurons as previously described (Liang et al., 2006). Experiments were carried out on 5–10 day old cultures, with or without 670 nm LED treatment. An LED array (25 cm × 10 cm) with a peak wavelength of 670 nm (Quantum Devices, Inc. Barnaveld, WI) was placed beneath covered culture dishes of 35 mm or 60 mm in diameter, with the room light turned off and irradiated accordingly. Initially, the optimal frequency of LED treatment was tested on potassium cyanide-poisoned rat cortical neurons. Cells were divided into 6 groups: 1) Sham control: normal neurons were taken out of the incubator and set in the dark for 80 sec, similar to experimental groups, but without KCN exposure or LED treatment; 2) exposure to 300 µM KCN alone for 24 h; and 3–6) KCN exposure for 24 h, during which LED treatments (670 nm; 80 sec; at 4 J/cm2 and 50 mW/cm2) were given 1, 2, 3, or 4 times within the first 8 h (i.e., immediately for all 4 groups; plus 4 h later for the 2-treatment; plus 2 h 40 min and 5 h 20 min for the 3-treatment; and plus 2, 4, and 6 h later for the 4-treatment groups). Cells were harvested at the end of the 24 h period. Groups 7 and 8 tested LED treatments for 1, 2, 3, or 4 times per day during KCN exposure for 3 or 5 days. Once the optimal frequency of treatment was determined, it was administered to rotenone-or MPP+-exposed striatal and cortical neurons. Cells were divided into another 3 major groups: 1) Sham controls; 2) exposure to different concentrations of rotenone or MPP+ for 48 h; and 3) rotenone or MPP+ exposure for 48 h, and LED treatment (670 nm; 80 sec; at 4 J/cm2 and 50 mW/cm2) given twice a day for 48 h.
Hoechst (nuclear) staining
Nuclear staining and quantification were performed as previously described (Liang et al., 2006). The fluorescent DNA-binding dye Hoechst 33258 (Sigma, St. Louis, MO) at a concentration of 1 µg/ml was used to reveal nuclear condensation or aggregation. Hoechst-stained cells were visualized and photographed using the BA450 filter under a Nikon fluorescent microscope. Five hundred to 1000 cells in five to ten separate fields of each coverslip in each group were counted, and counts were made under the same treatment condition and repeated at least three times.
Measurement of intracellular reactive oxygen species (ROS)
ROS levels were determined by using 5-(and -6) chloromethyl-2’, 7-dichlorodihydrofluorescein diacetate, acetyl ester (CM-H2DCFDA, Molecular Probes, Inc., Eugene, OR). Control and treated neurons were washed with BSS (balanced salt solution) and incubated with 2 µM CMH2DCFDA in BSS for 20 min at 37°C. After washing, cells were switched to normal growth medium and viewed with a Nikon fluorescent microscope. The fluorescence intensity was measured by using the NIH ImageJ software ij134.
Measurement of intracellular nitric oxide (NO)
Intracellular NO levels were monitored by using DAF-2 DA (4,5-diaminofluorescein diacetate) fluorescence probe (Calbiochem, San Diego, CA) as described previously (Thomas et al., 2007). Treated neurons were washed with BSS and incubated in fresh culture medium without serum. DAF-2 DA was added at a final concentration of 5 µM, and cells were incubated for 1 h at 37°C. After washing with BSS, cells were maintained in normal culture medium. Fluorescence was monitored using a Nikon fluorescent microscope. The intensity of fluorescence was measured by using the NIH ImageJ software ij134.
Immunocytochemistry for nitrotyrosine
Neurons were washed with phosphate-buffered saline and fixed with 4% paraformaldehyde in 0.1 M sodium phosphate buffer (pH 7.4) for 20 min on ice, followed by incubation for 10 min in 100% methanol. After blocking non-specific binding with 1% bovine serum albumin and 4% normal goat serum for 1 h, cells were incubated with polyclonal antibodies against nitrotyrosine (Upstate, Lake Placid, NY; gift of Dr. D. Riley) at 1:250 dilution overnight at 4°C. This was followed by goat-anti-rabbit (Bio-Rad, Hercules, CA) secondary antibodies conjugated to horseradish peroxidase at 1:100 dilution for 2 h at room temperature. The labeling of cytoplasm was visualized by using the diaminobenzidine reaction.
ATP Content with Bioluminescence Assays
Measurement of cellular ATP content in cotrol and experimental groups were as previously described (Wong-Riley et al., 2005), using components of the bioluminescent somatic cell assay kit (Sigma). Briefly, cultured cells were rinsed with cold phosphate-buffered saline, incubated in cold somatic cell ATP releasing reagent for 5 min on ice, and harvested by a cell scraper. They were mixed with the luciferase ATP assay mix and assayed with a luminometer (Berthold Detection Systems, Oak Ridge, TN). Values were expressed as nanomolar ATP content per milligram of protein. ATP contents of control neurons treated with LED only, twice a day, for 1, 3, or 5 days were also tested.
Cytochrome oxidase reactions
Control and experimental cultures were fixed with 4% paraformaldehyde in 0.1 M phosphate buffer (pH 7.4) with 4% sucrose for 1 h on ice. Cytochrome oxidase reactions were performed in an incubation medium containing 0.05% 3, 3’-diaminobenzidine (DAB) (Sigma) and 0.03% cytochrome c (Sigma) in phosphate buffered saline (Zhang and Wong-riley, 1999).
Optical densitometry analysis
To analyze quantitative changes in cytochrome oxidase activity following different treatments, optical densities of reaction product were measured by means of a Zonax MPM03 photometer (Zeiss, Thornwood, NY) attached to a Zeiss compound microscope. Measurements were used with a 25x objective and a spot size of 2 µm diameter directed at the centers of cytoplasm of individual neurons. Possible variations in coverslip and slide thickness were negated by adjusting a blank region of each coverslip/slide to zero. For each treatment group, readings were taken from 100–200 cells in five random fields. The mean value ± S.E.M. of reaction product in each study were based on three independent experiments
Statistics
ANOVA and two-tailed Student’s t-test were used for paired comparisons and analysis of variance for group differences between treated and untreated ones. A P value of 0.05 or less was considered significant.
RESULTS
Optimal regimen of LED treatment for rescuing neurons from apoptotic cell death
Approximately 5–10 % of rat cortical neurons underwent apoptosis in normal primary cultures, and 24 h of exposure to 300 µM KCN induced approximately 42 % of them to undergo apoptosis. LED treatment once a day immediately after exposure to KCN significantly decreased the number of apoptotic neurons by 22.8% (P < 0.05) and treatments twice a day reduced it by 33.8% (P < 0.001). However, three or four LED treatments during the 24 h period did not result in a significant reduction of apoptosis (Fig. 1).
Fig. 1.
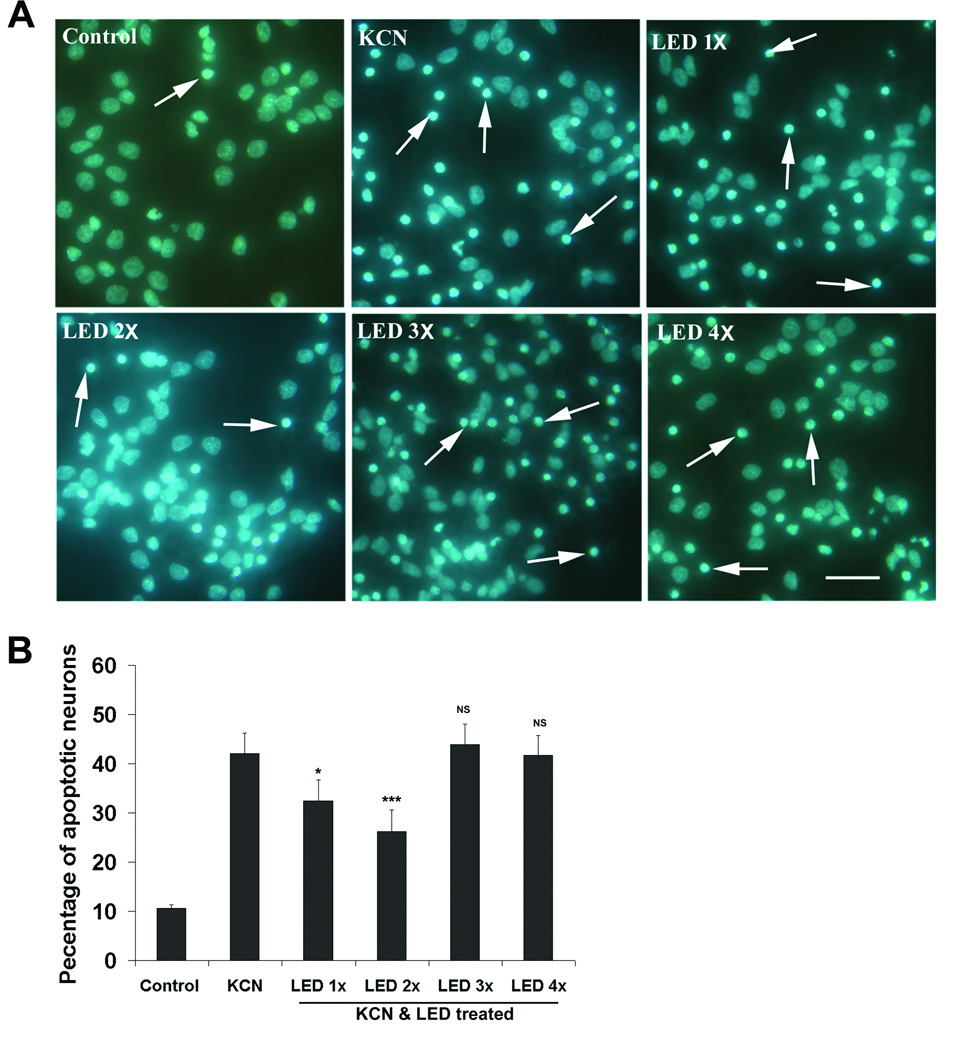
Hoechst staining of primary cultured cortical neurons exposed to KCN and treated with LED for varying number of times during the first 8 h of KCN exposure. A: Apoptotic neurons (arrows) showed condensation or decreased nuclear size, with or without nuclear fragmentation. Scale bar = 30 µm for all. B: Quantification of apoptotic neurons as percentage of total cell population in each group. Two times of LED treatment was more effective in reducing the percentage of apoptotic neurons than once a day, while 3 or 4 times a day were not effective. All treatments were significantly different from controls. *, P < 0.05, ***, P < 0.001 compared to KCN alone.
Changes in DCFDA intensity in response to different frequencies of LED treatment
DCFDA is a marker of reactive oxygen species (ROS). The intensity of DCFDA was measured in sister cultures exposed to KCN and varying numbers of LED treatment. Two to four times of LED treatment in a 24-hour period all significantly decreased the DCFDA intensity in comparison to KCN alone (P < 0.001). However, these levels remained higher than that of normal controls (P < 0.05-0.001). One LED treatment in a 24-hour period did not reduce ROS production significantly below that of KCN alone. The intensity of DCFDA actually increased progressively from 2 to 4 times of LED treatment within a 24-hour period (Fig. 2).
Fig. 2.
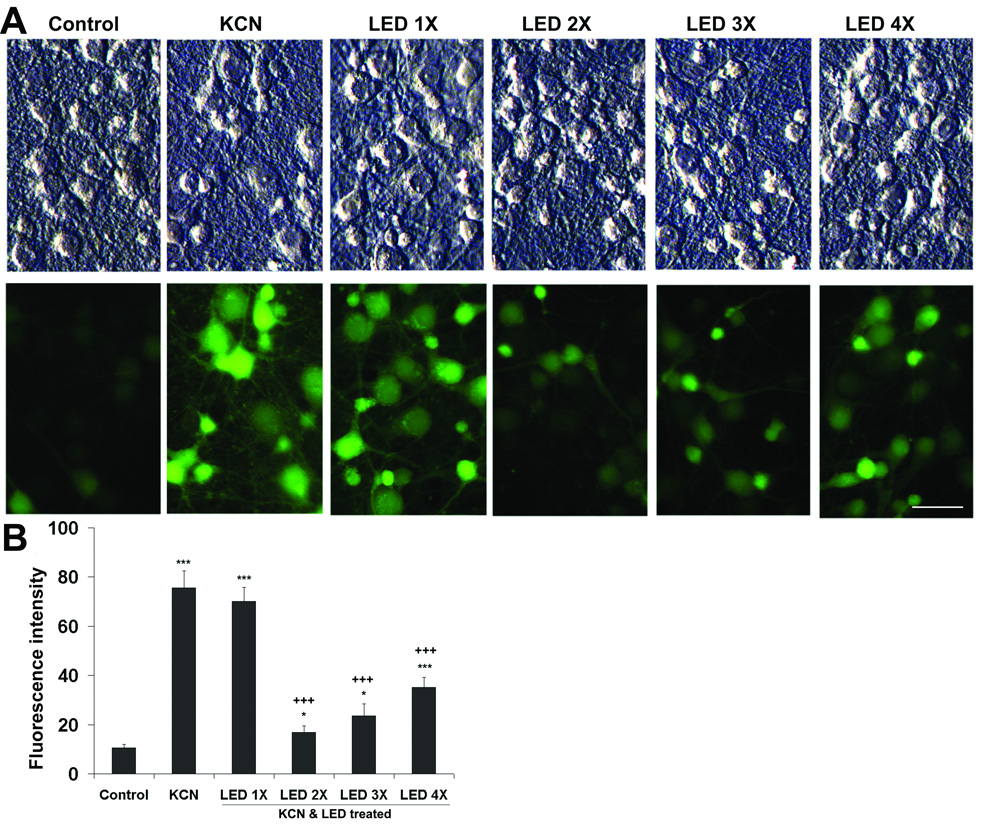
ROS measurement by CM-H2DCFDA fluorescence in cortical neurons exposed to 300 µM KCN and various LED treatments for 24 h. A: Top panels: phase contrast; lower panels, the same fields as those in the top panels, but with CM-H2DCFDA fluorescence. CM-H2DCFDA expression was increased by KCN exposure, but the fluorescent signals were much lower in the two- and three- times-a-day LED-treated cells as compared to the others. Scale bar = 30 µm for all. B: Quantitative analyses of ROS expression. Two and three times of LED treatment exhibited significantly lower CM-H2DCFDA fluorescent values than those with other forms of LED treatment. LED once a day was not effective. All *P values were compared to controls: *, P < 0.05, ***, P < 0.001. +++, P < 0.001 compared to KCN alone.
LED treatment reduced the NO production in neurons exposed to KCN
The intensity of DAF-2 DA was measured in sister cultures exposed to KCN with or without LED treatment. Two or three times of LED treatment during the first 8 h significantly decreased DAF-2 DA intensity compared to KCN exposure alone (P < 0.01), while a single LED treatment did not result in any significant decrease in DAF-2 DA intensity, and four LED treatments within a 24 hour period also did not reduce DAF-2 DA intensity as compared to KCN alone. All four types of LED regimen during the first 24 h reduced the NO production, but none returned it to control levels (P < 0.001) (Fig. 3). Three days of LED treatment at two times per day significantly decreased the DAF-2 DA intensity in comparison to KCN alone (P < 0.001; Figs. 4A,C, D, and E), but these levels remained higher than those of normal controls (P < 0.01; Fig. 4E). Normal neuronal cultures treated with LED for 3 days did not increase, but rather, significantly decreased nitric oxide production as compared to controls (P < 0.001; Fig. 4A, B, and E).
Fig. 3.
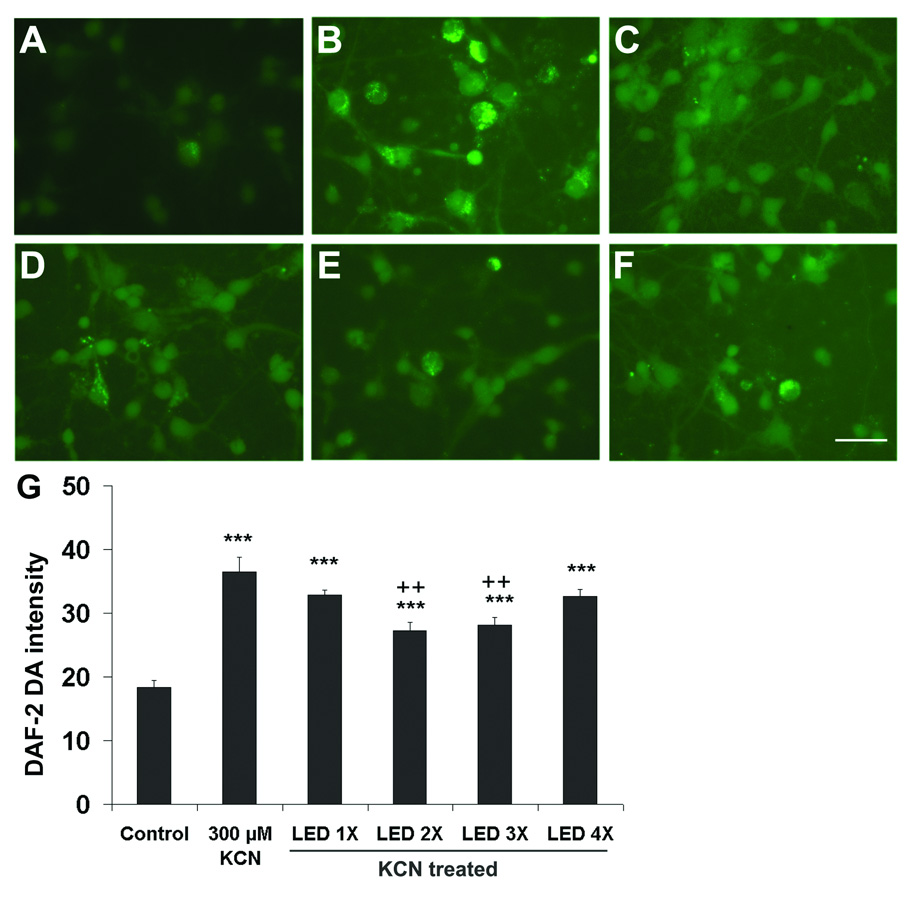
NO production as measured by DAF-2 DA fluorescence in cortical neurons exposed to 300 µM KCN and varying numbers of LED treatment for 24 h. DAF-2DA expression was increased by KCN exposure, but the fluorescent signals were significantly lower in cells treated with LED for two and three times than those of others. A: Control, B: KCN alone, C–F: One, two, three and four times of LED treatment, respectively. Scale bar = 30 µm for all. G: Quantitative analyses of NO expression. Two and three times of LED treatment resulted in a significant reduction of DAF-2 DA fluorescence as compared to once or 4 times a day of LED treatment, both of which were not effective. ***, P < 0.001 compared to controls; ++, P < 0.01 compared to KCN alone.
Fig. 4.
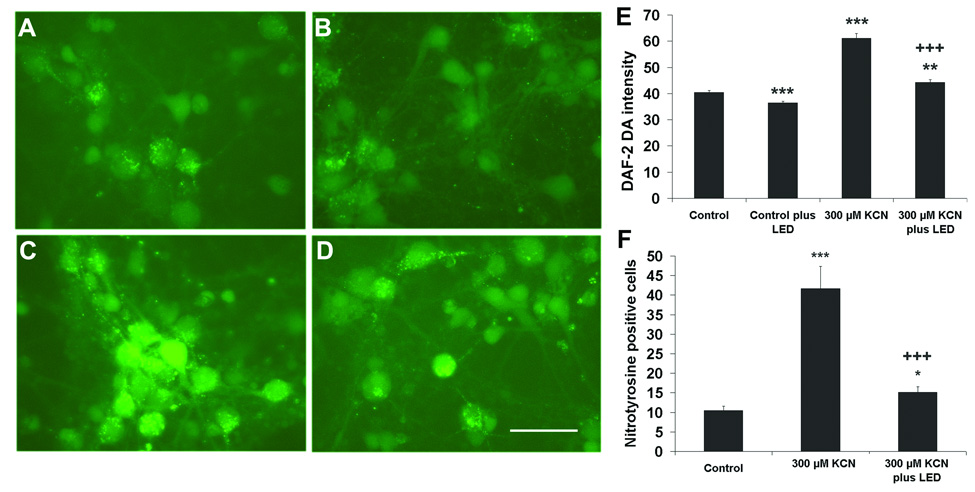
NO production as measured by DAF-2 DA fluorescence and nitrotyrosine expression in cortical neurons exposed to KCN for 3 days. Two times of LED treatment per day significantly decreased the DAF-2 DA intensity in KCN-exposed neurons, and even that of normal cultured neurons. A: Control; B: Control plus twice-a-day LED; C: KCN alone; D: KCN plus twice-a-day LED. E: Quantitative analyses of NO expression. F: Quantification of nitrotyrosine-immunoreactive neurons exposed to KCN and LED treated twice a day for 3 days. Two times of LED treatment significantly decreased the number of nitrotyrosine-positive cells as compared to KCN exposure alone. All *P values were compared to controls: **, P < 0.01, ***, P < 0.001. +++, P < 0.001 compared to KCN alone.
LED treatment down-regulated nitrotyrosine expression in neurons
Nitrotyrosine is an indicator of cell damage and results from the nitration of tyrosine residues in proteins by peroxynitrite, a product of nitric oxide and superoxide. The expression of nitrotyrosine was at a low level (10.5%) in normal primary cultures. However, the number of nitrotyrosine-positive neurons increased significantly after exposure to 300 µM of KCN for 3 days (P < 0.001). Twice a day of LED treatment significant reduced nitrotyrosine expression and decreased the number of nitrotyrosine-positive neurons (P < 0.05; Fig. 4F).
Changes in cytochrome oxidase activity in response to LED treatment
Cytochrome oxidase activity was significantly decreased after 24 h of exposure to 300 µM KCN (P < 0.001). Among the LED treatments for 1, 2, 3, and 4 times during the first 8 h of exposure to KCN, only twice a day significantly increased cytochrome oxidase activity above levels for KCN alone (P < 0.05), but it still did not reach control values. One, three or four times of LED treatment during the first 8 h all showed some increases in cytochrome oxidase activity, but none of these reached significant levels above that of KCN alone (Fig. 5A).
Fig. 5.
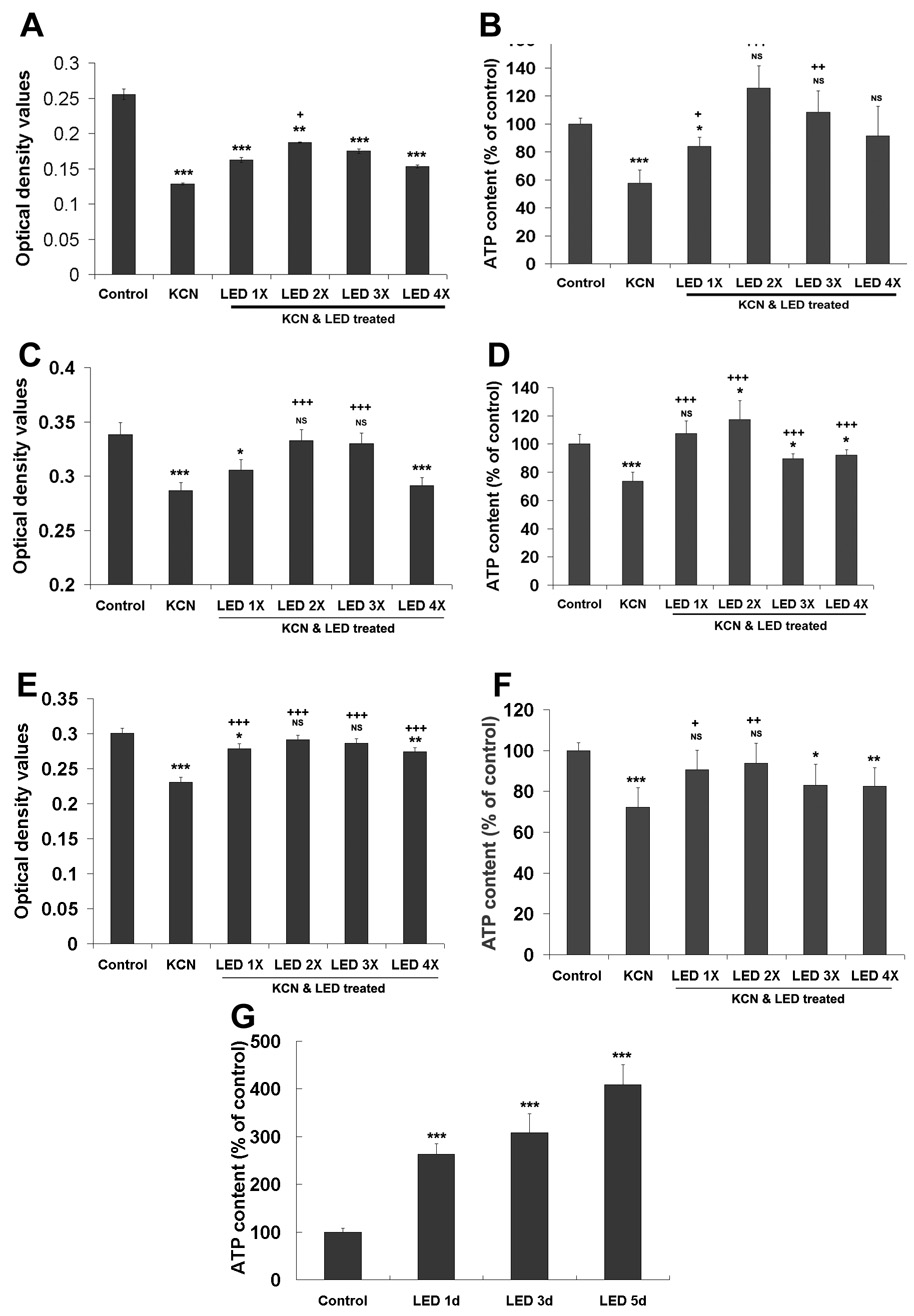
Effect of LED treatment on cytochrome oxidase activity and cellular ATP content in cortical neurons exposed to KCN and 1–4 times of LED treatment. A, C, E: Quantification of cytochrome oxidase activity in cultured primary neurons after 1–4 times of LED treatment and KCN exposure for 24 h, 3 days, and 5 days, respectively. Two times of LED treatment resulted in the highest cytochrome oxidase activity as compared to other LED regimens. B, D, F: levels of cellular ATP content in neurons after 24 h, 3 days, and 5 days of KCN exposure, respectively, and 1–4 times of LED treatment. LED treatment twice a day was most effective in restoring ATP contents close to, though not reaching control levels. G: Cellular ATP content in cortical neurons after twice a day LED treatment for 1, 3 and 5 days. LED treatment significantly increased cellular ATP content compared to controls. All *P values were compared to controls: *, P < 0.05, **, P < 0.01, ***, P < 0.001. All +P values were compared to KCN alone: +, P < 0.05, ++, P < 0.01, +++, P < 0.001.
Cytochrome oxidase activity after three days of KCN exposure was significantly increased by 1, 2 or 3 times of LED treatment per day for 3 days (P < 0.05 – 0.001), and both two and three times a day rescued cytochrome oxidase activity to control levels (Fig. 5C). On the other hand, four times a day of LED treatment did not yield any benefit (Fig. 5C). When LED treatments were extended to five days, cytochrome oxidase activity was significantly increased by the 1, 2, 3, or 4 times per day regimens (P <0.001). However, only two or three times per day of treatment returned cytochrome oxidase activity to control levels, with twice a day yielding the highest value (Fig 5E).
Effect of LED treatment on cellular ATP content in neurons
Cellular ATP content was significantly decreased by 300 µM KCN exposure for 24 h (P < 0.001; Fig. 5B). LED treatments for 1–4 times all increased cellular ATP content, with values reaching control levels when given 2–4 times. In comparison to KCN-exposed samples, all but the 4-times-a-day samples showed significant increases (P < 0.05-0.001) (Fig. 5B). The latter failed to show significance due to its high standard deviations. After three days of LED treatment, cellular ATP content reached control levels with the once-a-day paradigm and above control levels with the twice-a-day regimen (Fig. 5D). With five days of KCN exposure, ATP content reached control levels when LED treatment was given once or twice a day. There was no significant difference between three or four times a day of treatment. Twice a day LED treatment also yielded the highest level of ATP content (Fig. 5F).
We also measured the cellular ATP levels after 1, 3, and 5 days of LED treatment, using the twice-a-day paradigm, in normal cortical neurons to determine the effect of LED treatment alone on cellular ATP content. LED treatment significantly increased cellular ATP content up to 2.63, 3.08 and 4.08 folds after 1, 3 and 5 days of LED treatment, respectively (P < 0.001 for all) (Fig. 5G).
The above findings pointed to an optimal LED regimen of two times a day. Thus, all subsequent LED treatments for MPP+- and rotenone-exposed neurons were twice a day.
LED treatment prevented neurons from MPP+-induced apoptotic cell death
To test if LED treatment rescued neurons from MPP+-induced apoptosis, rat primary neuronal cultures were exposed to 250 µM or 500 µM of MPP+ for 48 h, and LED treatment was given twice a day. LED treatment significantly reduced the number of neurons that underwent apoptosis as compared to MPP+ alone (36 % and 33.3 % reduction in striatal neurons, and 36.4 % and 42 % reduction in cortical neurons, respectively) (P < 0.001 for all). There was no statistically significant difference between the effects on striatal and cortical neurons (Figs. 6A and C).
Fig. 6.
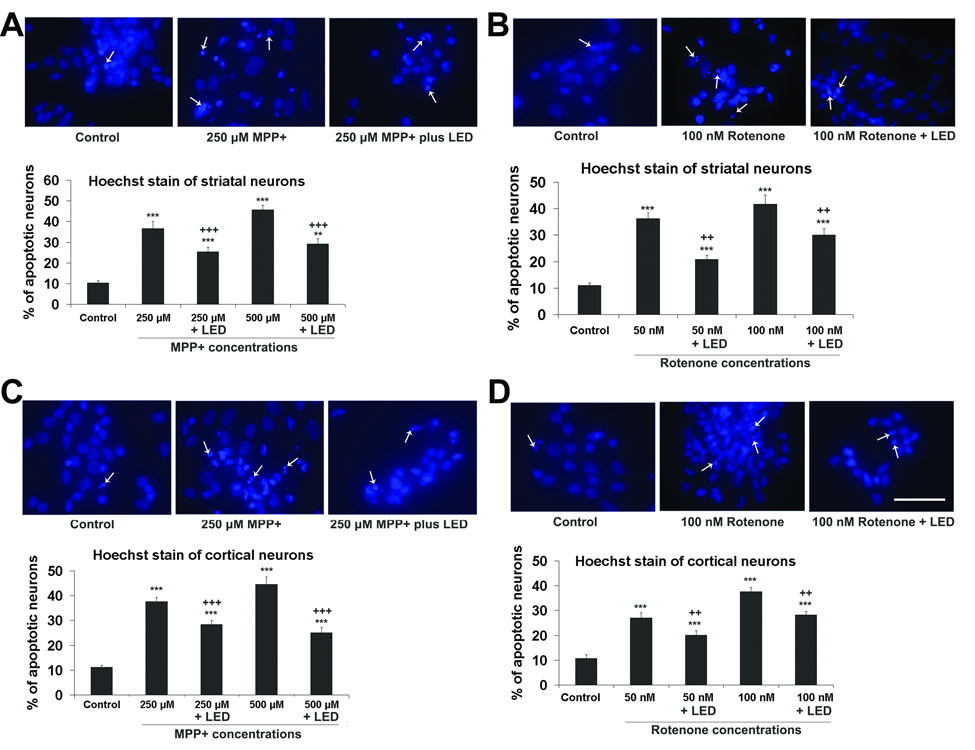
Hoechst staining of cultured neurons exposed to MPP+ or rotenone and twice-a-day LED treatment. A and C: Striatal and cortical neurons, respectively, exposed to MPP+; B and D: Striatal and cortical neurons, respectively, exposed to rotenone. The arrows showed apoptotic neurons with nuclear condensation or decreased nuclear size, with or without nuclear fragmentation. Quantitative assays of percent apoptotic neurons in control, MPP+ or rotenone exposed, with or without LED treatment are shown for each group. LED treatment significantly reduced the percentage of apoptotic neurons as compared to MPP+ or rotenone alone. All *P values were compared to controls: **, P < 0.01, ***, P < 0.001. All +P values were compared to MPP+ or rotenone only: ++, P < 0.01, +++, P < 0.001. Scale bar = 20 µm for all.
LED treatment rescued neurons from rotenone-induced apoptotic cell death
In the normal rat primary neuronal cultures, very few cortical neurons or striatal neurons underwent cell death. However, exposure to 50 nM or 100 nM of rotenone for 48 h induced a 36.2 % and 41.5 % of striatal neurons, respectively, to undergo apoptosis (Fig. 6B). Similar exposure to rotenone rendered slightly lower numbers of cortical neurons to undergo cell death (28% and 38.4%, respectively) (Fig. 6D). LED treatments twice a day effectively decreased the number of apoptotic neurons induced by 50 nM and 100 nM of rotenone by 20.4 % and 28.3 %, respectively, in striatal neurons, and by 20.1 % and 29.2 %, respectively, in cortical neurons (P < 0.01 for all) (Fig. 6B and D).
We also tested the effect of LED treatment on neurons after three and five days of MPP+ and rotenone exposure. LED treatment significantly reduced the number of apoptotic neurons (P < 0.001). However, the total number of surviving neurons was much lower than those of the two-day MPP+ or rotenone exposed and LED treated ones (data not shown).
LED treatment increased cellular ATP content in neurons after MPP+ exposure
Cellular ATP content was measured in neurons exposed to 100 µM, 250 µM, or 500 µM of MPP+ for 48 h with or without LED treatment. Results indicated that 100–500 µM MPP+ significantly reduced the cellular ATP levels in both cortical and striatal neurons (P < 0.001). LED treatments twice a day in 48 h significantly increased the cellular ATP content at all concentrations of MPP+ tested in both cortical and striatal neurons (P < 0.05-0.01) (Fig. 7A,C).
Fig. 7.
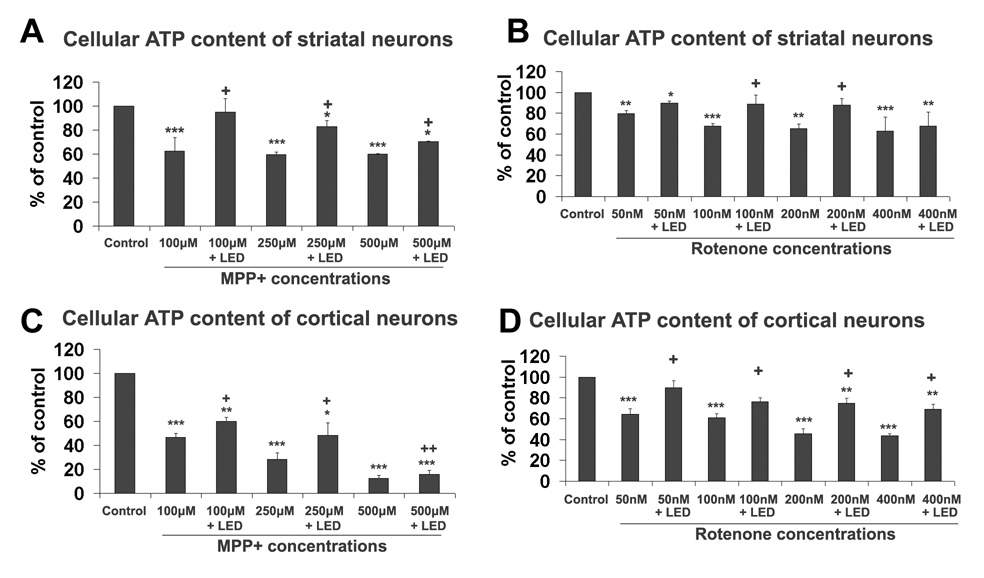
Effect of LED treatment on cellular ATP content in neurons exposed to different doses of MPP+ or rotenone. A and C: Striatal and cortical neurons, respectively, exposed to MPP+; B and D: Striatal and cortical neurons, respectively, exposed to rotenone. LED treatment was effective in increasing ATP content for most conditions. All *P values were compared to control: *, P < 0.05, **, P < 0.01, ***, P < 0.001. All +P values were compared to MPP+ or rotenone only: +, P < 0.05, ++, P < 0.01.
LED treatment increased cellular ATP content in neurons after rotenone exposure
Cellular ATP content was significantly decreased by exposure to 50, 100, 200, or 400 nM of rotenone for 48 h in both striatal and cortical neurons (P < 0.01-0.001) (Fig. 7B, D). LED treatments twice a day significantly increased the cellular ATP content in cortical neurons exposed to all rotenone concentrations tested as compared to rotenone alone (P < 0.05 for all) (Fig. 7D). LED treatment also significantly increased cellular ATP content in striatal neurons exposed to all rotenone doses used. However, values reached significance only in those exposed to 100 nM and 200 nM of rotenone (P < 0.05) (Fig. 7B), and none reached control levels for both striatal and cortical neurons (Fig. 7B, D).
Effect of LED treatment on DCFDA intensity in neurons exposed to rotenone or MPP+
The intensity of DCFDA was measured in neurons after exposure to 250 µM MPP+ or 100 nM rotenone for 48 h, with or without LED treatment twice a day in both striatal and cortical neurons. LED treatment significantly reduced the DCFDA intensity induced by MPP+ from 58.9 to 46.5 in striatal neurons, and from 60.3 to 42.0 in cortical neurons, as compared to MPP+ alone (P < 0.05) (Fig. 8A,C). LED treatment also decreased the DCFDA intensity induced by rotenone from 71.2 to 31.4 in striatal neurons, and from 47.5 to 29.8 in cortical neurons (P < 0.001) (Fig. 8B, D). However, LED treatment did not return DCFDA intensities to control levels (P < 0.001 for all) (Fig. 8A–D).
Fig. 8.
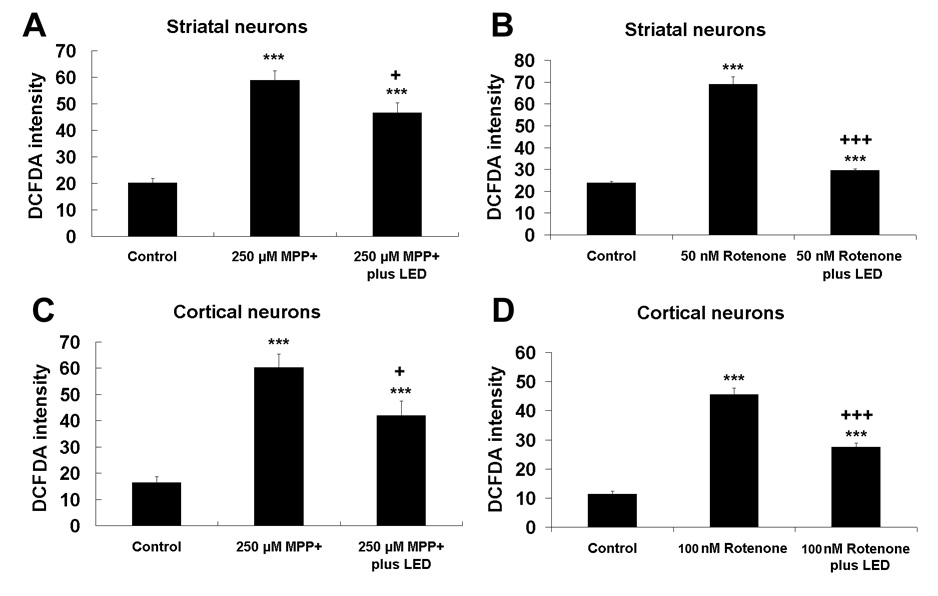
Quantitative analyses of ROS expression measured by CM-H2DCFDA fluorescence in neurons exposed to MPP+ or rotenone and twice-a-day LED treatment. A and C: Striatal and cortical neurons, respectively, exposed to MPP+; B and D: Striatal and cortical neurons, respectively, exposed to rotenone. CM-H2DCFDA expression was increased by MPP+ and rotenone exposure, but was lowered by LED treatment. ***, P < 0.001 compared to controls. All +P values were compared to MPP+ or rotenone only: +, P < 0.05, +++, P < 0.001.
LED treatment reduced the NO production in neurons exposed to rotenone or MPP+
The intensity of DAF-2 DA (marker of NO) was measured in cultures exposed to 100 nM rotenone or 250 µM MPP+ with or without LED treatment. LED treatment significantly decreased the DAF-2 DA intensity in both striatal and cortical neurons as compared to 100 nM rotenone or 250 µM MPP+ alone (P < 0.01–0.001). However, these levels remained higher than those of normal controls (P < 0.001 for all) (Fig. 9A–D).
Fig. 9.
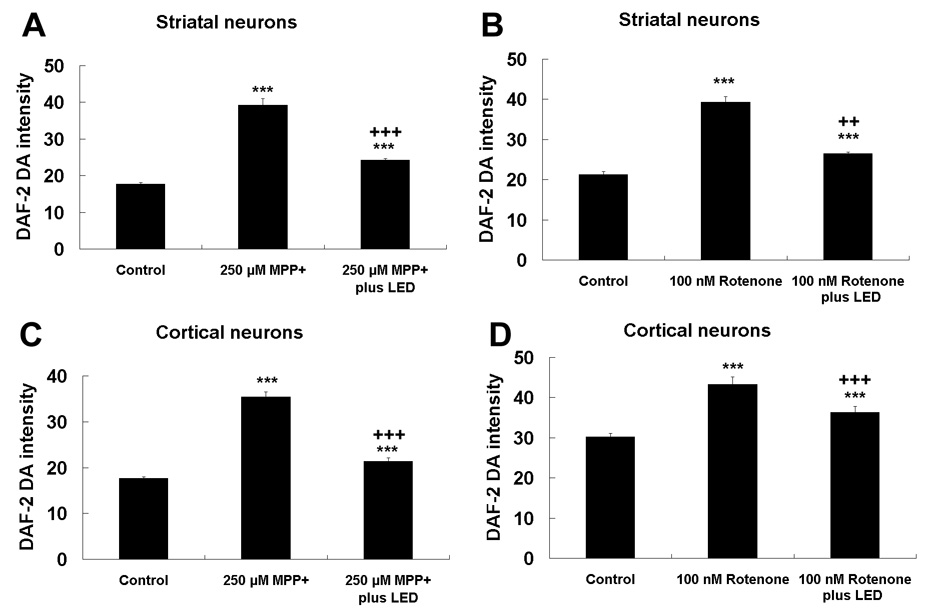
NO production measured by DAF-2 DA fluorescence in neurons exposed to MPP+ or rotenone, with or without twice-a-day LED treatment. A and C: Striatal and cortical neurons, respectively, exposed to MPP+; B and D: Striatal and cortical neurons, respectively, exposed to rotenone. DAF-2DA expression was increased by MPP+ or rotenone exposure but decreased by LED treatment. However, the fluorescent signal was still higher than control levels. ***, P < 0.001 compared to controls. All +P values were compared to MPP+ or rotenone only: ++, P < 0.01, +++, P < 0.001.
DISCUSSION
The present study documents that twice a day of LED treatment is most effective in rescuing neurons from the toxic effects of potassium cyanide, MPP+, and rotenone. The first toxin inhibits complex IV (cytochrome oxidase), while the other two are known to inhibit complex I of the mitochondrial electron transport chain. LED treatment increased cytochrome oxidase activity and ATP production and reduced the generation of apoptosis, reactive oxygen species, and reactive nitrogen species in poisoned neurons. These findings pave the way for future testing of LED treatment for Parkinson’s diseased animal models or patients.
Low-energy light irradiation in the far red to near-infrared (NIR) range modulates various biological processes (Karu 1999), such as acceleration of electron transfer in the respiratory chain and activation of photoacceptors, especially cytochrome oxidase, thereby increasing cellular ATP production (Karu, 1999; Wong-Riley et al., 2005; current study). NIR-LED light treatment also protects the retina from methanol-induced toxicity in vivo, a mechanism that is reliant on increasing mitochondrial oxidative metabolism (Eells et al., 2003, 2004). Previous studies have demonstrated the optimal wavelength of NIR treatment in reversing the down-regulation of cytochrome oxidase activity and cellular ATP content induced by toxins (Wong-Riley et al., 2005). The current study (using 670 nm wavelength of NIR) documents that twice a day of LED treatment yields the best protection for injured neurons. Possible mechanisms may involve multiple regulatory intra-, inter- or extra-cellular biologic events. Previously, the percentage of HeLa cells attached to the glass surface was found to increase upon irradiating the cell suspension samples with certain wavelengths (Karu et al., 2005). However, the optimal frequency of light treatment was not tested in that study. When the energy dose of light irradiation was increased, the proliferative action of human fibroblasts was not found to be enhanced (Zhang et al., 2003). By the same token, increasing LED treatment to 3 or 4 times a day under the current experimental paradigm not only did not bring further benefits, but rather yielded less optimal results. The exact mechanism is not fully understood, but one possibility is that neurons may have a set point for optimal energy metabolism, beyond which they may promote reactive oxygen and reactive nitrogen species production, thereby leading to greater cell death in the presence of toxins (current study). Preliminary in vivo experiments also indicate that twice a day of LED treatment is most beneficial to injured neurons (our unpublished observations). Thus, it is important to determine the optimal frequency and dosage of LED treatment for future experimental studies or for clinical therapeutic applications.
Cells undergoing apoptosis suffer from reduced ATP content (Hiura et al., 2000; Comelli et al., 2003; Atlante et al., 2005). Likewise, KCN, rotenone, and MPP+ also induce a significant reduction in cellular ATP content (Kutty et al., 1991; Cosi and Marien, 1998; Storch et al., 2000; Wong-Riley et al., 2005; the present study). Previously, we found that LED treatment rescued primary neurons from undergoing KCN-induced apoptosis (Wong-Riley et al., 2005; Liang et al., 2006). The present study extends these findings to an optimal LED treatment of twice a day, a regimen found to be therapeutic for neurons poisoned not only by KCN, but also by MPP+ or rotenone, both of which are linked to mitochondrial dysfunction and Parkinsonian-like symptoms (Langston et al., 1983; Kutty et al., 1991). Twice-a-day LED treatment induces the highest cytochrome oxidase activity and cellular ATP content among the regimens tested, and is, therefore, the most beneficial in promoting cell survival and protecting neurons against apoptosis, regardless of the mode of neuronal poisoning.
Nitric oxide (NO) reversibly inhibits cytochrome oxidase in competition with oxygen, inhibits mitochondrial respiratory chain, and decreases ATP synthesis (reviewed in Brown, 2001). High levels of NO can directly damage DNA (Nguyen et al., 1992) and induce neuronal apoptosis (Brune et al., 1998; Constantin et al., 2002; Gahm et al., 2006). The reduction of NO and ROS production in rotenone- or MPP+-exposed neurons by LED further attests to the neuroprotective effect of near-infrared light treatment.
Near-infrared light irradiation can activate a number of genes related to anti-oxidation, anti-apoptosis, and mitochondrial energy metabolism (Zhang et al., 2003). Indeed, our previous studies on neurons as well as our published report on wound healing in diabetic mice also indicate specific up- and down-regulation of different genes by LED treatment (Wong-Riley et al., 2002; Whelan et al., 2003; Liang et al., 2006; Desmet et al., 2006). The fact that twice a day of LED treatment results in a significant increase in energy metabolism and in rescuing neurons from KCN-induced apoptosis strongly suggests that a cascade of events has been triggered to activate or repress a variety of genes.
Parkinson’s disease is characterized by a selective degeneration of dopaminergic neurons in the substantia nigra pars compacta and consequently a reduction in striatal dopamine levels (Oertel and Ellgring, 1995). Both rotenone and MPTP metabolite MPP+ are neurotoxins commonly used in cellular models of Parkinson’s disease (Denton and Howard, 1987; Storch et al., 2000; Imamura et al., 2006). MPP+-induced neurotoxicity is not well understood. However, there is increasing evidence supporting the involvement of reactive oxygen species (ROS) and reactive nitrogen species (RNS) (Metodiewa and Koska, 2000; Dawson and Dawson, 2003). Excessive ROS contributes to mitochondrial dysfunction and signals the initiation of cell death (Carmody and Cotter, 2001; Kitazawa et al., 2002). LED treatment significantly reduces ROS and NO generation in KCN, rotenone- or MPP+-poisoned neurons but did not increase normal neuronal ROS or NO levels (Liang et al., 2006; present study). LED treatment efficiently rescues neurons from both MPP+- or rotenone-induced neurotoxicity and increases energy metabolism, thereby providing further support for treating PD neurons, perhaps as an adjunct therapy, in vivo. The potential therapeutic effect of light on other degenerative diseases also deserves serious consideration (Lane, 2006).
In summary, our results demonstrate that LED treatment twice a day was more effective in increasing the cellular ATP content and cytochrome oxidase activity and rescuing neurons from toxin-induced cell death. Twice a day LED treatment significantly counteracted both rotenone-and MPP+-induced neurotoxicity. Optimizing endogenous energy production and protecting neurons from neurotoxin-induced cell death are worthy measures to be considered in PD treatment and clinical therapy.
ACKNOWLEDGMENTS
We thank Dr. J. Besharse for the use of their inverted fluorescent microscope and Dr. R. Kalyanaraman for their DAF-2DA reagents. This study was supported by NIH/NICAM grant R21-AT003002 and by the Department of Cell Biology, Neurobiology and Anatomy as well as the Department of Neurology at the Medical College of Wisconsin.
Abbreviations
- BSS
balanced salt solution
- CM-H2DCFDA
5-(and -6) chloromethy-2’, 7-dichlorodihydrofluorescein diacetate acetyl ester
- DAF-2 DA
4,5-diaminofluorescein diacetate
- KCN
potassium cyanide
- LED
light-emitting diode
- MPP+
1-methyl-4-phenylpyridinium ion
- MPTP
1-methyl-4-phenyl-1,2,3,6-tetrahydropyridine
- NIR
near-infrared
- NO
nitric oxide
- PD
Parkinson’s Disease
- RNS
reactive nitrogen species
- ROS
reactive oxygen species
Footnotes
Publisher's Disclaimer: This is a PDF file of an unedited manuscript that has been accepted for publication. As a service to our customers we are providing this early version of the manuscript. The manuscript will undergo copyediting, typesetting, and review of the resulting proof before it is published in its final citable form. Please note that during the production process errors may be discovered which could affect the content, and all legal disclaimers that apply to the journal pertain.
REFERENCES
- Atlante A, Giannattasio S, Bobba A, Gagliardi S, Petragallo V, Calissano P, Marra E, Passarella S. An increase in the ATP levels occurs in cerebellar granule cells en route to apoptosis in which ATP derives from both oxidative phosphorylation and anaerobic glycolysis. Biochim Biophys Acta. 2005;1708:50–62. doi: 10.1016/j.bbabio.2005.01.009. [DOI] [PubMed] [Google Scholar]
- Brown GC. Regulation of mitochondrial respiration by nitric oxide inhibition of cytochrome c oxidase. Biochim Biophys Acta. 2001;1504:46–57. doi: 10.1016/s0005-2728(00)00238-3. [DOI] [PubMed] [Google Scholar]
- Brune B, von Knethen A, Sandau KB. Nitric oxide and its role in apoptosis. Eur J Pharmacol. 1998;351:261–272. doi: 10.1016/s0014-2999(98)00274-x. [DOI] [PubMed] [Google Scholar]
- Buttke TM, Sandstrom PA. Oxidative stress as a mediator of apoptosis. Immunol Today. 1994;15:7–10. doi: 10.1016/0167-5699(94)90018-3. [DOI] [PubMed] [Google Scholar]
- Carmody RJ, Cotter TG. Signalling apoptosis: a radical approach. Redox Rep. 2001;6:77–90. doi: 10.1179/135100001101536085. [DOI] [PubMed] [Google Scholar]
- Cassarino DS, Parks JK, Parker WD, Jr, Bennett JP., Jr The Parkinsonian neurotoxin MPP+ opens the mitochondrial permeability transition pore and releases cytochrome c in isolated mitochondria via an oxidative mechanism. Biochim Biophys Acta. 1999;1453:49–62. doi: 10.1016/s0925-4439(98)00083-0. [DOI] [PubMed] [Google Scholar]
- Comelli M, Di Pancrazio F, Mavelli I. Apoptosis is induced by decline of mitochondrial ATP synthesis in erythroleukemia cells. Free Radic Biol Med. 2003;34:1190–1199. doi: 10.1016/s0891-5849(03)00107-2. [DOI] [PubMed] [Google Scholar]
- Constantin D, Ala’Aldeent D, Murphy S. Transcriptional activation of nitric oxide synthase-2, and NO-induced cell death, in mouse cerebrovascular endothelium exposed to Neisseria meningitides. J Neurochem. 2002;81:270–276. doi: 10.1046/j.1471-4159.2002.00816.x. [DOI] [PubMed] [Google Scholar]
- Cosi C, Marien M. Decreases in mouse brain NAD+ and ATP induced by 1-methyl-4-phenyl-1, 2, 3, 6-tetrahydropyridine (MPTP): prevention by the poly(ADP-ribose) polymerase inhibitor, benzamide. Brain Res. 1998;809:58–67. doi: 10.1016/s0006-8993(98)00829-4. [DOI] [PubMed] [Google Scholar]
- Dawson TM, Dawson VL. Molecular pathways of neurodegeneration in Parkinson's disease. Science. 2003;302:819–822. doi: 10.1126/science.1087753. [DOI] [PubMed] [Google Scholar]
- Denton T, Howard BD. A dopaminergic cell line variant resistant to the neurotoxin 1-methyl-4-phenyl-1, 2, 3, 6-tetrahydropyridine. J Neurochem. 1987;49:622–630. doi: 10.1111/j.1471-4159.1987.tb02909.x. [DOI] [PubMed] [Google Scholar]
- Desmet KD, Paz DA, Corry JJ, Eells JT, Wong-Riley MT, Henry MM, Buchmann EV, Connelly MP, Dovi JV, Liang HL, Henshel DS, Yeager RL, Millsap DS, Lim J, Gould LJ, Das R, Jett M, Hodgson BD, Margolis D, Whelan HT. Clinical and experimental applications of NIR-LED photobiomodulation. Photomed Laser Surg. 2006;24:121–128. doi: 10.1089/pho.2006.24.121. [DOI] [PubMed] [Google Scholar]
- Eells JT, Henry MM, Summerfelt P, Wong-Riley MTT, Buchmann EV, Kane M, Whelan NT, Whelan HT. Therapeutic photobiomodulation for methanol-induced retinal toxicity. Proc Natl Acad Sci U S A. 2003;100:3439–3444. doi: 10.1073/pnas.0534746100. [DOI] [PMC free article] [PubMed] [Google Scholar]
- Eells JT, Wong-Riley MT, VerHoeve J, Henry M, Buchman EV, Kane MP, Gould LJ, Das R, Jett M, Hodgson BD, Margolis D, Whelan HT. Mitochondrial Signal Transduction in Accelerated Wound and Retinal Healing by Near-Infrared Light Therapy. In: Mitochondrion, Special issue on Mitochondrial Medicine – Developing the Scientific Basis to Medical Management of Mitochondrial Disease. Vol. 4. 2004. pp. 559–568. [DOI] [PubMed] [Google Scholar]
- Gahm C, Holmin S, Wiklund PN, Brundin L, Mathiesen T. Neuroprotection by selective inhibition of inducible nitric oxide synthase after experimental brain contusion. J Neurotrauma. 2006;23:1343–1354. doi: 10.1089/neu.2006.23.1343. [DOI] [PubMed] [Google Scholar]
- Hirata Y, Nagatsu T. Rotenone and CCCP inhibit tyrosine hydroxylation in rat striatal tissue slices. Toxicology. 2005;216:9–14. doi: 10.1016/j.tox.2005.07.010. [DOI] [PubMed] [Google Scholar]
- Hirsch EC, Faucheux B, Damier P, Mouatt-Prigent A, Agid Y. Neuronal vulnerability in Parkinson's disease. J Neural Transm Suppl. 1997;50:79–88. doi: 10.1007/978-3-7091-6842-4_9. [DOI] [PubMed] [Google Scholar]
- Hiura TS, Li N, Kaplan R, Horwitz M, Seagrave JC, Nel AE. The role of a mitochondrial pathway in the induction of apoptosis by chemicals extracted from diesel exhaust particles. J Immunol. 2000;165:2703–2711. doi: 10.4049/jimmunol.165.5.2703. [DOI] [PubMed] [Google Scholar]
- Imamura K, Takeshima T, Kashiwaya Y, Nakaso K, Nakashima K. D-beta-hydroxybutyrate protects dopaminergic SH-SY5Y cells in a rotenone model of Parkinson's disease. J Neurosci Res. 2006;84:1376–1384. doi: 10.1002/jnr.21021. [DOI] [PubMed] [Google Scholar]
- Javitch JA, D'Amato RJ, Strittmatter SM, Snyder SH. Parkinsonism-inducing neurotoxin, N-methyl-4-phenyl-1,2,3,6 -tetrahydropyridine: uptake of the metabolite N-methyl-4-phenylpyridine by dopamine neurons explains selective toxicity. Proc Natl Acad Sci U S A. 1985;82:2173–2177. doi: 10.1073/pnas.82.7.2173. [DOI] [PMC free article] [PubMed] [Google Scholar]
- Karu T. Primary and secondary mechanisms of action of visible to near-IR radiation on cells. J Photochem Photobiol B. 1999;49:1–17. doi: 10.1016/S1011-1344(98)00219-X. [DOI] [PubMed] [Google Scholar]
- Karu T, Pyatibrat LV, Afanasyeva NI. Cellular effects of low power laser therapy can be mediated by nitric oxide. Lasers in surgery and medicine. 2005;36:307–314. doi: 10.1002/lsm.20148. [DOI] [PubMed] [Google Scholar]
- Kaur D, Andersen JK. Ironing out Parkinson's disease: is therapeutic treatment with iron chelators a real possibility? Aging Cell. 2002;1:17–21. doi: 10.1046/j.1474-9728.2002.00001.x. [DOI] [PubMed] [Google Scholar]
- Kitazawa M, Wagner JR, Kirby ML, Anantharam V, Kanthasamy AG. Oxidative stress and mitochondrial-mediated apoptosis in dopaminergic cells exposed to methylcyclopentadienyl manganese tricarbonyl. J Pharmacol Exp Ther. 2002;302:26–35. doi: 10.1124/jpet.302.1.26. [DOI] [PubMed] [Google Scholar]
- Kutty RK, Santostasi G, Horng J, Krishna G. MPTP-induced ATP depletion and cell death in neuroblastoma X glioma hybrid NG 108-15 cells: protection by glucose and sensitization by tetraphenylborate. Toxicol Appl Pharmacol. 1991;107:377–388. doi: 10.1016/0041-008x(91)90217-3. [DOI] [PubMed] [Google Scholar]
- Lane N. Cell biology: power games. Nature. 2006;443:901–903. doi: 10.1038/443901a. [DOI] [PubMed] [Google Scholar]
- Langston JW, Ballard P, Tetrud JW, Irwin I. Chronic Parkinsonism in humans due to a product of meperidine-analog synthesis. Science. 1983;219:979–980. doi: 10.1126/science.6823561. [DOI] [PubMed] [Google Scholar]
- Liang HL, Whelan HT, Eells JT, Meng H, Buchmann E, Lerch-Gaggl A, Wong-Riley MTT. Photobiomodulation partially rescues visual cortical neurons from cyanide-induced apoptosis. Neuroscience. 2006;139:639–649. doi: 10.1016/j.neuroscience.2005.12.047. [DOI] [PubMed] [Google Scholar]
- Metodiewa D, Koska C. Reactive oxygen species and reactive nitrogen species: relevance to cyto(neuro)toxic events and neurologic disorders. An overview. Neurotox Res. 2000;1:197–233. doi: 10.1007/BF03033290. [DOI] [PubMed] [Google Scholar]
- Nguyen T, Brunson D, Crespi CL, Penman BW, Wishnok JS, Tannenbaum SR. DNA damage and mutation in human cells exposed to nitric oxide in vitro. Proc Natl Acad Sci U S A. 1992;89:3030–3034. doi: 10.1073/pnas.89.7.3030. [DOI] [PMC free article] [PubMed] [Google Scholar]
- Oertel WH, Ellgring H. Parkinson's disease--medical education and psychosocial aspects. Patient Educ Couns. 1995;26:71–79. doi: 10.1016/0738-3991(95)00757-q. [DOI] [PubMed] [Google Scholar]
- Parker WD, Jr, Boyson SJ, Parks JK. Abnormalities of the electron transport chain in idiopathic Parkinson's disease. Ann Neurol. 1989;26:719–723. doi: 10.1002/ana.410260606. [DOI] [PubMed] [Google Scholar]
- Schmidt N, Ferger B. Neuroprotective effects of (+/−)-kavain in the MPTP mouse model of Parkinson's disease. Synapse. 2001;40:47–54. doi: 10.1002/1098-2396(200104)40:1<47::AID-SYN1025>3.0.CO;2-S. [DOI] [PubMed] [Google Scholar]
- Sherer TB, Betarbet R, Stout AK, Lund V, Baptista M, Panov AV, Cookson MR, Greenamyre JT. An in vitro model of Parkinson's disease: linking mitochondrial impairment to altered alpha-synuclein metabolism and oxidative damage. J Neurosci. 2002;22:7006–7015. doi: 10.1523/JNEUROSCI.22-16-07006.2002. [DOI] [PMC free article] [PubMed] [Google Scholar]
- Sherer TB, Betarbet R, Testa CM, Seo BB, Richardson JR, Kim JH, Miller GW, Yagi T, Matsuno-Yagi A, Greenamyre JT. Mechanism of toxicity in rotenone models of Parkinson's disease. J Neurosci. 2003;23:10756–10764. doi: 10.1523/JNEUROSCI.23-34-10756.2003. [DOI] [PMC free article] [PubMed] [Google Scholar]
- Storch A, Burkhardt K, Ludolph AC, Schwarz J. Protective effects of riluzole on dopamine neurons: involvement of oxidative stress and cellular energy metabolism. J Neurochem. 2000;75:2259–2269. doi: 10.1046/j.1471-4159.2000.0752259.x. [DOI] [PubMed] [Google Scholar]
- Thomas S, Kotamraju S, Zielonka J, Harder DR, Kalyanaraman B. Hydrogen peroxide induces nitric oxide and proteosome activity in endothelial cells: a bell-shaped signaling response. Free Radic Biol Med. 2007;42:1049–1061. doi: 10.1016/j.freeradbiomed.2007.01.005. [DOI] [PMC free article] [PubMed] [Google Scholar]
- Wang G, Qi C, Fan GH, Zhou HY, Chen SD. PACAP protects neuronal differentiated PC12 cells against the neurotoxicity induced by a mitochondrial complex I inhibitor, rotenone. FEBS Lett. 2005;579:4005–4011. doi: 10.1016/j.febslet.2005.06.013. [DOI] [PubMed] [Google Scholar]
- Watabe M, Nakaki T. Rotenone induces apoptosis via activation of bad in human dopaminergic SH-SY5Y cells. J Pharmacol Exp Ther. 2004;311:948–953. doi: 10.1124/jpet.104.071381. [DOI] [PubMed] [Google Scholar]
- Whelan HT, Smits RL, Jr, Buchman EV, Whelan NT, Turner SG, Margolis DA, Cevenini V, Stinson H, Ignatius R, Martin T, Cwiklinski J, Philippi AF, Graf WR, Hodgson B, Gould L, Kane M, Chen G, Caviness J. Effect of NASA light-emitting diode irradiation on wound healing. J Clin Laser Med Surg. 2001;19:305–314. doi: 10.1089/104454701753342758. [DOI] [PubMed] [Google Scholar]
- Whelan HT, Buchmann EV, Dhokalia A, Kane MP, Whelan NT, Wong-Riley MT, Eells JT, Gould LJ, Hammamieh R, Das R, Jett M. Effect of NASA light-emitting diode irradiation on molecular changes for wound healing in diabetic mice. J Clin Laser Med Surg. 2003;21:67–74. doi: 10.1089/104454703765035484. [DOI] [PubMed] [Google Scholar]
- Wong-Riley MTT, Bai XT, Buchmann E, Whelan HT. Light-emitting diode treatment reverses the effect of TTX on cytochrome oxidase in neurons. NeuroReport. 2001;12:3033–3037. doi: 10.1097/00001756-200110080-00011. [DOI] [PubMed] [Google Scholar]
- Wong-Riley MTT, Whelan H, Dhokalia A, Das R, Hammamieh R, Liang HL, Eells J, Jett M. cDNA microarray analysis of the visual cortex exposed to light-emitting diode treatment in monocularly enucleated rats. Soc Neurosci Abst. 2002:131.20. [Google Scholar]
- Wong-Riley MTT, Liang HL, Eells JT, Chance B, Henry MM, Buchmann E, Kane M, Whelan HT. Photobiomodulation directly benefits primary neurons functionally inactivated by toxins: Role of cytochrome c oxidase. J Biol Chem. 2005;280:4761–4771. doi: 10.1074/jbc.M409650200. [DOI] [PubMed] [Google Scholar]
- Zhang C, Wong-Riley M. Expression and regulation of NMDA receptor subunit R1 and neuronal nitric oxide synthase in cortical neuronal cultures: Correlation with cytochrome oxidase. J Neurocytol. 1999;28:525–539. doi: 10.1023/a:1007053204929. [DOI] [PubMed] [Google Scholar]
- Zhang Y, Song S, Fong CC, Tsang CH, Yang Z, Yang M. cDNA microarray analysis of gene expression profiles in human fibroblast cells irradiated with red light. J Invest Dermatol. 2003;120:849–857. doi: 10.1046/j.1523-1747.2003.12133.x. [DOI] [PubMed] [Google Scholar]


