Abstract
Cationic Mn porphyrins are among the most potent SOD mimics and peroxynitrite scavengers. They have been widely and successfully used in different models of oxidative stress and are either progressing towards or are in phase I of clinical trials. The most frequently used compounds are Mn(III) meso-tetrakis(N-ethylpyridinium-2-yl)porphyrin (MnTE-2-PyP5+ or AEOL10113), its methyl analogue (MnTM-2-PyP5+ or AEOL10112), and Mn(III) meso-tetrakis(4-bezonic acid)porphyrin (MnTBAP). A great discrepancy between the in vivo data obtained with Calbiochem preparations and those of authentic MnTE-2-PyP5+ and MnTM-2-PyP5+ samples were recently observed. Surprisingly, the commercial samples were invariably of poor identity and consisted of mixtures of nearly equal contributions of non-alkylated, mono-, di-, tri- and tetraalkylated porphyrins, lacking thus the major structural entity that determines their antioxidant potency; i.e. the four positively charged ortho N-alkylpyridyl groups that afford thermodynamic tuning of the active site and electrostatic guidance of anionic superoxide and peroxynitrite species toward the metal center. The MnTE-2-PyP5+ and MnTM-2-PyP5+ compounds were not even the major species in the commercial samples sold as “MnTE-2-PyP” and “MnTM-2-PyP”, respectively. While we have already reported the insufficient impurity of the MnTBAP samples from Alexis and other suppliers, in one more recent lot the situation is dramatic, as 25% of the sample was not MnTBAP, but metal-free ligand, H2TBAP. The (unintentional) use of the Mn porphyrins of low quality compromises therapeutic and/or mechanistic conclusions. Simple techniques, which include thin-layer chromatography, electrospray-mass spectrometry, UV-vis spectroscopy, and electrochemistry described here could be used routinely to check the overall quality of Mn porphyrins in order to avoid misleading conclusions and waste of valuable resources (animals, compounds, time, manpower).
Keywords: MnTE-2-PyP, MnTM-2-PyP, MnTBAP, SOD mimics, peroxynitrite scavengers, antioxidants, Mn porphyrins
Introduction
The cationic MnTE-2-PyP5+, MnTM-2-PyP5+, and their congeners are potent SOD mimics and peroxynitrite scavengers and have been particularly valuable as mechanistic probes or therapeutic agents in a variety of oxidative stress-related disorders [1–3, and refs therein].
We have recently showed that the apparent SOD activity of the anionic Mn porphyrin, MnTBAP, arises not from the Mn porphyrin itself, but from trace, redox-active Mn oxo/hydroxo/acetate impurities [4]. All commercial preparations of MnTBAP that we analyzed thus far contained different degrees of Mn clusters that varied dramatically from batch-to-batch, even within the same supplier, precluding reproducibility [4].
Our collaboration with Dr. David S. Warner’s group (Duke University) and Drs. Joan S. Valentine and Richard Gatti’s groups (University of California at Los Angeles) suggested the possibility of serious problem of drug purity involving the commercial samples of MnTE-2-PyP5+ and MnTM-2-PyP5+ (personal communications; 2007, 2008). We investigated this in detail and show here that some commercial samples sold as single compounds “MnTE-2-PyP” and “MnTM-2-PyP”, are in fact mixtures of 5 different MnPs, where the actual MnTE-2-PyP5+ or MnTM-2-PyP5+ compounds are not even the major components.
Due to the remarkable efficacy of MnTE-2-PyP5+, MnTM-2-PyP5+ and their congeners, in nearly any model of oxidative stress injury tested thus far [1,5], and importantly their advance toward clinical use, we find it critical to point out that the quality of the drugs may not be a priori assumed good enough. We provide herein some simple, key analytical techniques that can be conveniently used by the researchers themselves to check the quality of the cationic MnPs before valuable resources (animals, compounds, time, manpower) are wasted.
Experimental
Chemicals
Analytically pure MnTE-2-PyP5+ [3] and MnTM-2-PyP5+ [6] samples (chloride salts) were prepared as previously reported. (Caution needs to be exercised with all the chemicals used in the synthesis as their quality declined lately). The quality of these authentic samples remained unaltered for years when stored at ambient conditions. Commercial samples of MnTE-2-PyP5+ (Commercial “MnTE-2-PyP5+”; lot # B71001) and MnTM-2-PyP5+ (Commercial “MnTM-2-PyP5+”; lot # D00028286) were purchased from Calbiochem and promptly analyzed as received; analyses of the commercial samples remained also unaltered upon storage at room or low temperature (within at least 1 year). Heptafluorobutyric acid (HFBA, Aldrich), MeCN (Mallinckrodt), KNO3 (Aldrich), and NaCl (Aldrich) were used as received. We have also compared the UV-vis spectra of a pure MnTBAP sample [4] and an Alexis Biochemicals sample (lot#19498).
Thin layer chromatography
(TLC) was carried out in polyester-backed silica-gel sheets without fluorescent indicator (Sigma-Aldrich Z122777-25EA) cut into ~2 × 20 cm strips and eluted with a sat. KNO3(aq)-H2O-MeCN (1:1:8, v/v/v) mixture in a capped 1 l chamber. Typically, 1 µl of ~1 mM samples were applied at ~ 1cm of the strip border and the solvent front was allowed to run ~12 cm.
UV-vis spectra
were recorded in H2O on a Shimadzu UV-2501PC spectrophotometer (0.5 nm resolution).
Electrospray mass spectrometric analyses
(ESI-MS) were performed on an Applied Biosystems MDS Sciex 3200 Q Trap LC/MS/MS spectrometer at Duke Comprehensive Cancer Center, Shared Resource PK Labs; all samples of ~5 µM concentration were prepared in a H2O-MeCN (1:1, v/v; containing 0.1 % v/v HFBA) mixture and infused for 1 min at 10 µl/min into the spectrometer (curtain gas = 20 V; ion spray voltage = 3500 V; ion source = 30 V; T = 300 °C; declustering potential = 20 V; entrance potential = 1 V; collision energy = 5 V; gas = nitrogen).
Electrochemical measurements
were carried out on a Voltammetric Analyzer model 600 (CH Instruments), using a glassy carbon working electrode, a standard Ag/AgCl reference electrode, and a platinum wire as auxiliary electrode. Samples (~0.5 mM) were prepared in phosphate buffer (pH 7.8; 0.05 M) containing 0.1 M NaCl as electrolyte (as described in [7]).
Results and Discussion
Among a variety of physico-chemical analysis to which the samples may be subjected, thin-layer chromatography (TLC), electrospray mass spectrometry (ESI-MS), UV-vis spectroscopy, and cyclic voltammetry were the most informative and the easiest to implement in general biochemical/chemical/biomedical laboratories and can be used routinely to check for the purity of MnTE-2-PyP5+ and MnTM-2-PyP5+ even in the absence of an authentic sample for comparison.
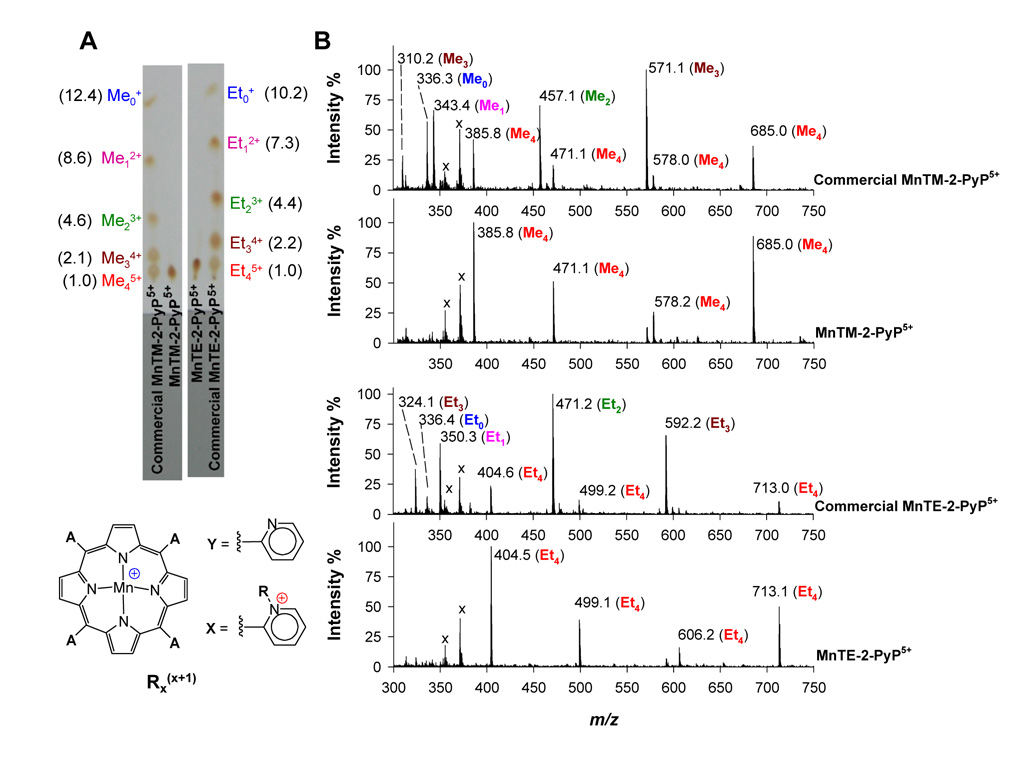
The simplest and most straightforward method to analyze cationic porphyrins is by TLC on SiO2 eluted with a sat. KNO3(aq)-H2O-MeCN (1:1:8, v/v/v) mixture. Whereas pure MnTE-2-PyP5+ and MnTM-2-PyP5+ appear as one single spot in the TLC plate, analysis of the commercial samples showed 5 well-resolved spots (Fig. 1). This is consistent with a mixture of partially alkylated compounds that eluted according to the number of alkyl groups, i.e., the overall positive charge of the compounds [3]. Visual inspection of these plates indicated that MnTE-2-PyP5+ and MnTM-2-PyP5+ were not even the major compounds in the commercial samples sold as “MnTE-2-PyP” and “MnTM-2-PyP”, respectively. When the TLC plates were observed under a long wavelength UV lamp (~350 nm), the absence of red fluorescence indicated that no metal-free ligand was present in the samples.
Figure 1.
TLC and ESI-MS analyses of authentic and commercial samples of MnTE-2-PyP5+ (R = Et) and MnTM-2-PyP5+ (R = Me). (A) TLC-SiO2 was eluted with a sat. KNO3(aq)-H2O-MeCN (1:1:8, v/v/v) mixture. The commercial samples are a mixture of compounds: R45+ (A = 4X), R34+ (A = 3X +Y), R23+ (A = 2X + 2Y), R12+ (A = X + 3Y), R01+ (A = 4Y). Rf values relative to R45+ are in parenthesis. (B) ESI-MS spectra were done in H2O-MeCN (1:1 v/v; containing 0.1% v/v HFBA). Peak assignments are given in Table 1. Peaks marked with “x” do not belong to the samples as they appear in the neat solvent spectra (baseline controls).
The nature of the commercial samples as a mixture of MnPs containing 0 to 4 alkyl groups, as indicated by TLC, was confirmed by ESI-MS [8]. The addition of HFBA yielded fairly stable MnP-HFBA ion-pairs under ESI-MS conditions and reduced considerably peak overlap (Fig. 1); peak assignments for these spectra are summarized in Table 1. That the presence of these less alkylated species is not due to the alkyl group loss during ionization was confirmed by the fact that under the same conditions of analysis the spectra of the authentic samples showed no significant loss of alkyl groups.
Table 1.
Peak assignments of the ESI-MS spectra of the authentic and the commercial samples of MnTE-2-PyP5+ and MnTM-2-PyP5+ in H2O-MeCN (1:1, v/v; containing 0.1% v/v HFBA).
| Peak Assignmenta | R = Et (MnTE-2-PyP5+) | R = Me (MnTM-2-PyP5+) | ||||
|---|---|---|---|---|---|---|
| (Calcd) | Authentic | Commercial | (Calcd) | Authentic | Commercial | |
| [R34+ + HFBA–]3+/3 | 323.94 | – | 324.1 | 309.82 | – | 310.2 |
| [R0+ + H+]2+/2 | 336.31 | – | 336.4 | 336.31 | – | 336.3 |
| [R12+]2+/2 | 350.34 | – | 350.3 | 343.32 | – | 343.4 |
| [R45+ + 2HFBA–]3+/3 | 404.64 | 404.5 | 404.6 | 385.94 | 385.8 | 385.8 |
| [R23+ + HFBA–]2+/2 | 471.38 | – | 471.2 | 457.36 | – | 457.1 |
| [R45+ + HFBA− – 2H+]2+/2 | 499.43 | 499.1 | 499.2 | 471.38 | 471.1 | 471.1 |
| [R34+ + 2HFBA−]2+/2 | 592.43 | – | 592.2 | 571.39 | – | 571.1 |
| [R45+ + 2HFBA− – H+]2+/2 | 606.45 | 606.2 | – | 578.40 | 578.2 | 578.0 |
| [R45+ + 3HFBA−]2+/2 | 713.47 | 713.1 | 713.0 | 685.42 | 685.0 | 685.0 |
HFBA− corresponds to heptaflourobutyrate anion (C4F7O2−); structures of the species Rxx+1 (x = 0 to 4) are given in Fig. 1.
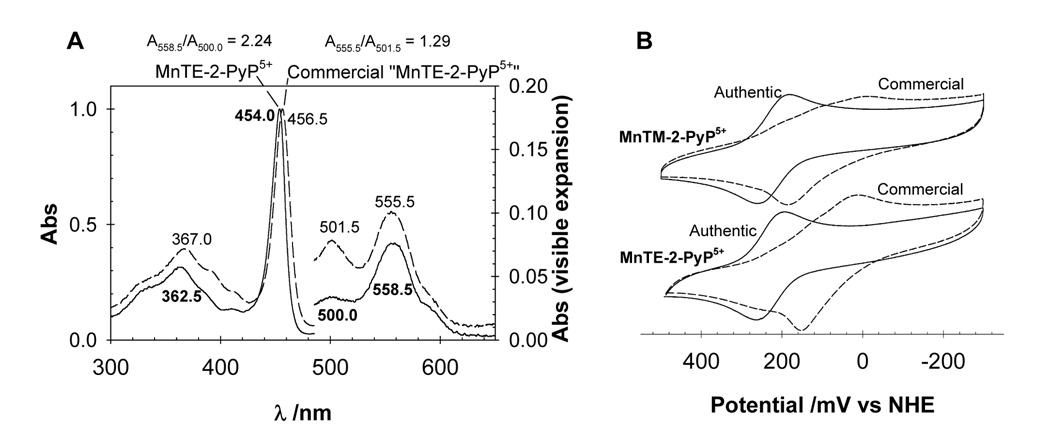
UV-vis spectroscopy and electrochemistry are useful, complimentary techniques to TLC and ESI-MS. Although they do not show directly the level of contamination of a particular sample, they can provide a quick assessment of its overall quality. For example, the UV-vis spectrum of the authentic sample of MnTE-2-PyP5+ in H2O is characterized by a strong Soret band at 454 nm and two bands in the visible region at 550.0 and 558.5 nm. For MnTM-2-PyP5+, these values are 453.5, 556.0, and 498.5 nm. In the commercial samples of both MnTE-2-PyP5+ and MnTM-2-PyP5+ the Soret band is red-shifted, which indicates a higher electron density at the MnP core and a reduced number of alkyl moieties/positive charges around the complexes (Fig. 2A) [3]. Although the small red-shift may only be readily seen in high-resolution (< 1 nm) UV-vis spectrophotometers, the relative intensity of the visible bands can be used easily as an indication of sample quality even in lower resolution UV-vis spectra (e.g., 2 nm-resolution spectrophotometers): A558.5/A500.0 = 2.24 (authentic MnTE-2PyP5+) and A555.5/A498.0 = 2.18 (authentic MnTM-2-PyP5+); these values are considerably lower in the commercial samples (1.29 and 1.36, respectively).
Figure 2.
(A) UV-vis spectra of an authentic (solid) and a commercial (dash) sample of MnTE-2-PyP5+ in H2O; nearly identical spectra were obtained with MnTM-2-PyP5+ (not shown). (B) Cyclic voltammograms of the authentic (solid) and the commercial (dash) samples of MnTE-2-PyP5+ and MnTM-2-PyP5+ (~0.5 mM) in phosphate buffer (pH 7.8; 0.05 M) and 0.1 M NaCl. Scan rate = 10 mV/s.
The cyclic voltammograms of the authentic MnP samples are characterized by well-defined Mn-centered reduction and oxidation waves, whose half-wave potentials (E½) corresponding to the MnIII/MnII reduction potential occur at 228 mV and 220 mV vs. NHE for MnTE-2-PyP5+ and MnTM-2-PyP5+, respectively (Fig. 2B). Conversely, the voltammograms of the commercial samples are marked by ill-defined “bumpy” cathodic and anodic waves with large peak-peak separation (>150 mV; as compared with ~70 mV for the authentic samples), which is consistent with the presence of a mixture of compounds. The overall decrease in the potentials of the processes observed in the commercial samples indicates a greater stabilization of MnIII, which is consistent with a smaller number alkyl groups, a reduction in the charges around the MnP, and, consequently, a weaker electron-withdrawing effect on the Mn center [3,5]. Of note, the authentic tri- and dimethylated MnP compounds have E½ values of 118 and 53 mV vs NHE, respectively [3]. Analytical data for the non-, di-, and trimethylated species are given elsewhere [3,7,9].
Non- and partially alkylated MnPs are less charged, more lipophilic, and less potent mimics than the fully alkylated analogue [1,3,5,7]. It follows, thus, that the (unknowingly) use of an ill-defined mixture of compounds, such as that of commercial “MnTE-2-PyP5+” or “MnTM-2-PyP5+”, in place of the corresponding authentic compounds may have consequences on uptake, biodistribution, and dosing effects.
Cationic Mn porphyrins are usually isolated as hydrated solids [1,3,6]. Whereas the authentic MnTE-2-PyP5+ and MnTM-2-PyP5+ samples are indefinitely stable upon storage at ambient conditions, we have observed that attempts to remove residual water at high temperature and low pressure are often accompanied by irreversible N-dealkylation. We speculate that a drying procedure in the manufacturing process may be the origin of the non- and partially alkylated species in the commercial samples; further dealkylation of these samples upon storage at ambient conditions was not observed in our hands.
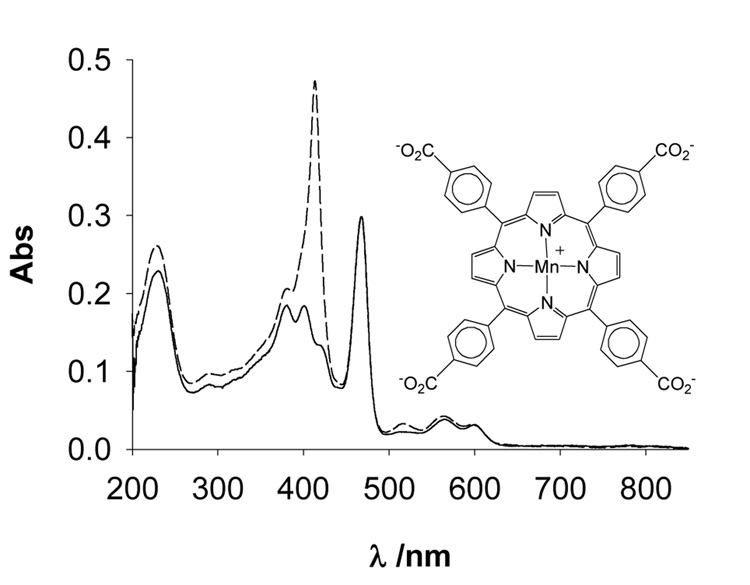
A third illustration of the usefulness of this general strategy of analysis to spot poor quality MnP preparations is exemplified by the case of an anionic Mn porphyrin, MnTBAP. While we have already reported on the insufficient purity of the MnTBAP samples from several suppliers, in a more recent sample of MnTBAP by Alexis Biochemicals (lot# 19498), the situation was dramatic, as a simple UV-vis analysis indicated that ¼ of the sample was not MnTBAP, but the Mn-free ligand, H2TBAP (Fig. 3); assessment of sample quality by other techniques was clearly unjustified at this level of ligand contamination. Of note, in the previous MnTBAP lot# 21011 [4], H2TBAP was present at ~2 %. There is already a significant amount of publications dealing with in vivo and in vitro effects of MnTBAP in oxidative stress injuries [10]. As we have recently proposed that pure MnTBAP may be a selective scavenger of ONOO− over superoxide [11], it is likely that the interest in this compound will increase. However, despite the purity indicated by the suppliers (lot #19498 was claimed “98%” pure), it is advisable that all samples be checked by the techniques described here and elsewhere [4] to avoid artifacts (porphyrin ligands are photosensitizers, and Mn-clusters are SOD active) and to assure that the therapeutic and mechanistic conclusions reached with “MnTBAP” hold true.
Figure 3.
UV-vis spectra of an authentic (solid) and a commercial (dash) sample of MnTBAP. The data were obtained by diluting a stock solution of MnTBAP (~0.1 mM; pH 12) in phosphate buffer (pH 7.8; 0.05 M). The molar absorptivity values of authentic MnTBAP (log ε468 = 5.04 and log ε414 = 4.70) and that of H2TBAP (log ε414 = 5.59) were used to estimate the ~25 % contribution of the metal-free ligand in the commercial sample of MnTBAP.
The pervasive use of MnPs in cell and animal experiments, if not accompanied by a judicious analysis of the quality of the samples, represents a quick formula for misleading results, questionable conclusions, and a hindrance to the smooth development of the field of oxidative stress and redox-modulation-based therapeutics. We showed here simple procedures to check the quality of a few samples of MnPs. A similar approach can be extended to other Mn porphyrins.
Acknowledgments
J.S.R. and I.B.H. acknowledge the support by the NIAID grants U19AI67798-01 and 5-U19-AI-067798-03. I.S. thanks NIH/NCI Duke Comprehensive Cancer Center Core Grant 5-P30-CA14236-29. We thank the groups of Drs. David S. Warner, Joan S. Valentine, and Richard Gatti for the Calbiochem samples of “MnTE-2-PyP” and “MnTM-2-PyP”.
Footnotes
Publisher's Disclaimer: This is a PDF file of an unedited manuscript that has been accepted for publication. As a service to our customers we are providing this early version of the manuscript. The manuscript will undergo copyediting, typesetting, and review of the resulting proof before it is published in its final citable form. Please note that during the production process errors may be discovered which could affect the content, and all legal disclaimers that apply to the journal pertain.
References
- 1.Rebouças JS, Spasojević I, Tjahjono DH, Richaud A, Mendez F, Benov L, Batinić-Haberle I. Dalton Trans. 2008:1233–1242. doi: 10.1039/b716517j. and references therein. [DOI] [PubMed] [Google Scholar]
- 2.Spasojević I, Chen Y, Noel TJ, Fan P, Zhang L, Rebouças JS, St. Clair DK, Batinić-Haberle I. Free Radic. Biol. Med. 2008 doi: 10.1016/j.freeradbiomed.2008.05.015. [DOI] [PMC free article] [PubMed] [Google Scholar]
- 3.Batinić-Haberle I, Benov L, Spasojević I, Hambright P, Crumbliss AL, Fridovich I. Inorg. Chem. 1999;38:4011–4022. and references therein. [Google Scholar]
- 4.Rebouças JS, Spasojević I, Batinić-Haberle I. J. Inorg. Biol. Chem. 2008;13:289–302. doi: 10.1007/s00775-007-0324-9. and references therein. [DOI] [PubMed] [Google Scholar]
- 5.Rebouças JS, DeFreitas-Silva G, Idemori YM, Spasojević I, Benov L, Batinić-Haberle I. Free Radic. Biol. Med. 2008;45:201–210. doi: 10.1016/j.freeradbiomed.2008.04.009. and references therein. [DOI] [PMC free article] [PubMed] [Google Scholar]
- 6.Batinić-Haberle I, Benov L, Spasojević I, Fridovich I. J. Biol. Chem. 1998;273:24521–24528. doi: 10.1074/jbc.273.38.24521. [DOI] [PubMed] [Google Scholar]
- 7.Spasojević I, Batinić-Haberle I, Rebouças JS, Idemori YM, Fridovich I. J. Biol. Chem. 2003;278:6831–6837. doi: 10.1074/jbc.M211346200. [DOI] [PubMed] [Google Scholar]
- 8.Batinić-Haberle I, Stevens RD, Fridovich I. J. Porphyrins Phthalocyanines. 2000;4:217–227. [Google Scholar]
- 9.Rebouças JS, de Carvalho MEMD, Idemori YM. J. Porphyrins Phthalocyanines. 2002;6:50–57. [Google Scholar]
- 10.Martin RCG, Liu Q, Wo JM, Ray MB, Li Y. Clin. Cancer Res. 2007;13:5176–5182. doi: 10.1158/1078-0432.CCR-07-1152. [DOI] [PubMed] [Google Scholar]
- 11.Batinić-Haberle I, Cuzzocrea S, Rebouças JS, Ferrer-Sueta G, Mazzon E, Di Paola R, Radi R, Spasojević I, Benov L, Salvemini D. Free Radic. Biol. Med. doi: 10.1016/j.freeradbiomed.2008.09.042. submitted. [DOI] [PMC free article] [PubMed] [Google Scholar]


