Abstract
We describe the coupling of liquid chromatography (LC) separations with mass spectrometry (MS) using nanoelectrospray ionization (nanoESI) multi-emitters. The array of 19 emitters reduced the flow rate delivered to each emitter, allowing the enhanced sensitivity that is characteristic of nanoESI to be extended to higher flow rate separations. The signal for peptides from spiked proteins in a human plasma tryptic digest increased 11-fold on average when the multi-emitters were employed, due to increased ionization efficiency and improved ion transfer efficiency through a newly designed heated multi-capillary MS inlet. Additionally, the LC peak signal-to-noise ratio increased ∼7-fold when the multi-emitter configuration was used. The low dead volume of the emitter arrays preserved peak shape and resolution for robust capillary LC separations using total flow rates of 2-μL/min.
INTRODUCTION
The rapid growth in the use of electrospray ionization mass spectrometry (ESI-MS) over the past 2 decades, particularly for biological applications, has been accompanied by ongoing efforts to increase its sensitivity.1,2 These efforts have been motivated by the fact that only a small fraction of the analyte ions ever reach the detector.3-6 While ion losses can occur in the mass analyzer, most of the losses presently encountered arise from incomplete droplet desolvation or during transport from atmospheric pressure to the high vacuum region of the mass spectrometer. Many innovations have been implemented to reduce ion losses at the atmospheric pressure interface, including the use of drying gases,7 air amplifiers,8 and electrostatic lenses.9 In addition, interfaces that replace the standard skimmer with the electrodynamic ion funnel10-16 have proven far more efficient for transmitting ions through the first vacuum stage.
Besides hardware modifications, operation of ESI at low flow rates can also greatly improve efficiency. The smaller charged droplets produced by an electrospray in the so-called nanoESI regime facilitate desolvation and increase the amount of excess charge available per analyte molecule.17-21 Quantitation is thus improved,20,22,23 and the emitter can be positioned closer to the MS inlet, further reducing ion losses.1,21 However, problems associated with nanoESI such as emitter clogging, and the much higher flow rates of most liquid chromatography (LC)-ESI-MS analyses, can preclude operation in the nanoESI regime with its associated benefits for sensitivity. Clogging issues5,23,24 arise from the internal taper and the requisite narrow orifice of the pulled fused silica or glass emitters typically employed for nanoESI. Fortunately, the recent development of chemically etched fused silica emitters25 in large part solves the clogging issue, as the emitters do not taper internally and relatively large orifices can be used; we routinely operate 20-μm-i.d. etched emitters at 20 nL/min in stable cone-jet mode.26 For LC-ESI-MS analyses, the flow rate delivered to the ESI emitter is generally dictated by the flow from the LC column. As a result, the flow is typically optimized for a particular LC application, and not for nanoESI. Recently developed nanoLC systems aim to increase sensitivity by operating at reduced flow rates. However, very few27-30 operate optimally below 100 nL/min where the benefits of nanoESI for sensitivity and quantitation are most pronounced,22,23 and the nanoLC separations are accompanied by a decrease in sample loading capacity and tolerance for dead volume.
Ideally, the flow rates used for LC and for ESI should be chosen and optimized independently, rather than requiring a compromise. Our work seeks to accomplish this by dividing the flow post-column among multiple emitters. While multi-emitters have been investigated for a variety of proposed applications,31-36 only recently was their coupling to mass spectrometers demonstrated.37-39 Since we originally reported a 2-3-fold sensitivity enhancement using a laser-machined polycarbonate microchip having 9 discrete emitters,37 other approaches for improving the sensitivity of ESI-MS analyses with arrays of emitters have been explored. Kim, et al. recently reported microfabricated multi-emitters made from Si wafers.38 This fabrication approach enabled unprecedented line densities of emitters (10 emitters spanning 100 μm) and offered promise for coupling microfluidic separations to MS detectors. The initial demonstration of the Si multi-emitters showed only a small improvement for an array of 5 emitters operated at 600 nL/min relative to a single emitter, which highlighted the need for the MS inlet to be concomitantly modified to efficiently transfer the greater ion current. We recently developed an approach for creating arrays of emitters from chemically etched fused silica capillaries.39 The 19-emitter arrays were capable of operation at flows as low as 20 nL/min/emitter. By coupling the emitters with a custom-built MS interface consisting of a multi-capillary heated inlet and tandem electrodynamic ion funnels, a 9-fold sensitivity enhancement was observed for reserpine compared to an individual emitter interfaced with the instrument via a single inlet/ion funnel configuration.
Here, we have expanded the characterization of the capillary-based emitter arrays and have further improved ion transmission efficiency by ∼60% with a redesigned multi-capillary heated inlet. In addition, arrays of emitters have been used for LC-ESI-MS analyses for the first time. The LC-ESI-MS experiments demonstrated sensitivity gains greater than an order of magnitude for peptides from proteins spiked in human plasma and showed substantial gains in signal-to-noise ratio (S/N) for extracted LC peaks. For the capillary LC separations, which were operated at ∼2 μL/min, peak width and shape were preserved when the emitter arrays were employed due to their low internal volume and their ready coupling to the LC columns.
EXPERIMENTAL
Sample Preparation
Acetonitrile (ACN) and 49% hydrofluoric acid were purchased from Fisher Scientific (Fair Lawn, NJ). Glacial acetic acid (HAc) and trifluoroacetic acid (TFA) were purchased from Sigma-Aldrich (St. Louis, MO). Water was purified using a Barnstead Nanopure Infinity system (Dubuque, IA). Mobile phases A and B, which were used for the gradient elution LC separations, consisted of H2O/HAc/TFA (100:0.2:0.5; v/v/v) and ACN/H2O/TFA (90:10:0.1; v/v/v), respectively. A standard peptide solution was used for direct infusion experiments that contained angiotensin I, neurotensin, bradykinin and kemptide (Sigma-Aldrich). The peptide concentrations were 500 nM each and the solvent was 2:1 mobile phase A:mobile phase B.
Preparation of the spiked human blood plasma sample used for the LC experiments has been described in detail elsewhere.40 Briefly, human blood plasma obtained from a healthy volunteer was determined to have an initial protein concentration of 65 mg/mL. Bovine carbonic anhydrase II, rabbit glyceraldehyde-3-phosphate dehydrogenase (G3PDH), E. Coli β-galactosidase and bovine β-lactoglobulin (Sigma) were spiked to a concentration of 40 μg/mL each into the unprocessed human plasma. Equine skeletal muscle myoglobin and chicken ovalbumin (Sigma) were spiked at 4 μg/mL. The spiked sample was depleted of 12 high-abundance plasma proteins using an IgY-12 affinity LC column (Beckman Coulter, Fullerton, CA), and then tryptically digested, fractionated by strong cation exchange chromatography, dried under vacuum, and dissolved in 30 μL of 25 mM NH4HCO3 as typically done for such analyses at our laboratory. For this work, 14 of the fractions were pooled, and the sample was further diluted in mobile phase A to a final peptide concentration of 0.1 μg/μL.
ESI Emitters
Individual emitters were made from ∼4 cm sections of 20 μm i.d. × 150 μm o.d. fused silica capillaries (Polymicro Technologies, Phoenix, AZ) and were chemically etched using a previously published procedure.25 Multi-emitter arrays were made from 19 fused silica capillaries (20 μm i.d. × 150 μm o.d.) as described previously,39 but with the following modification: Devcon HP250 epoxy (Danvers, MA) was used to seal around the individual capillaries in place of Devcon 14250 epoxy. The epoxy was mixed according to the manufacturer’s specifications and cured at 80 °C for 2 h after being applied to the devices.
MS Instrumentation
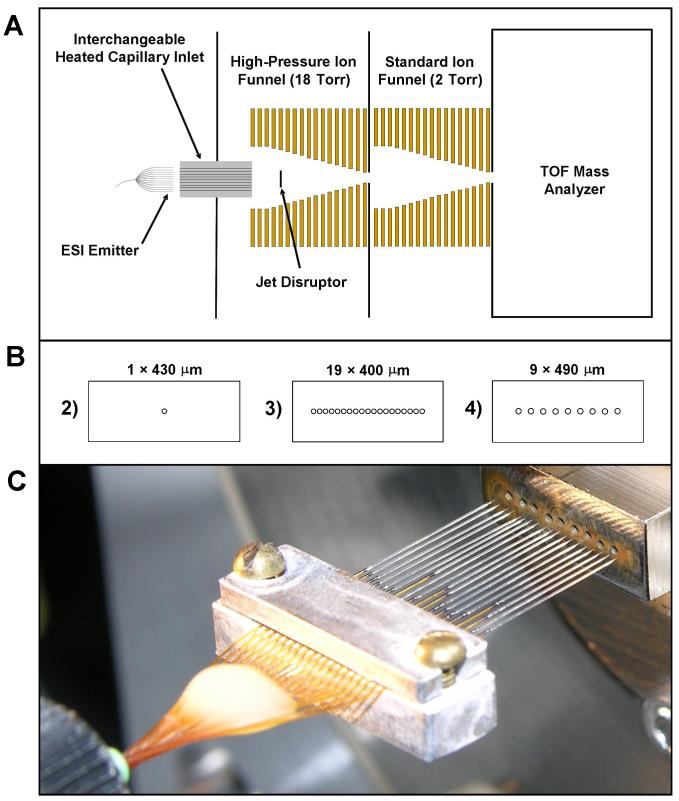
All MS experiments used an Agilent 6210 (Santa Clara, CA) time-of-flight (TOF) mass spectrometer, either with Agilent’s commercially available NanoESI interface, or a tandem ion funnel interface, which is depicted in Figure 1A. The tandem ion funnel interface accommodated the increased gas throughput from the multi-capillary inlets, and used the same design described previously.16,39 The high-pressure ion funnel, which was operated at 18 Torr for this work, was driven at 1.7 MHz with an amplitude of 170 Vp-p. The conventional ion funnel operated at 1.3 Torr with an RF of 730 kHz at 100 Vp-p. A linear DC gradient of 17.0 V/cm was applied to the 18 Torr ion funnel, and 14.8 V/cm was applied to the 1.3 Torr ion funnel.
Figure 1.
Experimental setup. (A) Schematic depiction of the TOF instrument modified with an interchangeable heated capillary inlet and differentially pumped tandem ion funnels. The entrance and exit diameters of both the high-pressure and standard ion funnels were 25.4 mm and 2.5 mm, respectively. (B) Front view of the heated capillary inlets used for instrument Configurations 2-4 (Table 1). Capillary spacing (center-to-center) was 500 μm in Configuration 3 and 1.0 mm in Configuration 4. (C) Photograph of an array of 19 emitters positioned in front of a heated multi-capillary inlet (Configuration 4).
Four ESI source configurations were evaluated as outlined in Table 1. In addition to the standard Agilent NanoESI interface used with an individual ESI emitter (Configuration 1, Table 1), three different heated capillary inlets, depicted in Figure 1B, were used at different times with the ion funnel-modified TOF mass spectrometer. The single-capillary inlet (Configuration 2) was 6.4 cm long and had an i.d. of 430 μm. The 19 capillary inlet (Configuration 3) had the same length and was comprised of 400 μm i.d./500 μm o.d. capillaries (Part # 88935K236, McMaster-Carr, Los Angeles, CA) with 500 μm center-to-center spacing. The final inlet evaluated consisted of a linear array of 9 inlet capillaries (Configuration 4) that was fabricated in a stainless steel body using electrical discharge machining. The 490 μm i.d. inlets were spaced 1.0 mm on center and were 4.4 cm long. Figure 1C shows the multi-ESI array interfaced with the 9-capillary inlet. The inlets from Configurations 2-4 were heated to 125 °C and were biased 10 V higher than the first ion funnel electrode. For all experiments other than those employing the Agilent NanoESI source, the individual or multi-emitters were positioned 1 to 1.5 mm from the inlet, and a 2 kV potential was applied to the solution through the stainless steel union that connected the LC column or infusion line to the emitter. When the Agilent NanoESI source was used, the emitter position was optimized for maximum signal intensity and an ESI potential of 1.8 kV was used. A counterflow of heated N2 was applied at 250 °C and 7.0 L/min.
Table 1.
Summary of emitter/inlet combinations that were evaluated
| Configuration | Emitter | MS Interface |
|---|---|---|
| 1 | 1 × 20 μm i.d. | Standard Agilent NanoESI |
| 2 | 1 × 20 μm i.d. | Heated Capillary (1 × 430 μm i.d.)/Tandem Ion Funnel |
| 3 | 19 × 20 μm i.d. | Heated Capillary (19 × 400 μm i.d.)/Tandem Ion Funnel |
| 4 | 19 × 20 μm i.d. | Heated Capillary (9 × 490 μm i.d.)/Tandem Ion Funnel |
Infusion data were acquired in profile mode, and signals were averaged for 30 s (10,000 cycles/scan, 0.89 scan/s). For LC separations, data were collected in centroid mode with the minimum thresholding allowed by the software (50 counts).
Liquid Chromatography
Reversed-phase capillary LC separations with an exponential solvent gradient41 were performed using a Gilson 321 pump (Middleton, WI). The adjustable solvent mixer on the pump was set to 2.2 mL and an external 6-port valve (VICI Valco, Houston, TX) with a 10 μL sample loop was used for sample loading and injection. A 20 μm i.d. × 360 μm o.d. open tubular fused silica capillary (Polymicro Technologies) served as a microflow splitter that was adjusted in length such that the flow rate through the LC column was 2 μL/min when the pump flow rate was set to 21 μL/min. Operational pressure was ∼5,000 psi. The 65-cm-long, 150-μm-i.d. fused silica analytical columns were packed in-house with 5 μm porous C-18 bonded particles (Phenomenex, Torrance, CA) as described previously.41
RESULTS AND DISCUSSION
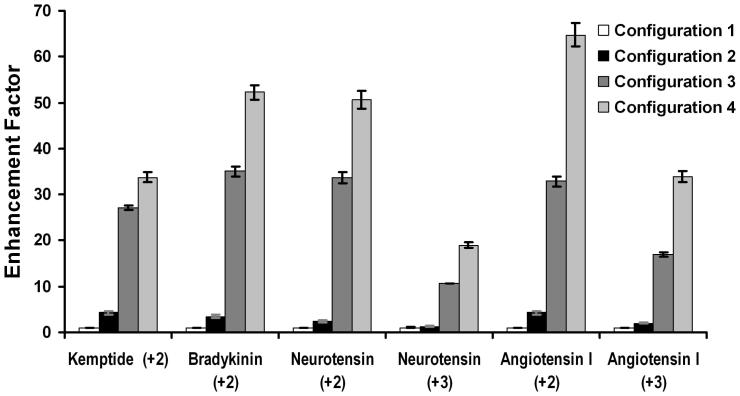
In our previous work, direct infusion results were compared between ESI source Configurations 2 and 3 (Table 1). Here, we have expanded the comparison to include two additional configurations. Configuration 1 enabled the instrument modifications of the present work to be compared with the unmodified TOF mass spectrometer. Changing between Configurations 1 and 2 replaced the skimmer with the ion funnel and positioned the ES emitter axially instead of orthogonally to the MS inlet. Also, Configuration 1 used a heated curtain gas to assist in desolvation, while a heated capillary inlet was employed for Configurations 2-4. By contrast, when comparing between Configurations 2-4, only the emitters and the inlets were changed, and all other factors, including pressures in the vacuum chambers, the distance from the emitters to the inlets, the ESI voltage, etc. were held constant. It was determined experimentally that an applied ESI voltage of 2.0 kV with 1-1.5 mm spacing from emitter to inlet optimized measured ion currents for Configurations 2-4. Figure 2 presents relative peak intensities for direct infusion of a mixture of 4 peptides using the four different configurations. Peak intensities were normalized such that those for Configuration 1 were unity. Thus, the plot shows “enhancement factors” relative to Configuration 1. Error bars in Figure 2 are standard deviations based on 3 replicate analyses for which the signal was averaged for 30 s each time. Of particular note in Figure 2, Configuration 4, which was developed for this work in an effort to further improve ion transmission efficiency, provided a ∼60% improvement relative to Configuration 3. This was due to the larger inlets and the decrease in total length, which reduced ion losses to the interior walls of the inlet capillaries.6 Remarkably, the combined enhancements of the ion funnel, the emitter arrays and the improved ion transmission efficiency produced an increase in analyte peak intensities averaging more than 40-fold relative to the unmodified TOF MS instrument.
Figure 2.
Sensitivity comparison of a mixture of standard peptides for the four different emitter/inlet configurations in Table 1. The solution flow rate was 2.0 μL/min. Additional description is in the text.
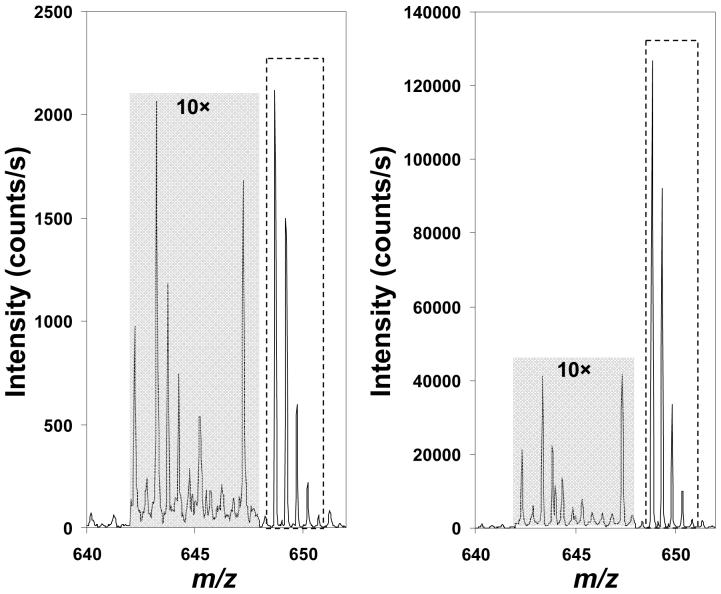
While the sensitivity gains demonstrated in Figure 2 are impressive, improvements in S/N were more modest. For the 4 peptides analyzed here, we observed an average improvement in S/N of just 80% between Configurations 1 and 4. The reason for the small gain was that S/N for this experimental setup was limited by chemical, rather than random noise. This is demonstrated in Figure 3, which shows the mass spectrum for Angiotensin I with the adjacent baseline that was used to calculate S/N magnified 10-fold. The “noise” peaks in the spectra match, indicating that they are not random. Further, S/N did not change for Configuration 4 even when signal averaging was decreased from 30 s to 1 s (not shown). For cases in which S/N is dominated by chemical noise, the benefits of the multi-ESI approach are limited, as detection of contaminating species is enhanced along with the analytes of interest. However, the increased ion currents should still benefit MS/MS experiments because the decrease in ion trap fill times will reduce undersampling. Additionally, as chemical noise is generally singly charged42 and most electrosprayed peptides are multiply charged, a technique that is capable of spatially separating ions according to charge state (e.g., ion mobility spectrometry (IMS)-TOF MS43) should allow the increased ion signal afforded by this technique to translate to improved S/N and reduced detection limits.
Figure 3.
Mass spectra of Angiotensin I [M+2H]2+ (inside of dashed lines) from (A) configuration 1 and (B) configuration 4. The shaded baseline to the left of the analyte signal was magnified 10-fold for clarity.
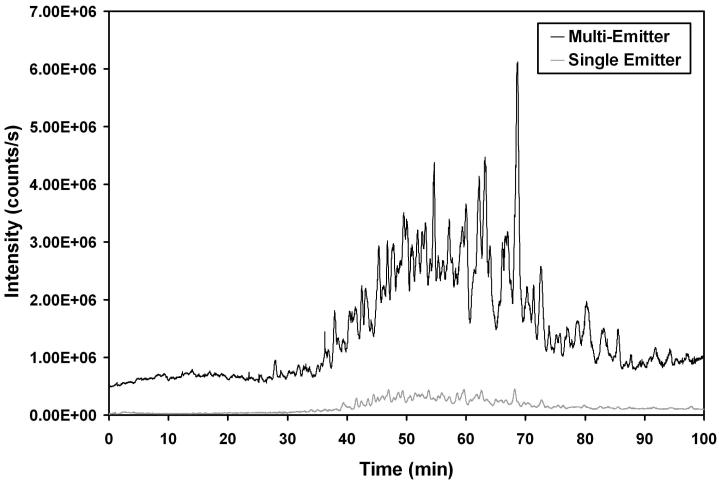
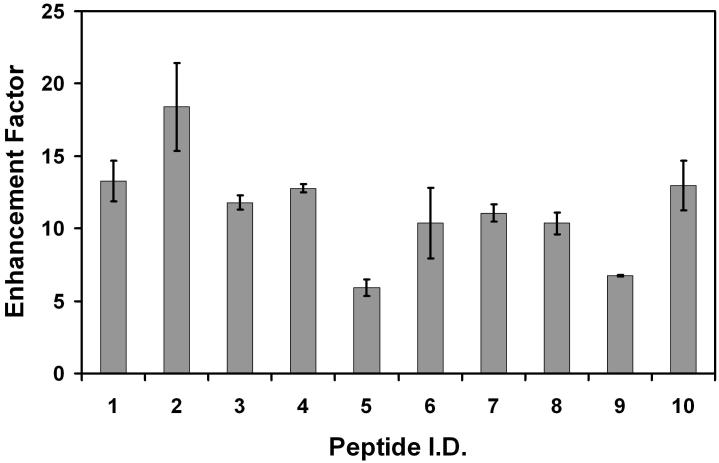
In addition to being further characterized for direct infusion applications, the emitter arrays were also evaluated in conjunction with LC for the first time. Figure 4 shows chromatograms of tryptically digested depleted human plasma when a single emitter (Configuration 2) and a multi-nozzle emitter (Configuration 4) were used. Comparison between these two configurations enabled all instrument parameters to be held constant apart from the emitters and the inlets. The chromatograms are plotted on the same intensity scale to show the marked increase in sensitivity afforded by the emitter array. Intensities of individual peptides from spiked proteins were also identified and compared between the two configurations, and the signal gains from Configuration 2 to Configuration 4 are presented as enhancement factors in Figure 5; error bars are standard deviations based on 3 replicate separations. Figure 5 shows that signal intensities increased on average more than 11-fold, somewhat higher than our previous report,39 due to the improved ion transmission efficiency through the modified inlet.
Figure 4.
Total ion chromatograms of depleted human plasma (1 μg total sample) using a multi-emitter (configuration 4) and a single emitter (configuration 2).
Figure 5.
Signal enhancement for 10 peptides spiked into depleted human plasma tryptic digest. Peptide I.D.s are listed in Table 2. Additional description is in the text.
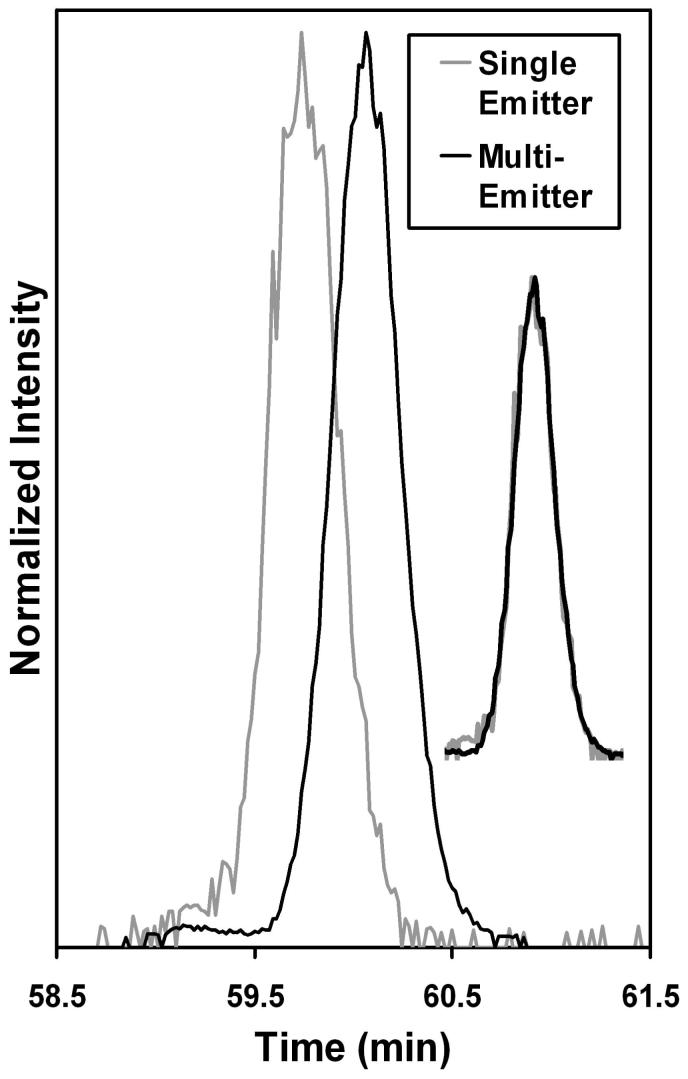
It is vital that the improvements in ion production and transmission afforded by the multi-nozzle emitters do not degrade chromatographic resolution due to post-column peak broadening. A benefit of our capillary-based emitters is that they connect to capillary columns using standard fittings. Coupling other reported emitter arrays37, 38 to LC would not be so straightforward. Nevertheless, a potential concern still existed, as the i.d. of each capillary in the array was the same as the i.d. of the single emitter used for comparison. As the emitter lengths were similar, the internal volume of the multi-emitter array was ∼20 times greater than that of the single emitter. We evaluated extracted ion chromatograms (EICs) from the two configurations to compare peak widths and shapes. Figure 6 shows the EICs for Peptide 10 (Table 2) when the single and multi-emitters were used. By normalizing the peaks for height, it is clear that they are essentially identical in terms of peak width and shape, and therefore post-column broadening did not significantly impact this separation. Post-column broadening could become a greater contributor to peak width for lower flow rate separations, in which case smaller i.d. emitters may be attractive. However, the present results show that good chromatographic fidelity can be obtained at flow rates close to the optimum for high separation efficiency.
Figure 6.
Extracted ion chromatograms of Peptide 10 (Table 2) from analyses employing a single emitter and an array of 19 emitters. The peaks are overlaid in the inset, showing identical peak shapes and widths.
Table 2.
Peptides from proteins spiked in human plasma that were used for sensitivity comparisons
| Peptide I.D. | m/z | Sequence | Protein |
|---|---|---|---|
| 1 | 1127.08 | YGDFGTAAQQPDGLAVVGVFLK | Bovine carbonic anhydrase II |
| 2 | 791.41 | YAAELHLVHWNTK | Bovine carbonic anhydrase II |
| 3 | 882.4 | LISWYDNEFGYSNR | Rabbit G3PDH |
| 4 | 908.45 | GLSDGEWQQVLNVWGK | Horse myoglobin |
| 5 | 636.34 | LFTGHPETLEK | Horse myoglobin |
| 6 | 887.45 | ISQAVHAAHAEINEAGR | Chicken ovalbumin |
| 7 | 697.87 | LPSEFDLSAFLR | E. Coli β-galactosidase |
| 8 | 871.95 | LSGQTIEVTSEYLFR | E. Coli β-galactosidase |
| 9 | 684.33 | YHYQLVWCQK | E. Coli β-galactosidase |
| 10 | 600.83 | LDQWLCEK | Bovine β-lactalbumin |
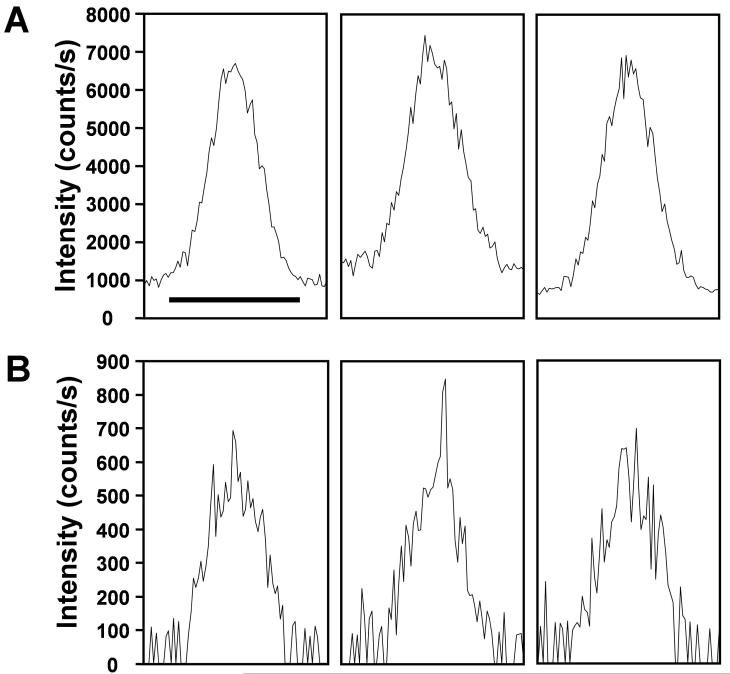
While the peaks in Figure 6 match well in terms of overall shape and width, the peak from the separation employing the multi-emitter demonstrates a greater S/N. The effect of the emitter arrays on chromatographic S/N was further explored by examining a less abundant spiked peptide. The replicate EICs of Peptide 7 (Table 1), which gave a ∼10-fold lower signal than the peptide in Figure 6, are shown in Figure 7. A 0.5 Da mass window centered on the monoisotopic mass peak was used for obtaining the EICs to account for small shifts in observed m/z. Analysis of the S/N from 3 replicates indicate a nearly 7-fold enhancement. Both the greater signal intensities and the improved ESI stability39 of the multi-emitters likely contribute to the dramatically improved S/N.
Figure 7.
Extracted ion chromatograms of Peptide 7 (Table 2) from 3 replicate separations using (A) configuration 4 and (B) configuration 2. Scale bar in left panel of (A) equals 1 min and applies to all panels.
CONCLUSIONS
For the first time, we have demonstrated the efficient coupling of multi-emitter arrays with capillary LC separations for enhanced sensitivity. The separations showed no loss in peak shape or resolution relative to separations employing a single ESI emitter, due to the low dead volume of the emitters and their facile coupling to the LC column. A sensitivity enhancement averaging 11-fold was observed for peptides from spiked proteins in a tryptic digest of depleted human plasma. The dramatic sensitivity gains were made possible by the increased ionization efficiency of the multi-emitters, along with efficient transfer of ions into the mass spectrometer. A new heated multi-capillary inlet developed for this work proved ∼60% more efficient for ion transfer relative to our previous design.39 Chromatographic S/N improved nearly 7-fold with the use of multi-emitters, while the S/N gains for individual mass spectra were more modest due to chemical noise limitations. However, coupling the increased signal afforded by this approach with efficient spatial separation of singly charged species (using, e.g., IMS-TOF MS) should dramatically improve detection limits for multiply charged peptides, even when an analysis would otherwise be chemical noise-limited. Additionally, we expect that the multi-emitters will enable higher dynamic range LC-ESI-MS analyses by combining the greater sample loading capacity41 of larger capillary columns with the sensitivity that is typically only achieved with smaller i.d. columns operating in the nano-flow regime.
ACKNOWLEDGEMENTS
Portions of this research were supported by the U.S. Department of Energy (DOE) Office of Biological and Environmental Research, the NIH National Center for Research Resources (RR018522), the NIH National Cancer Institute (R21 CA126191), and the by a grant from the Entertainment Industry Foundation (EIF) and the EIF Women’s Cancer Research Fund to the Breast Cancer Biomarker Discovery Consortium. The Consortium is a collaborative group focused on breast cancer biomarker discovery and includes: Battelle-Pacific Northwest National Laboratory, Broad Institute of MIT and Harvard, Dana-Farber Cancer Institute, Fred Hutchinson Cancer Research Center, Institute for Systems Biology, MD Anderson Cancer Center, and USC/Norris Comprehensive Cancer Center. This research was performed in the Environmental Molecular Sciences Laboratory, a U.S. DOE national scientific user facility located at the Pacific Northwest National Laboratory (PNNL) in Richland, Washington. PNNL is a multiprogram national laboratory operated by Battelle for the DOE under Contract No. DE-AC05-76RLO 1830.
REFERENCES
- (1).Smith RD, Shen Y, Tang K. Accounts Chem. Res. 2004;37:269–278. doi: 10.1021/ar0301330. [DOI] [PubMed] [Google Scholar]
- (2).Manisali I, Chen DDY, Schneider BB. Trends Anal. Chem. 2006;25:243–256. [Google Scholar]
- (3).Smith RD, Loo JA, Edmonds CG, Barinaga CJ, Udseth HR. Anal. Chem. 1990;62:882–899. doi: 10.1021/ac00208a002. [DOI] [PubMed] [Google Scholar]
- (4).Kebarle P, Tang L. Anal. Chem. 1993;65:A972–A986. [Google Scholar]
- (5).Cech NB, Enke CG. Mass Spectrom. Rev. 2001;20:362–387. doi: 10.1002/mas.10008. [DOI] [PubMed] [Google Scholar]
- (6).Page JS, Kelly RT, Tang K, Smith RD. J. Am. Soc. Mass Spectrom. 2007 doi: 10.1016/j.jasms.2007.05.018. in press. [DOI] [PubMed] [Google Scholar]
- (7).Whitehouse CM, Dreyer RN, Yamashita M, Fenn JB. Anal. Chem. 1985;57:675–679. doi: 10.1021/ac00280a023. [DOI] [PubMed] [Google Scholar]
- (8).Zhou L, Yue B, Dearden DV, Lee ED, Rockwood AL, Lee ML. Anal. Chem. 2003;75:5978–5983. doi: 10.1021/ac020786e. [DOI] [PubMed] [Google Scholar]
- (9).Schneider BB, Douglas DJ, Chen DDY. Rapid Commun. Mass Spectrom. 2001;15:2168–2175. doi: 10.1002/rcm.221. [DOI] [PubMed] [Google Scholar]
- (10).Shaffer SA, Tang K, Anderson GA, Prior DC, Udseth HR, Smith RD. Rapid Commun. Mass Spectrom. 1997;11:1813–1817. [Google Scholar]
- (11).Shaffer SA, Tolmachev A, Prior DC, Anderson GA, Udseth HR, Smith RD. Anal. Chem. 1999;71:2957–2964. doi: 10.1021/ac990346w. [DOI] [PubMed] [Google Scholar]
- (12).Kim T, Udseth HR, Smith RD. Anal. Chem. 2000;72:5014–5019. doi: 10.1021/ac0003549. [DOI] [PubMed] [Google Scholar]
- (13).Lynn EC, Chung M-C, Han C-C. Rapid Commun. Mass Spectrom. 2000;14:2129–2134. doi: 10.1002/1097-0231(20001130)14:22<2129::AID-RCM144>3.0.CO;2-M. [DOI] [PubMed] [Google Scholar]
- (14).Julian RR, Mabbett SR, Jarrold MF. J. Am. Soc. Mass Spectrom. 2005;16:1708–1712. doi: 10.1016/j.jasms.2005.06.012. [DOI] [PubMed] [Google Scholar]
- (15).Page JS, Tolmachev AV, Tang K, Smith RD. J. Am. Soc. Mass Spectrom. 2006;17:586–592. doi: 10.1016/j.jasms.2005.12.013. [DOI] [PMC free article] [PubMed] [Google Scholar]
- (16).Ibrahim Y, Tang K, Tolmachev AV, Shvartsburg AA, Smith RD. J. Am. Soc. Mass Spectr. 2006;17:1299–1305. doi: 10.1016/j.jasms.2006.06.005. [DOI] [PMC free article] [PubMed] [Google Scholar]
- (17).Wilm MS, Mann M. Int. J. Mass Spectrom. Ion Processes. 1994;136:167–180. [Google Scholar]
- (18).Wilm M, Mann M. Anal. Chem. 1996;68:1–8. doi: 10.1021/ac9509519. [DOI] [PubMed] [Google Scholar]
- (19).Valaskovic GA, Kelleher NL, McLafferty FW. Science. 1996;273:1199–1202. doi: 10.1126/science.273.5279.1199. [DOI] [PubMed] [Google Scholar]
- (20).Bahr U, Pfenninger A, Karas M, Stahl B. Anal. Chem. 1997;69:4530–4535. doi: 10.1021/ac970624w. [DOI] [PubMed] [Google Scholar]
- (21).Karas M, Bahr U, Dülcks T. Fresenius J. Anal. Chem. 2000;366:669–676. doi: 10.1007/s002160051561. [DOI] [PubMed] [Google Scholar]
- (22).Schmidt A, Karas M, Dülcks T. J. Am. Soc. Mass Spectrom. 2003;14:492–500. doi: 10.1016/S1044-0305(03)00128-4. [DOI] [PubMed] [Google Scholar]
- (23).Valaskovic GA, Utley L, Lee MS, Wu J-T. Rapid Commun. Mass Spectrom. 2006;20:1087–1096. doi: 10.1002/rcm.2414. [DOI] [PubMed] [Google Scholar]
- (24).Lee SSH, Douma M, Koerner T, Oleschuk RD. Rapid Commun. Mass Spectrom. 2005;19:2671–2680. doi: 10.1002/rcm.2109. [DOI] [PubMed] [Google Scholar]
- (25).Kelly RT, Page JS, Luo Q, Moore RJ, Orton DJ, Tang K, Smith RD. Anal. Chem. 2006;78:7796–7801. doi: 10.1021/ac061133r. [DOI] [PMC free article] [PubMed] [Google Scholar]
- (26).Marginean I, Kelly RT, Page JS, Tang K, Smith RD. Anal. Chem. 2007 doi: 10.1021/ac0707986. submitted. [DOI] [PMC free article] [PubMed] [Google Scholar]
- (27).Shen Y, Zhao R, Berger SJ, Anderson GA, Rodrigues N, Smith RD. Anal. Chem. 2002;74:4235–4249. doi: 10.1021/ac0202280. [DOI] [PubMed] [Google Scholar]
- (28).Shen Y, Tolic N, Masselon C, Pasa-Tolic L, Camp DGI, Hixson KK, Zhao R, Anderson GA, Smith RD. Anal. Chem. 2004;76:144–154. doi: 10.1021/ac030096q. [DOI] [PubMed] [Google Scholar]
- (29).Luo Q, Shen Y, Hixson KK, Zhao R, Yang F, Moore RJ, Mottaz HM, Smith RD. Anal. Chem. 2005;77:5028–5035. doi: 10.1021/ac050454k. [DOI] [PubMed] [Google Scholar]
- (30).Yue G, Luo Q, Zhang J, Wu S-L, Karger BL. Anal. Chem. 2007;79:938–946. doi: 10.1021/ac061411m. [DOI] [PubMed] [Google Scholar]
- (31).Rulison AJ, Flagan RC. Rev. Sci. Instrum. 1993;64:683–686. [Google Scholar]
- (32).Almekinders JC, Jones C. J. Aerosol Sci. 1999;30:969–971. [Google Scholar]
- (33).Regele JD, Papac MJ, Rickard MJA, Dunn-Rankin D. J. Aerosol Sci. 2002;33:1471–1479. [Google Scholar]
- (34).Bocanegra R, Galán D, Márquez M, Loscertales IG, Barrero A. J. Aerosol Sci. 2005;36:1387–1399. [Google Scholar]
- (35).Duby M-H, Deng W, Kim K, Gomez T, Gomez A. J. Aerosol Sci. 2006;37:306–322. [Google Scholar]
- (36).Deng W, Klemic JF, Li X, Reed MA, Gomez A. J. Aerosol Sci. 2006;37:696–714. [Google Scholar]
- (37).Tang K, Lin Y, Matson DW, Kim T, Smith RD. Anal. Chem. 2001;73:1658–1663. doi: 10.1021/ac001191r. [DOI] [PubMed] [Google Scholar]
- (38).Kim W, Guo M, Yang P, Wang D. Anal. Chem. 2007;79:3703–3707. doi: 10.1021/ac070010j. [DOI] [PubMed] [Google Scholar]
- (39).Kelly RT, Page JS, Tang K, Smith RD. Anal. Chem. 2007;79:4192–4198. doi: 10.1021/ac062417e. [DOI] [PubMed] [Google Scholar]
- (40).Liu T, Qian W-J, Mottaz HM, Gritsenko MA, Norbeck AD, Moore RJ, Purvine SO, Camp DG, Smith RD. Mol. Cell. Proteomics. 2006;5:2167–2174. doi: 10.1074/mcp.T600039-MCP200. [DOI] [PMC free article] [PubMed] [Google Scholar]
- (41).Shen Y, Zhao R, Belov ME, Conrads TP, Anderson GA, Tang K, Paša-Tolić L, Veenstra TD, Lipton MS, Udseth HR, Smith RD. Anal. Chem. 2001;73:1766–1775. doi: 10.1021/ac0011336. [DOI] [PubMed] [Google Scholar]
- (42).Kast J, Gentzel M, Wilm M, Richardson K. J. Am. Soc. Mass Spectrom. 2003;14:766–776. doi: 10.1016/S1044-0305(03)00264-2. [DOI] [PubMed] [Google Scholar]
- (43).Valentine SJ, Counterman AE, Hoaglund CS, Reilly JP, Clemmer DE. J. Am. Soc. Mass Spectrom. 1998;9:1213–1216. doi: 10.1016/S1044-0305(98)00101-9. [DOI] [PubMed] [Google Scholar]


