

Abstract
Cardiac dyssynchrony in the left ventricles of murine hearts late (>= 28 days) after reperfused myocardial infarction (post-MI) was assessed using high frequency 30 MHz B-mode ultrasound imaging. Nine post-MI and six normal C57Bl/6 mice were studied in both short- and long-axis views. Regional time to peak displacement (Tpeak_d) and time to peak strain (Tpeak_s) were calculated in 36 sectors along the myocardial circumference; then their standard deviations (SD_Tpeak_d and SD_Tpeak_s) were computed among non-infarcted myocardial regions for each mouse, and were compared between the normal and post-MI mouse groups with Student’s t test. The comparison revealed that SD_Tpeak_d and SD_Tpeak_s were significantly larger in the post-MI hearts than in the normal hearts. The displacement uniformity ratio was determined to be 0.97±0.01 and 0.85±0.07 for radial and circumferential displacements in the normal hearts, respectively; and 0.59±0.17 and 0.64±0.24 in the post-MI hearts. In conclusion, this high resolution ultrasound image tracking method provides for the detection of cardiac dyssynchrony in the non-infarcted regions in the murine left ventricles late after MI by identifying the temporal and spatial disparity of regional myocardial contraction.
Keywords: myocardial infarction, cardiac dyssynchrony, contractile dysfunction, regional left ventricular function, high resolution ultrasound
INTRODUCTION
Left ventricular (LV) dyssynchrony has been shown to have deleterious effects on cardiac function resulting in contractile inefficiency, diminished stroke volume, and ultimately, increased morbidity and mortality (Grines 1989; Luliano 2002; Spragg 2006). Cardiac resynchronization therapy (CRT) has been increasingly employed in patients with moderate or severe heart failure involving ventricular dyssynchrony in order to improve cardiac structure and function, and to reduce morbidity and mortality (Auricchio 2004). Despite the numerous documented benefits of CRT, approximately 20–30% of patients do not demonstrate symptomatic improvement (Kass 2003).
Electrical surrogate measurements, such as QRS complex duration, are traditionally used as markers to identify myocardial dyssynchrony, but QRS duration provides no information about the regional dynamics of myocardial contraction. Moreover, electrical dyssynchrony is not necessarily related to mechanical dyssynchrony (Bank 2006; Bleeker 2006). Therefore, methods that directly assess LV mechanical dyssynchrony are required to describe the timing of cardiac motion. In recent years, Magnetic Resonance Imaging (MRI) based acquisition and analysis methods have been extensively studied to assess contractile function in patients with LV dyssynchrony (Curry 2000; Lardo 2005). However, although MRI provides excellent spatial and contrast resolution, its relatively slow data acquisition rates, in addition to its high cost (both in terms of capital outlay and operating expense), have limited its widespread application in LV dyssynchrony research.
As an alternative to relatively costly and time-consuming MRI-based methods to assess cardiac function, various echocardiographic approaches have been employed to detect LV dyssynchrony. M-mode echocardiography is typically used to examine the time delay between peak inward septal and posterior wall movement (Pitzalis 2005). Clearly, M-mode imaging is limited by virtue of the fact that it only analyzes two infinitesimally short wall segments and does not encompass the entire LV wall. Tissue Doppler Imaging (TDI) has been shown to be a useful tool for the characterization of myocardial velocities and strain in both research and clinical environments (Sutherland 1994; D’hooge 2000; Bax 2004; Sebag 2005). TDI has also been employed to assess cardiac function in mice (D’hooge 2004). Echocardiography-based myocardial strain imaging and strain rate imaging, which measure myocardial deformation and velocity of myocardial deformation, have also been used as alternatives to TDI to assess myocardial contractile function (Fleming 1994; Pislaru 2001; Kukulski 2002). Although these imaging methods play a notable role in diagnosis of myocardial motion abnormalities, several limitations still remain. Firstly, as Doppler-based techniques, these methods rely on one dimensional signal processing, and consequently the detected motion is essentially one isolated component of the complex 3D motion that myocardium undergoes. Additionally, as with other Doppler-based techniques, a cosine θ error arises whenever there is an angle between ultrasound beam axis and the axis along which motion is occurring. For this reason, Doppler-based methods are practically limited to a few acquisition orientations and are primarily used only in parasternal long-axis views (Helm 2005). Radio-frequency (RF) data based speckle tracking methods have also been employed myocardial motion estimation in mice and large animals. These methods possess high spatial resolution and are able to detect transmural strain gradients (D’hooge 2006) in large animals such as sheep. Moreover, when using electrocardiogram gated retrospective data acquisition, which yields high temporal resolution up to 8000 frames/s (Luo 2007; Pernot 2007), these methods are able to distinguish infarcts from normal tissue in post-MI mouse hearts, and to detect electromechanical wave propagation in mouse cardiovascular tissue (Pernot 2007). However, RF based methods require a high acquisition rate to avoid aliasing, and thus increases the hardware and software requirements.
Myocardial motion analysis using B-mode ultrasound image sequences can avoid the shortcomings of one-dimensionality and angle-dependency. Conventional visual assessment of systolic endocardial motion (e.g., wall scoring, and myocardial performance index) using B-mode images is subjective and, at best, semi-quantitative (Zhang 2006). Additionally, the image acquisition rate typically used in clinical echocardiography is relatively low, making it difficult to capture rapid transient myocardial motion (Kvitting 1999). However, state-of-the-art high frequency B-mode ultrasound imaging, optimized for visualizing the living mouse heart, is able to provide sufficiently high temporal resolution and fine spatial resolution for the assessment of cardiac structure and function in mice (Foster 2002). Our laboratory recently developed a speckle tracking algorithm for mouse myocardial motion analysis using high frequency ultrasound, and demonstrated its feasibility to assess cardiac contractile abnormalities in mice (Li 2007).
Overall myocardial contractile function is highly complex and involves multiple interconnected variables including those derived from regional myocardial displacement (e.g., strain and strain rate) and relative synchrony of contraction. A number of indices have been used in cardiac MRI and ultrasound imaging in order to quantify the degree of dyssynchrony. The regional variance of strain, determined from the variance of strain magnitude obtained from various myocardial segments, is commonly used in TDI- and MRI-based dyssynchrony imaging (Yu 2002; Helm 2005; Lardo 2005). The regional variance vector of principal strain was recently developed as an improved alternative to the regional variance of strain, in that it takes into account not only the time disparity but also the spatial distribution of the regional strains that contribute to the overall mechanical deficiency (Helm 2005). The circumferential uniform ratio estimation (“CURE”) was also developed as a mechanical dyssynchrony index based on the ratio of the synchronous component to the sum of synchronous and dyssynchronous components of the circumferential strain (Leclercq 2002). The standard deviation of the time to peak velocity for the 12 segments has been used to determine dyssynchrony in patient studies (Yu 2002). All these previous measures of dyssynchrony were defined using all myocardial segments including the infarcted region. This approach is particularly useful early after MI, where dyssynchrony analysis will detect infarcted myocardium and was recently used to predict LV remodeling (Mollema 2007). However, in the setting of chronic transmural infarction, the thinned infarct scar is readily identified by echocardiography and is essentially devoid of functional cardiomyocytes. Without the capacity to participate in active contraction, the thinned infarct scar will obviously be dyssynchronous. From the standpoint of pathophysiology, it is the dyssynchrony that develops in the non-infarcted myocardium late after MI that bears considerable interest as a potential therapeutic target. Accordingly, in the current study, we chose to exclude the infarct scar from our analysis of dyssynchrony in order to focus specifically on the non-infarcted left ventricle. The results demonstrate, for the first time, the presence of dyssynchrony in the non-infarcted murine left ventricle late after myocardial infarction.
In cardiovascular research, accurate animal models of human diseases are critical. In particular, animal models are essential for assessing the efficacy of novel treatment regimens including those for treating myocardial infarction and heart failure (Degabriele 2004). Modern cardiovascular research makes extensive use of the mouse species as an animal model of human cardiovascular disease. The mouse is preferred due to its low cost, high level of genetic characterization and short gestation period. By carefully characterizing the anatomy, physiology and progression of disease in mutant mice (i.e., transgenics and knock-outs), researchers can expand their understanding of the role that individual genes play in cardiovascular disease (Carmeliet 1998).
In this paper, we present the assessment of regional LV wall motion abnormality and dyssynchrony in mice at high spatial and temporal resolution using an ultrasound image tracking method (Li 2007). We use the standard deviations of regional peak-displacement time and peak-strain time as indices to quantify the degree of cardiac dyssynchrony in normal and post-MI mouse hearts. The displacement uniformity ratio was also calculated at end-stole as a measure of the spatial disparity of regional myocardial displacement.
MATERIALS AND METHODS
Mouse Preparation
This study conformed to and was conducted under protocols approved by the University of Virginia Animal Care and Use Committee. Male C57Bl/6 mice (14–24 weeks old, body weight 21–28 g) purchased from Jackson Laboratories (Bar Harbor, ME) were used in this study. A mouse model of reperfused MI was used, which approximates the contemporary clinical situation in which the majority of thrombosed coronary arteries are ultimately re-canalized or bypassed. MI was induced by a one-hour occlusion of the left anterior descending (LAD) coronary artery followed by reperfusion, as described previously (Yang 2002). The post-MI mice were then housed for 4–14 weeks before imaging in order to insure that LV remodeling was essentially complete (Ross 2002). The 1 hour occlusion of the LAD induces reproducible, transmural infarction in the apex and anterolateral walls of the LV. In addition to mice with MI, normal C57Bl/6 mice were also used in the study as non-infarcted controls.
During ultrasound scanning, the mouse was carefully maintained under light anesthesia by using an inhaled mixture of 1% isoflurane gas and atmospheric air. The mouse was placed supine on an electrical heating pad and a tensor lamp was used to provide additional heat. The mouse core body temperature was monitored with a rectal temperature probe coupled to a digital thermometer and was maintained at 37.0 ±0.2°C so as to minimize heart rate variation throughout the procedure. ECG signals were obtained by contacting the mouse limbs, coupled with electrically conductive gel, to ECG electrodes integrated into the heating pad. The chest area was depilated to improve contact with the ultrasound transducer. A centrifuge was used to remove bubbles from the ultrasound gel prior to imaging. The ultrasound gel was then warmed to body temperature and applied to the chest area carefully to avoid the formation of air bubbles. Care was taken not to apply excess pressure onto the chest during scanning in order to avoid heart deformation.
Image Acquisitions
Ultrasound B-mode cardiac image sequences were acquired from mice using a VisualSonics Vevo770 high resolution ultrasound scanner (VisualSonics Inc., Toronto, Ontario, Canada) operating at 30 MHz, possessing a −6dB fractional bandwidth of approximately 50%. The operating conditions used in our studies resulted in approximately 55 μm −6 dB axial resolution and 115 μm −6 dB lateral resolution. Short-axis images were collected at the mid-ventricular level, with the right ventricle (RV) oriented to the left side of the field of view (FOV), and the papillary muscles on the right side. The long-axis view was obtained by rotating the transducer by 90 degrees about its central axis with respect to its original position used for short-axis acquisition. The FOV was adjusted to maximize the display resolution of the region of interest (ROI). In these acquisitions, the short-axis FOV was approximately 7 × 7 mm, and the long-axis FOV was approximately 12 × 12 mm. Image intensity was increased sufficiently to illuminate the myocardium in order to improve the signal to noise ratio (SNR) in the myocardium. Image sequences composed of over 100 image frames per cardiac cycle were obtained by using the “ECG (Electrocardiogram)-based Kilohertz Visualization (EKV)” capability of the Vevo770 scanner that retrospectively assembles image data acquired from multiple cardiac cycles into a representative cardiac cycle (Cherin 2006). Individual A-line captures that possessed significant deviation from the average (corrupted by respiratory motion, for example) are excluded from the reconstruction (VisualSonics 2007). The time necessary to collect a complete EKV image sequence was 2–3 minutes for a short-axis slice, and 3–4 minutes for a long-axis slice. The total ultrasound imaging session duration was under 30 minutes per mouse. The acquired image sequences were then transferred to a PC for offline processing.
Myocardial Motion Tracking
We used the motion tracking method we recently developed (Li 2007) to analyze the mouse myocardial contractile function. Briefly, the LV was manually contoured on the first frame (closely approximates end-diastole) of each EKV image sequence. The myocardial region was automatically populated with 2D pixel blocks for tissue tracking. A tracking pixel block size of approximately 0.24 × 0.24 mm was used. This corresponds to a 16 × 16 pixel block where each pixel is 15 × 15 μm. Incremental displacement of myocardial tissue was estimated by image sub-block matching using the Minimum Sum of Absolute Differences (MSAD) criterion (Friemel 1995). Because MSAD uses differences between data sets, MSAD-based tracking is susceptible to degradation at low image SNR (SNR less than 0 dB) (Friemel 1995). However, MSAD yields performance similar to that obtained using more complex match criteria such as cross-correlation for images with adequate SNR. Moreover, the computational complexity of MSAD is significantly lower than that of other match criteria, and thus MSAD is preferable in applications where image processing speed is critical. A parabolic interpolation was performed following the MSAD search to achieve subpixel tracking resolution. Parabolic fitting was used because it provides a computationally efficient method for curve fitting to SAD values associated with the minimum SAD and its immediate neighbors.
The motion tracking accuracy in this study is limited primarily by image noise. In order to restrain the influence of erroneous estimates due to image noise, a tracking quality map was used as a weighting function, which places higher weights on “high quality” estimates and lower weights on “low quality” estimates. In the process of finding the optimal displacement vector, the MSAD value, normalized to the mean SAD value averaged over the search range, is indicative of the block decorrelation between the matched image blocks in successive frames. Thus, a measure of tracking quality was used that was defined as the inverse of the normalized the MSAD value, as shown in Eqn (1):
| (1) |
where (m, n) is the center of the pixel block under investigation, Δx and Δy are the half search range in x and y directions (search range were set to be the same in both negative or positive directions), mean(SAD(m±Δx, n±Δy)) is the mean of SAD values averaged within the search range, and MSAD_value(m, n) is the minimal SAD value for this block matching. The accuracy of in vitro displacement tracking was tested on an acrylamide gel phantom, and 2σ error was approximately 2.6% axially and 5.1% laterally, consistent with the result reported by our laboratory previously (Li 2007). An in vivo determination of displacement error was not attempted due to the difficulty of obtaining an appropriate set of reference values. Therefore, for the in vivo accuracy, we estimated the fractional error resulting using net pixel block displacement through the cardiac cycle (i.e. ideally zero) divided by the distance traversed by a pixel block.
Myocardial tissue displacement was estimated between each pair of subsequent image frames in the image sequence along an entire cardiac cycle. The frame-to-frame displacement at each cardiac phase is a 2D matrix of displacement vectors (X and Y components), presented on an X-Y orthogonal grid in which each intersection is the center of an aforementioned 2D pixel block. After each frame-to-frame displacement estimation, the center of the pixel block was updated (to integer pixel resolution) to constrain them so as track an approximately common tissue sub-region through the cardiac cycle. It should be noted that the image region underlying a particular pixel block may not be identical through the cardiac cycle because of: 1) omission of sub-pixel displacement in block location updating, 2) small errors in tracking accuracy, and 3) speckle decorrelation. However, we have observed that integer pixel-resolution updating of the block location did produce a noticeable improvements in tissue motion tracking. The cumulative error was decreased by 21.7±11.5% (7.58% with updating versus 9.22% without updating) when applying block location update in comparison to not updating block locations. Thereafter, a 3 × 3 low-pass filter was applied to the displacement map for each frame, and a 1 × 5 median filter was applied along the time course of the motion trajectory for each tracking element, as described previously (Li 2007).
The myocardial strain tensor was computed from the displacement vectors as previously reported by our laboratory (Li 2007). The radial and circumferential strains were derived in the short-axis view images by vector projection relative to the epicardial centroid that was updated in each time frame (i.e. “floating centroid” locations rather than a fixed location throughout the cardiac cycle). This floating epicardial centroid method is consistent with methods previously reported in literature (Zoghbi 1988; Schmermund 1998). Additionally, in this study, the epicardial centroid approximately coincides with the endocardial center, since the papillary muscles were excluded during LV segmentation. In the long-axis view, the radial strain was defined as the component perpendicular to the local LV endocardial border.
Regional Motion Analysis
The displacement and strain were evaluated on a regional basis in order to assess changes in regional contractile function at various locations in the LV myocardium in response to MI. The mid-ventricular LV was segmented using standardized six-sector models (Cerqueira 2002), as illustrated in Fig. 1, in the short-axis view (A) and long-axis view (B), respectively.
Fig. 1.

Standard six-sector LV myocardial segmentations in the mid-ventricular short-axis view (A) and the long-axis view (B). In (A): 1, LV cavity; 2, right ventricle cavity; 3, papillary muscles; RV, right ventricle; A, anterior; AL, anterolateral; AS, anterior septum; P, posterior; PL, posterolateral; PS, posterior septum. In (B): 1, LV cavity; 2, right atrium cavity; b-, basal; m-, mid-ventricular; a-, apex; -Ant, anterior; and -Pst, posterior.
The regional displacements were calculated at each cardiac phase as the quality map weighted mean displacement among each myocardial segment. Thereafter a color-coded anatomic M-mode displacement map was constructed corresponding to the outline set along a 36-sector segmentation of the LV myocardium, which was obtained by further dividing each of the 6 sectors into 6 sub-sectors. The color-coded anatomic M-mode regional radial strain map was also constructed along the 36 sectors of myocardium.
Among the 9 post-MI mouse hearts imaged in this study, the short-axis image datasets of 2 mice were partially corrupted by rib shadowing in the septal wall region. In order to minimize the effect of the rib artifacts in these 2 mice, we excluded the tracking results from the affected septal wall segments (<25% of the LV circumference in these 2 cases) and interpolated values using adjacent LV regions free of shadowing.
Dyssynchrony Assessment
In order to assess contractile dyssynchrony in the LV myocardium, regional time to peak displacement (Tpeak_d) and regional time to peak radial strain (Tpeak_s) were measured in normal regions and in regions not severely affected by infarction. The radial strain was chosen for the assessment of strain dyssynchrony because, when compared circumferential and longitudinal strains, radial strain is the most significant in terms of its impact on wall thickening. In light of the fact that transmurally infarcted regions composed of scar tissue are incapable of synchronous contraction, we excluded the infarcted regions from the analysis of dyssynchrony. For the purposes of this study, fully infarcted regions were defined as myocardial segments with peak displacement lower than 1/3 of the average peak displacement determined from all myocardial segments. A region-Tpeak_d curve was then computed to describe the peak-displacement time as a function sector region (exclusive of the infarcted region) around the myocardial circumference, thus to reveal LV contractile dyssynchrony. A piece-wise second-order polynomial function was used to fit the region-Tpeak_d curve. Similarly, the region-Tpeak_s curve was calcuated in an analogous method.
The standard deviations of the regional Tpeak_d (SD_Tpeak_d) and Tpeak_s (SD_Tpeak_s) are measures of disparity in timing of the regional myocardial motion, and were used as cardiac dyssynchrony indices. The SD_Tpeak_d and SD_Tpeak_s were calculated for each mouse heart in both the short- and long-axis views. Thereafter, the mean and standard deviation of these two indices were computed among the normal and post-MI mouse groups, and compared between these two groups.
Cardiac dyssynchrony was also manifested in the post-MI non-uniform spatial distribution of regional displacement in the myocardium around the LV circumference. A displacement uniformity ratio, a modification of the “CURE” index developed for cardiac MRI studies (Leclercq 2002), was used to measure the spatial uniformity of the myocardial displacement. The radial and circumferential displacements of the 36 sectors around the short-axis circumference at the end-systolic phase (approximately when the LV is most contracted) were subjected to Fourier decomposition. The displacement uniformity ratio was then computed using the following formula (Leclercq 2002):
| (2) |
where A02 and A12 are the 0th and 1st order power terms (squared amplitude of Fourier transform) at end-systole summed over all myocardial sectors, respectively. A high uniformity ratio (1 at maximum), indicates synchronous LV contraction; whereas a low uniformity ratio (0 at minimum) implies dyssynchronous contraction.
Statistical Analysis
All data are presented as mean ± SD. An unpaired, one-sided Student’s t test was used for post hoc comparison of the measurements between the normal and post-MI mouse hearts. SD_Tpeak_d, SD_Tpeak_s and displacement uniformity ratios were all subjected to the Student’s t test. A value of P<0.05 was considered significant.
RESULTS
Regional wall motion analysis was performed on 9 mice late (>=28 days) after MI to assess cardiac contractile dysfunction and dyssynchrony. Six normal mice were also analyzed as controls. The regional wall motion analysis of a normal mouse heart in the short-axis view is illustrated in Fig. 2. Figure 2A is a map of displacement vectors superimposed on the original ultrasound image, allowing each displacement vector to be visually compared with the underlying image data. Nearly uniform magnitudes of displacement are observed around the LV circumference in the normal mouse heart, as shown in Fig. 2B. Additionally, Tpeak_d occurs nearly simultaneously in all myocardial segments around the LV circumference in this mouse. An anatomic M-mode regional displacement map corresponding to the outline set of the 36 myocardial segments, color-coded to the displacement magnitude, is illustrated in Fig. 2C. The horizontal axis represents time and vertical axis represents the unfolded LV circumference. The regional displacement map was color-coded according to the magnitude of the displacement: positive values (moving towards the center with respect to the original position) were color-coded in yellow to orange, zero (neutral) in cyan, and negative values (moving away from the center with respect to the original position) in dark blue. The blue dashed line in the center indicates Tpeak_d of the myocardial segments. Similarly, an M-mode regional radial strain map was constructed and Tpeak_s was calculated among the myocardial segments, as shown in Fig. 2D. The relatively straight, vertical, Tpeak_d and Tpeak_s lines in C and D indicate synchronous displacements and strain around the LV circumference.
Fig. 2.
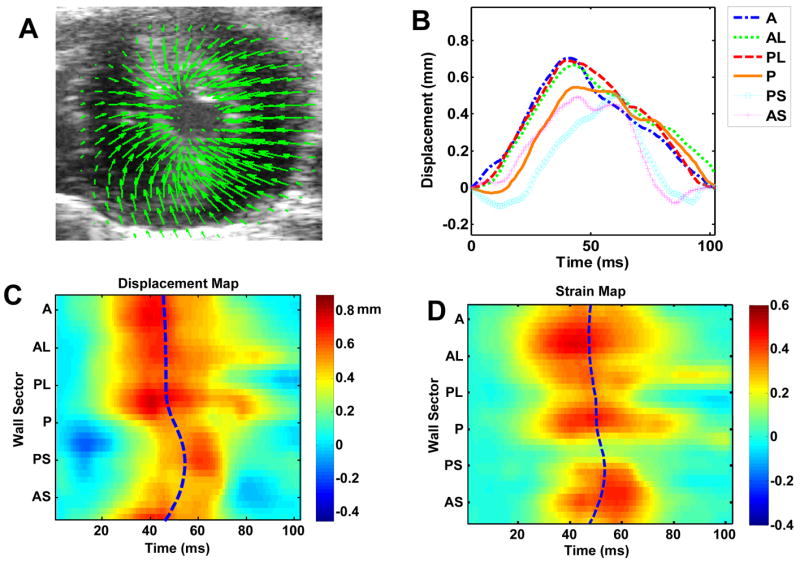
Regional LV displacement and strain analysis of a normal mouse heart in short-axis view. (A), myocardial displacement at end-systole; (B), regional time-displacement curves in the 6-segment LV myocardium; (C), M-mode regional time-displacement map of the more finely divided 36-segment LV myocardium, theblue dash line indicating Tpeak_d in all segments; and (D), M-mode regional time-radial strain map, the blue dash line indicating Tpeak_s in all segments. In (C) and (D), the horizontal axis represents time and vertical axis represents the unfolded LV circumference; positive values (contraction) was color-coded in yellow to orange, zero (neutral) in cyan, and negative values (relaxation) in blue.
Figure 3 illustrates the regional wall motion analysis in the long-axis view of a normal mouse heart. Similar to the analysis in the short-axis view shown in Fig. 2, relatively uniform magnitude and essentially simultaneous timing are observed in the wall motion analysis of the long-axis view. Similar to Figs. 2C and 2D, relatively straight Tpeak_d and Tpeak_s lines are also observed in Figs. 3C and 3D.
Fig. 3.

Regional LV displacement and strain analysis of a normal mouse heart in long-axis view. Figures (A), (B), (C) and (D) are in the same format as in Fig. 2.
Regional wall motion analysis of the post-MI mouse hearts revealed significant contractile dysfunction and dyssynchrony. In the short-axis view, almost no displacement or strain can be observed in the anterolateral wall, which was most severely affected by infarction. Reduced displacement and strain are also evident in the adjacent areas. Similarly, in the long-axis view of the post-MI mouse hearts, the apical region exhibited almost no displacement or strain, indicating that contractile function in the apical myocardium was severely degraded. The severely affected zone was segmented from other myocardial sectors using the peak displacement threshold described in the “Methods” section, and was excluded when determining Tpeak_d and Tpeak_s. Analysis of the time evolution of regional myocardial displacement and strain revealed dyssynchronous contraction among the LV myocardial segments. The peak displacement (i.e., peak contraction) occurred first in regions remote to the infarct zone, then a “wave” of displacement propagated towards the regions adjacent to the infarct zone. As a result, the Tpeak_d in adjacent regions was delayed relative to the remote regions. The infarct zone exhibited no consistently measurable peak displacement. The delay of Tpeak_d in segments adjacent to the infarct zone compared to the remote segments was found to be approximately 10–20 ms in both short-axis and long-axis views in mouse hearts with large myocardial infarcts. Similar delays were identified during analysis of the time evolution of regional myocardial strains. Figures 4 and 5 illustrate the regional wall motion analysis in post-MI mouse hearts. The curved Tpeak_d and Tpeak_s lines in C and D indicate contractile dyssynchrony in both the myocardial displacement and strain.
Fig. 4.
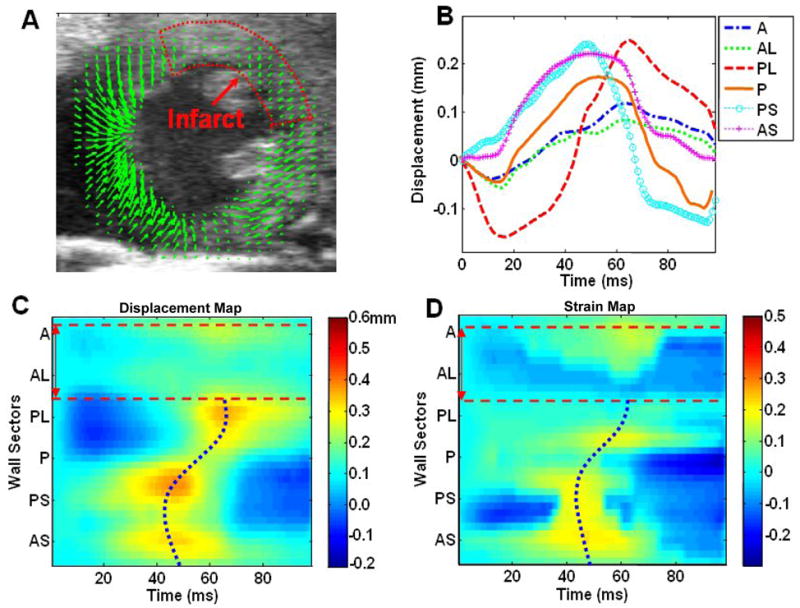
Regional LV displacement and strain analysis of a post-MI mouse heart in short-axis view. Figures (A), (B), (C) and (D) are in a similar format as in Fig. 2. The anterolateral wall was severely affected by infarction, as indicated by the low displacement magnitude. The infarct region is circled with a dotted line in (A), and is identified with dashed red lines in (C) and (D). The Tpeak_d and Tpeak_s were determined in myocardial segments exclusive of the infarct region and are portrayed as dotted blue lines. The Tpeak_d and Tpeak_s lines were distinctively curved in post-MI mouse hearts, indicating dyssynchronous myocardial motion.
Fig. 5.
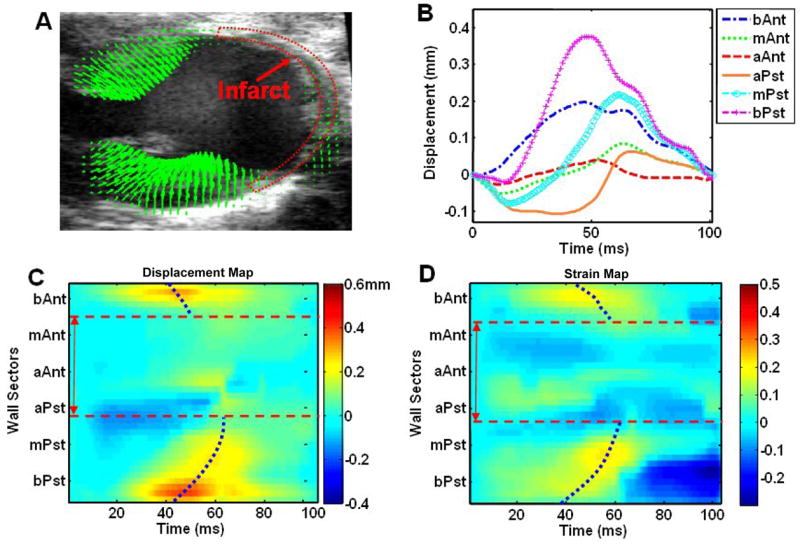
Regional LV displacement and strain analysis of a post-MI mouse heart in the long-axis view. Figures (A), (B), (C) and (D) are in a similar format as in Fig. 2. The apical wall was severely affected by infarct, as indicated by the low displacement magnitude, and the infarct region is labeled using dotted red lines as in (A). Tpeak_d and Tpeak_s were determined in the myocardial segments exclusive of the infarct region.
The dyssynchronous contraction observed in post-MI mice was more vividly illustrated by color-coding and superimposing the displacement vectors on the LV myocardium in the cine image set portraying a single cardiac cycle. This enables immediate visual identification of regions afflicted by relative delays in contraction. Figures 6A and 6B are individual frames from a ciné of displacement maps tracked through a cardiac cycle in a post-MI mouse heart in the short-axis view. Dyssynchronous contraction between the septal wall and the lateral wall is evident in these figures – the peak-displacement (longer red arrows) time was delayed in the lateral wall (affected by infarction) by 25 ms comparing to the septal wall. Figures 6C and 6D are individual displacement maps from another post-MI mouse heart in the long-axis. These two figures illustrate contractile dyssynchrony with a wave of peak displacement progressing from the mid-ventricular to apical aspects of the posterior LV wall (large white arrows). Also, notice that the infarct and border zones in the anterior and apical LV exhibit significant contractile dysfunction (as indicated by short blue arrows - many of which appear as dots). The deficit in contractile function found in the infarct and border zones, combined with the dyssynchronous contraction observed in the remaining viable, non-infarcted myocardium decreases the overall efficiency of cardiac pump function and contributes importantly to heart failure.
Fig. 6.
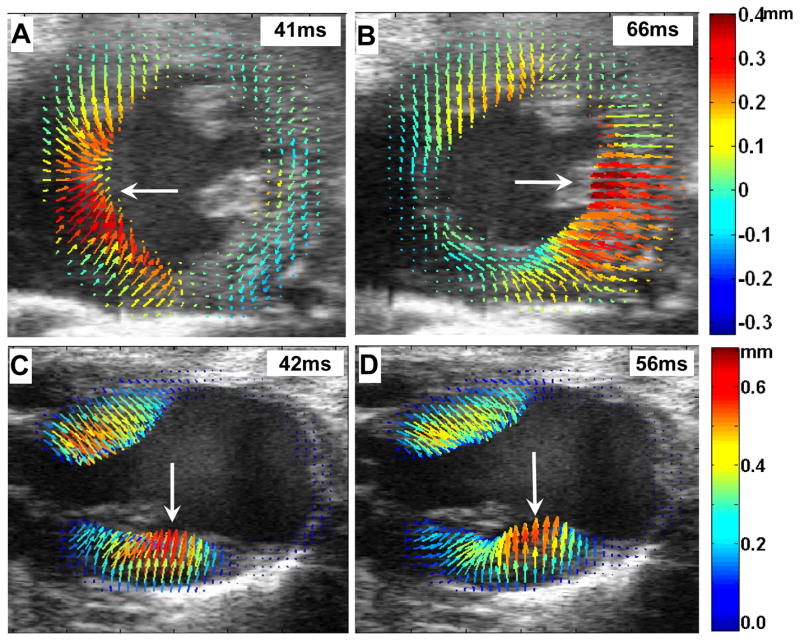
Dyssynchronous myocardial contraction in the post-MI mouse heart. The short-axis view (A and B), and the long-axis view (C and D) are shown. Myocardial displacements were rendered as arrows color-coded according to the magnitude of displacement. The large white arrows indicate the progression of peak displacement (the red arrows) from the septal wall to the lateral wall in the short-axis view, and from the mid-ventricular to apical aspects of the posterior LV wall in the long-axis view.
The SD_Tpeak_d and SD_Tpeak_s were calculated for each mouse heart in both the short- and the long-axis views. Table 1 presents the mean and standard deviation of these two indices for the normal mouse group and the post-MI mouse group. An unpaired Student’s t test was performed to compare the SD_Tpeak_d and SD_Tpeak_s between the normal and post-MI groups. The comparison showed that the difference between the two groups was statistically significant (P<0.05) for both the SD_Tpeak_d and SD_Tpeak_s in both the short- and long-axis views.
TABLE 1.
Statistics of SD_Tpeak_d and SD_Tpeak_s
| Nml SA | MI SA | Nml LA | MI LA | |
|---|---|---|---|---|
| SD_Tpeak_d (ms) | 3.54±1.24 | 6.08±2.67* | 3.95±1.43 | 7.91±2.87* |
| SD_Tpeak_s(ms) | 2.96±1.33 | 6.97±3.07* | 4.26±1.90 | 8.08±2.76* |
| Sample size | N = 6 | N = 9 | N = 6 | N = 9 |
P<0.05 vs. corresponding view in normal mice.
Nml=normal; MI=post-MI; SA=short axis view, and LA=long axis view.
The displacement uniformity ratio was calculated over the entire LV myocardium (including infarcted regions) for the radial and circumferential displacements in normal and post-MI mouse hearts using Eqn 2. The uniformity ratio was 0.97±0.01 and 0.85±0.07 for the radial and circumferential displacements in normal hearts (N = 6), and 0.59±0.17 and 0.64 ±0.24 for radial and circumferential displacements, respectively, in post-MI mouse hearts (N = 9). Therefore, the displacement uniformity ratios also revealed less synchrony in myocardial motion after MI, consistent with the previous dyssynchrony assessment. The result of the Student’s t test indicate that the difference between the normal and post-MI groups was significant (P<0.05) for both the radial and circumferential displacements.
Plotting the motion trajectory of tissue elements through a cardiac cycle, as illustrated in Fig. 7, provides for a detailed analysis of cardiac motion. In each trajectory shown in Fig. 7, the blue dots denote the position of the tissue elements at the time the EKV loop was initiated (i.e., end diastole). Alternating green and red segments represent successive incremental displacements over equal time periods (5 ms for each segment in this case). The alternating color arrangement provides an indication of instantaneous velocity: longer segments indicate faster instantaneous velocity, while shorter segments indicate slower velocity. The normal myocardial motion trajectories reflect coordinated, smooth cycles of contraction and relaxation throughout the entire LV (Figs. 7A and 7B). In contrast, the trajectories in the post-MI mouse heart (Figs. 7C and 7D) exhibit lower displacement magnitudes and convoluted trajectory paths that vary in shape among different regions in the LV.
Fig. 7.
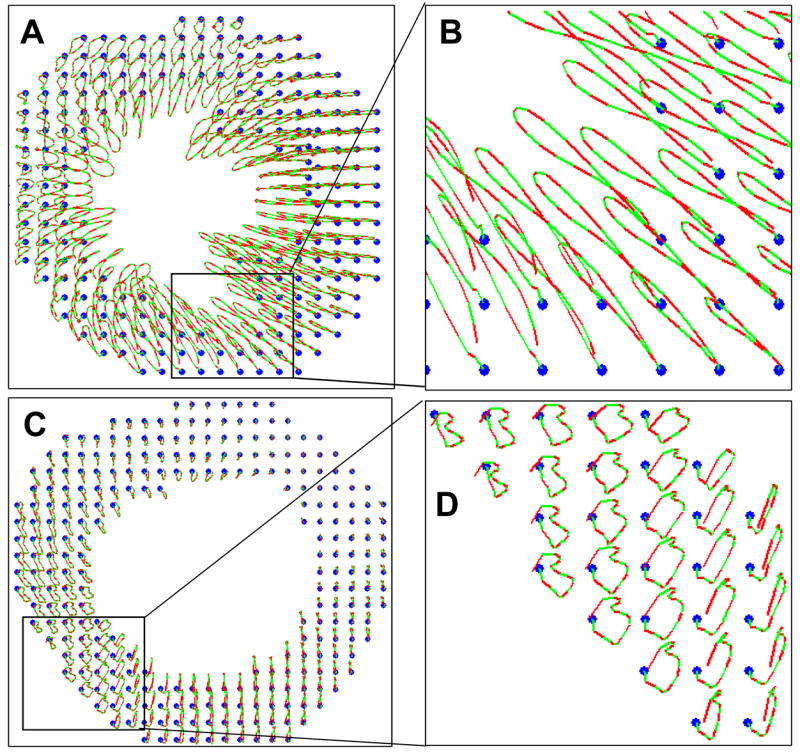
Trajectories of myocardial tissue elements through the cardiac cycle in a normal mouse heart (A and B) and a post-MI heart (C and D). Panels (B) and (D) are enlargements of the areas indicated by boxes in Panels (A) and (C), respectively. The blue dots denote the position of the tissue elements at the time the EKG loop was initiated. Alternating red and green segments within each trajectory indicate instantaneous velocities by displaying successive incremental displacements over equivalent time period.
The motion trajectories also provide a form of quality control by taking advantage of the fact that each trajectory should return to its starting point at the end of the cardiac cycle, thus forming a closed loop. This assumes that there is no motion external to the heart. This assumption is approximately valid here since the EKV function on the Vevo 770 screens out all frames affected by respiratory excursion. Even under ideal conditions, a tracked region in the last image frame may not exactly return to its location in the first frame due to the constraints imposed by EKV analysis, which truncates a small fraction of the cardiac cycle. In order to compensate for this truncation, we repeated the first frame after the last one to make the image sequence approximate a complete cycle. However, there are additional factors that contribute to tracking error. For example, we used 2D image tracking method whereas the heart undergoes complex 3D motion. Our current tracking method does not track out-of-plane motion, so any out-of-plane motion results in speckle decorrelation that degrades 2D tracking within the image plane (Ha 2005). Image noise and uncorrected motion artifacts are also sources of tracking error. Nonetheless, at least in the case of electronic noise, errors are random between frames and their overall effect over 100 time frames is relatively insignificant in comparison to the total tracked path. The net displacement (d) through a cardiac cycle divided by the total length of the traveled path (l) along the cardiac cycle can be used as an approximate metric to estimate cumulative tracking error. The mean error was approximately 7.5±2%, and the maximum cumulative tracking error (d/l) was approximately 21±5%.
DISCUSSION
High spatial and temporal resolution characterization of cardiac dynamics and dyssynchronous contractile function in mice is of significant interest in cardiovascular research. The high frequency ultrasound imaging we used in this work provided sufficient temporal and spatial resolution to discern the timing of mouse myocardial contraction on a regional basis, and thus enabled us to investigate cardiac dysfunction and dyssynchrony in post-MI mice. This level of temporal resolution in mouse cardiac imaging and cardiac motion analysis has surpassed what can be obtained by other imaging modalities (e.g. MR imaging). Therefore, this method provided a unique capability that brings additional insight to the functional and structural response in the mouse heart late after MI.
We calculated the regional heart wall displacement in 36 sectors along the myocardium at over 100 time frames within one mouse cardiac cycle, and then derived, within non-infarcted sectors, the standard deviations of regional time to peak displacement (SD_Tpeak_d) and regional time to peak strain (SD_Tpeak_s) to index the severity of contractile dyssynchrony. The statistical analysis indicated that the differences of SD_Tpeak_d and SD_Tpeak_s between normal and post-MI groups were significant (P<0.05).
The displacement uniformity ratio was calculated at end-systole as a measure of spatial uniformity of regional myocardial displacements. The initial results were consistent with previous studies using MR cardiac imaging in canine models (Helm 2005). While these results were as anticipated, it would nevertheless be beneficial to perform a parallel analysis using MR imaging on the same mice to confirm that the accuracy of the ultrasound measurements.
As an ultrasound imaging based method, a limitation of the current approach is that it is subject to image degradation (for example, due to rib shadowing). In our experience, rib artifacts are generally avoidable in normal mice by imaging the heart from an appropriate acoustic window. In approximately 80% of our scans, there are no or little rib artifacts in the ultrasound images that pose difficulty in myocardial motion tracking. However, it remains a challenge to locate a “shadow-free” acoustic window (usually short-axis view) within 7 days after the infarct surgery. When it was not possible to completely avoid rib shadowing in the short-axis view, we chose a window in which the entire anterior and lateral walls were well preserved (the probable site of infarct as a result of LAD occlusion) so that only the septal wall was minimally shadowed.
It is worth noting that a comprehensive analysis of cardiac contractile dyssynchrony would need to be conducted in 3D. Although a 3D echocardiographic method has recently been used to assess the regional systolic dyssynchrony in patients with dilated cardiomyopathy using ultrasound (Zeng 2006) and in dog with LBBB using MRI (Helm 2005), these methods are not currently applicable to the murine heart because of the small size (< 6 mm × 8 mm) and rapid pace of the murine heart (400–600 beats per minute). Due to current hardware limitations, when attempting 3D mouse heart characterization, it is advisable to reconstruct 3D motion analysis using sets of parallel imaging planes. While our method was used to measure primarily myocardial motion within a single image plane in the short- and long-axis views, it can be readily applied to multiple short-axis slices and long-axis slices that encompass the full extent of the murine LV. Thereafter, by combining the 2D components of motion tracked in the short-axis and long-axis planes, one can derive full 3D motion of the myocardial contraction throughout the LV, using a method recently proposed by our laboratory (Li 2006).
In conclusion, we employed a speckle tracking based method on high resolution mouse cardiac ultrasound images to quantify regional myocardial contraction and cardiac dyssynchrony in post-MI murine hearts. We demonstrated this method’s capability to detect cardiac dyssynchrony as well as defects in regional myocardial motion. By excluding transmurally infarcted sectors from our analysis of dyssynchrony, we were able to quantify, for the first time, the presence of dyssynchrony in the non-infarcted murine LV late after myocardial infarction.
Acknowledgments
This work is supported by NIH grants from NIBIB (EB001826), NCRR (RR022582) and NIH (HL058582). We also thank VisualSonics, Inc. for valuable technical assistance and Patrick Helm, Ph.D., for expert advice regarding CURE. Ankit D. Tejani, B.S., assisted with mouse preparation and imaging.
Footnotes
Publisher's Disclaimer: This is a PDF file of an unedited manuscript that has been accepted for publication. As a service to our customers we are providing this early version of the manuscript. The manuscript will undergo copyediting, typesetting, and review of the resulting proof before it is published in its final citable form. Please note that during the production process errors may be discovered which could affect the content, and all legal disclaimers that apply to the journal pertain.
References
- Auricchio A, Abraham WT. Cardiac resynchronization therapy: current state of the art: cost versus benefit. Circulation. 2004;109(3):300–7. doi: 10.1161/01.CIR.0000115583.20268.E1. [DOI] [PubMed] [Google Scholar]
- Bank AJ, Kelly AS. Tissue Doppler imaging and left ventricular dyssynchrony in heart failure. J Card Fail. 2006;12(2):154–62. doi: 10.1016/j.cardfail.2005.09.003. [DOI] [PubMed] [Google Scholar]
- Bax JJ, Bleeker GB, Marwick TH, Molhoek SG, Boersma E, Steendijk P, van der Wall EE, Schalij MJ. Left ventricular dyssynchrony predicts response and prognosis after cardiac resynchronization therapy. J Am Coll Cardiol. 2004;44(9):1834–40. doi: 10.1016/j.jacc.2004.08.016. [DOI] [PubMed] [Google Scholar]
- Bleeker GB, Bax JJ, Steendijk P, Schalij MJ, van der Wall EE. Left ventricular dyssynchrony in patients with heart failure: pathophysiology, diagnosis and treatment. Nat Clin Pract Cardiovasc Med. 2006;3(4):213–9. doi: 10.1038/ncpcardio0505. [DOI] [PubMed] [Google Scholar]
- Carmeliet P, Moons L, Collen D. Mouse models of angiogenesis, arterial stenosis, atherosclerosis and hemostasis. Cardiovasc Res. 1998;39(1):8–33. doi: 10.1016/s0008-6363(98)00108-4. [DOI] [PubMed] [Google Scholar]
- Cerqueira MD, Weissman NJ, Dilsizian V, Jacobs AK, Kaul S, Laskey WK, Pennell DJ, Rumberger JA, Ryan T, Verani MS. Standardized myocardial segmentation and nomenclature for tomographic imaging of the heart: a statement for healthcare professionals from the Cardiac Imaging Committee of the Council on Clinical Cardiology of the American Heart Association. Circulation. 2002;105:539–42. doi: 10.1161/hc0402.102975. [DOI] [PubMed] [Google Scholar]
- Cherin E, Williams R, Needles A, Liu G, White C, Brown AS, Zhou Y, Foster FS. Ultrahigh frame rate retrospective ultrasound microimaging and blood flow visualization in mice in vivo. Ultrasound Med Biol. 2006;32(5):683–91. doi: 10.1016/j.ultrasmedbio.2005.12.015. [DOI] [PubMed] [Google Scholar]
- Curry CW, Nelson GS, Wyman BT, Declerck J, Talbot M, Berger RD, McVeigh ER, Kass DA. Mechanical dyssynchrony in dilated cardiomyopathy with intraventricular conduction delay as depicted by 3D tagged magnetic resonance imaging. Circulation. 2000;101(1):E2. doi: 10.1161/01.cir.101.1.e2. [DOI] [PubMed] [Google Scholar]
- D’hooge J, Heimdal A, Jamal F, Sutherland GR. Regional strain and strain rate measurements by cardiac ultrasound: Principles, implementation and limitations. Eur J Echocardiog. 2000;1(3):154–170. doi: 10.1053/euje.2000.0031. [DOI] [PubMed] [Google Scholar]
- D’hooge J, Missant C, Claus P, Rex S, Eroglu E, Rademakers FE, Wouters P. Gradients in radial strain across the cardiacwall studied with epicardial ultrasound. IEEE Ultrasonics Symposium. 2006:748–51. [Google Scholar]
- D’hooge J, Thijs D, Sipido K, Claus P, Bijnens B, Thoen J, Van de Werf F, Sutherland GR, Suetens P. Ultrasonic strain and strain rate imaging for the assessment of regional myocardial function in mice. IEEE Ultrasonics Symposium. 2004:470–3. [Google Scholar]
- Degabriele NM, Griesenbach U, Sato K, Post MJ, Zhu J, Williams J, Jeffery PK, Geddes DM, Alton EW. Critical appraisal of the mouse model of myocardial infarction. Exp Physiol. 2004;89(4):497–505. doi: 10.1113/expphysiol.2004.027276. [DOI] [PubMed] [Google Scholar]
- Fleming AD, Xia A, McDicken W, Sutherland G, Fenn L. Myocardial velocity gradients detected by Doppler imaging. British Journal of Radiology. 1994;67(79):679–88. doi: 10.1259/0007-1285-67-799-679. [DOI] [PubMed] [Google Scholar]
- Foster S, Zhang M, Zhou Y, Liu G, Mehi J, Cherin E, Harasiewicz K, Starkoski B, Zan L, Knapik D, Adamson S. A new ultrasound instrument for in vivo microimaging of mice. Ultrasound Med Biol. 2002;28(9):1165–72. doi: 10.1016/s0301-5629(02)00567-7. [DOI] [PubMed] [Google Scholar]
- Friemel BH, Bohs LN, Trahey GE. Relative performance of two-dimensional speckle-tracking techniques: normalized correlation, non-normalized correlation and sum absolute difference. IEEE Ultrasonics Symposium. 1995;2:1481–4. [Google Scholar]
- Grines CL, Bashore TM, Boudoulas H, Olson S, Shafer P, Wooley CF. Functional abnormalities in isolated left bundle branch block. The effect of interventricular asynchrony. Circulation. 1989;79(4):845–53. doi: 10.1161/01.cir.79.4.845. [DOI] [PubMed] [Google Scholar]
- Ha JS, Walker WF, Hossack JA. Determination of an optimal image frame interval for frame-to-frame ultrasound image motion tracking. IEEE Transactions on Ultrasonics Ferroelectrics & Frequency Control. 2005;52(3):386–96. doi: 10.1109/tuffc.2005.1417261. [DOI] [PubMed] [Google Scholar]
- Helm R, Leclercq C, Faris O, Ozturk C, McVeigh E, Lardo A, Kass D. Cardiac dyssynchrony analysis using circumferential versus longitudinal strain. Circulation. 2005;111(21):2760–7. doi: 10.1161/CIRCULATIONAHA.104.508457. [DOI] [PMC free article] [PubMed] [Google Scholar]
- Kass DA. Ventricular resynchronization: pathophysiology and identification of responders. Rev Card Med. 2003;4:S3–13. [PubMed] [Google Scholar]
- Kukulski T, Jamal F, D’Hooge J, Bijnens B, De Scheerder I, Sutherland GR. Acute changes in systolic and diastolic events during clinical coronary angioplasty: a comparison of regional velocity, strain rate, and strain measurement. J Am Soc Echocardiogr. 2002;15:1–12. doi: 10.1067/mje.2002.114844. [DOI] [PubMed] [Google Scholar]
- Kvitting JP, Wigstrom L, Strotmann JM, Sutherland GR. How accurate is visual assessment of synchronicity in myocardial motion? An in-vitro study with computer-simulated regional delay in myocardial motion: clinical implications for rest and stress echocardiography studies. J Am Soc Echocardiogr. 1999;12:698–705. doi: 10.1016/s0894-7317(99)70019-2. [DOI] [PubMed] [Google Scholar]
- Lardo AC, Abraham TP, Kass DA. Magnetic resonance imaging assessment of ventricular dyssynchrony: current and emerging concepts. J Am Coll Cardiol. 2005;46(12):2223–8. doi: 10.1016/j.jacc.2005.09.015. [DOI] [PubMed] [Google Scholar]
- Leclercq C, Faris O, Tunin R, Johnson J, Kato R, Evans F, Spinelli J, Halperin H, McVeigh E, Kass D. Systolic improvement and mechanical resynchronization does not require electrical synchrony in the dilated failing heart with left bundle-branch block. Circulation. 2002;106(14):1760–3. doi: 10.1161/01.cir.0000035037.11968.5c. [DOI] [PubMed] [Google Scholar]
- Li Y, Garson CD, Epstein FH, French BA, Hossack JA. Quantification and MRI validation of regional contractile dysfunction in mice post myocardial infarction using high resolution ultrasound. IEEE Ultrasonics Symposium. 2006:860–63. doi: 10.1016/j.ultrasmedbio.2006.12.008. [DOI] [PMC free article] [PubMed] [Google Scholar]
- Li Y, Garson CD, Xu Y, Beyers RJ, Epstein FH, French BA, Hossack JA. Quantification and MRI validation of regional contractile dysfunction in mice post myocardial infarction using high resolution ultrasound. Ultrasound Med Biol. 2007;33(6):894–904. doi: 10.1016/j.ultrasmedbio.2006.12.008. [DOI] [PMC free article] [PubMed] [Google Scholar]
- Luliano S, Fisher SG, Karasik PE, Fletcher RD, Singh SN. QRS duration and mortality in patients with congestive heart failure. Am Heart J. 2002;143(6):1085–91. doi: 10.1067/mhj.2002.122516. [DOI] [PubMed] [Google Scholar]
- Luo J, Fujikura K, Homma S, Konofagou EE. Myocardial elastography at both high temporal and spatial resolution for the detection of infarcts. Ultrasound Med Biol. 2007;33(8):1206–23. doi: 10.1016/j.ultrasmedbio.2007.01.019. [DOI] [PubMed] [Google Scholar]
- Pernot M, Fujikura K, Fung-Kee-Fung S, Konofagou EE. ECG-synchronized, ultrafast ultrasound imaging of cardiovascular tissues in intact mice. Ultrasound Med Biol. 2007;33(7):1075–85. doi: 10.1016/j.ultrasmedbio.2007.02.003. [DOI] [PubMed] [Google Scholar]
- Pislaru C, Belohlavek M, Bae RY, Abraham TP, Greenleaf JF, Seward JB. Regional asynchrony during acute myocardial ischemia quantified by ultrasound strain rate imaging. J Am Coll Cardiol. 2001;37(4):1141–8. doi: 10.1016/s0735-1097(01)01113-5. [DOI] [PubMed] [Google Scholar]
- Pitzalis MV, Iacoviello M, Romito R, Guida P, De Tommasi E, Luzzi G, Anaclerio M, Forleo C, Rizzon P. Ventricular asynchrony predicts a better outcome in patients with chronic heart failure receiving cardiac resynchronization therapy. J Am Coll Cardiol. 2005;45(1):70–1. doi: 10.1016/j.jacc.2004.09.058. [DOI] [PubMed] [Google Scholar]
- Ross A, Yang ZQ, Berr SS, Gilson WD, Petersen WC, Oshinski JN, BA F. Serial MRI evaluation of cardiac structure and function in mice after reperfused myocardial infarction. Magn Reson Med. 2002;47(6):1158–68. doi: 10.1002/mrm.10166. [DOI] [PubMed] [Google Scholar]
- Schmermund A, Gerber T, Behrenbeck T, Reed JE, Sheedy PF, Christian TF, Rumberger JA. Measurement of myocardial infarct size by electron beam computed tomography: a comparison with 99mTc sestamibi. Invest Radiol. 1998;33(6):313–21. doi: 10.1097/00004424-199806000-00001. [DOI] [PubMed] [Google Scholar]
- Sebag IA, Handschumacher MD, Ichinose F, Morgan JG, Hataishi R, Rodrigues AC, Guerrero JL, Steudel W, Raher MJ, Halpern EF, Derumeaux G, Bloch KD, Picard MH, Scherrer-Crosbie M. Quantitative assessment of regional myocardial function in mice by tissue Doppler imaging: comparison with hemodynamics and sonomicrometry. Circulation. 2005;111:2611–16. doi: 10.1161/CIRCULATIONAHA.104.474411. [DOI] [PubMed] [Google Scholar]
- Spragg DD, Kass DA. Pathobiology of left ventricular dyssynchrony and resynchronization. Prog Cardiovasc Dis. 2006;49(1):26–41. doi: 10.1016/j.pcad.2006.05.001. [DOI] [PubMed] [Google Scholar]
- Sutherland GR, Stewart MJ, Groundstroem KW, Moran CM, Fleming AD, Guell-Peris FJ, Riemersma RA, Fenn LN, Fox KA, McDicken WN. Color Doppler myocardial imaging: a new technique for the assessment of myocardial function. J Am Soc Echocardiogr. 1994;7(5):441–58. doi: 10.1016/s0894-7317(14)80001-1. [DOI] [PubMed] [Google Scholar]
- VisualSonics. Personal communication. 2007.
- Yang Z, Bove CM, French BA, Epstein FH, Berr SS, DiMaria JM, Gibson JJ, Carey RM, Kramer CM. Angiotensin II type 2 receptor overexpression preserves left ventricular function after myocardial infarction. Circulation. 2002;106:106–11. doi: 10.1161/01.cir.0000020014.14176.6d. [DOI] [PubMed] [Google Scholar]
- Yu CM, Chau E, Sanderson JE, Fan K, Tang MO, Fung WH, Lin H, Kong SL, Lam YM, Hill MR, Lau CP. Tissue Doppler echocardiographic evidence of reverse remodeling and improved synchronicity by simultaneously delaying regional contraction after biventricular pacing therapy in heart failure. Circulation. 2002;105(4):438–45. doi: 10.1161/hc0402.102623. [DOI] [PubMed] [Google Scholar]
- Zeng X, Shu XH, Pan CZ, Chen RZ, Cheng K, Liu SZ, Chen HZ. Assessment of left ventricular systolic synchronicity by real-time three-dimensional echocardiography in patients with dilated cardiomyopathy. Chin Med J. 2006;119(11):919–24. [PubMed] [Google Scholar]
- Zhang Y, Takagawa J, Sievers RE, Khan MF, Viswanathan MN, Springer ML, Foster E, Yeghiazarians Y. Validation of the wall motion score and myocardial performance indices as novel techniques to assess left ventricular function in mice post myocardial infarction. Am J Physiol Heart Circ Physiol. 2006;292:H1187–92. doi: 10.1152/ajpheart.00895.2006. [DOI] [PubMed] [Google Scholar]
- Zoghbi WA, Charlat ML, Bolli R, Zhu WX, Hartley CJ, Quinones WA. Quantitative assessment of left ventricular wall motion by two-dimensional echocardiography: validation during reversible ischemia in the conscious dog. J Am Coll Cardiol. 1988;11:851–860. doi: 10.1016/0735-1097(88)90222-7. [DOI] [PubMed] [Google Scholar]