Abstract
The anterior olfactory nucleus (AON) is a central olfactory cortical structure that has heavy reciprocal connections with both the olfactory bulb (OB) and piriform cortex. While it has been firmly established that the AON is a primary source of bilateral projections in the olfactory system through extensive connections with both the ipsilateral and contralateral OB, AON and piriform cortex, few studies have examined this circuitry in detail. In the present study, we used small injections of the anterograde tracer Phaseolus vulgaris Leucoagglutinin (PHA-L) and the retrograde tracer Fluorogold in specific subregions of the AON to explore the topography of the interconnections between the left and right AONs. Labeled fibers were found in the contralateral AON following injections in all areas. However, detailed quantitative analyses revealed that different regions of the AON have distinct patterns of interhemispheric innervation; contralateral fibers were most heavily targeted to dorsal and lateral AON subregions, while the medial and ventral areas received relatively light projections. These results demonstrate important features of the interhemispheric circuitry of the AON, and suggest separate functional roles for subregions of the AON in olfactory information processing.
Keywords: olfactory cortex, anatomy, olfaction, cortical processing
INTRODUCTION
The anterior olfactory nucleus (AON) is a cortical structure located in the olfactory peduncle, caudal to the olfactory bulb and rostral to the piriform cortex, and receives a significant input from mitral and tufted cells in the olfactory bulb (de Olmos et al., 1978; Shipley and Ennis, 1996; Brunjes et al., 2005). It has significant reciprocal connections with both the bulb and the piriform cortex (de Olmos et al., 1978; Haberly and Price, 1978a; Haberly and Price, 1978b; Luskin and Price, 1983b), and is thought to play an important role in relaying information between the left and right hemispheres (Brunjes et al., 2005; Yan et al., 2008).
The AON is comprised of subregions (termed pars, latin for “part”) that are named for their relative location in the AON: pars dorsalis, pars lateralis, pars ventralis (or “pars ventroposterioralis”), pars medialis, and pars externa (for a review, see Brunjes et al., 2005). As the AON appears as a homogenous ring of cells surrounding the remnant of the olfactory ventricle in Nissl-stained tissue, the boundaries of these subregions have often been arbitrarily defined. Growing evidence from cyto-and chemo-architectural studies suggests that divisions within the AON can be made on a structural or functional basis (Haberly and Price, 1978b; Brunjes et al., 2005; Meyer et al., 2006). A few studies the characteristics of these subregions suggest there also are subregional variations in the number and extent of ipsilateral and contralateral connections (Haberly and Price, 1978a; Luskin and Price, 1983b; Reyher et al., 1988). The purpose of the present study was to explore the projections to the contralateral AON in greater detail, using small extracellular injections of both anterograde and retrograde neuronal tracers. Results of these experiments confirm that subregions of the AON display distinct patterns of contralateral projections, and uncover important features of interhemispheric connectivity. Such results suggest distinct functional roles for AON subregions, and indicate that the AON plays a central role in olfactory information processing.
METHODS
Subjects
All procedures were performed in accordance with NIH guidelines under protocol approved by the University of Virginia Animal Care and Use Committee. Thirty-two male Long-Evans rats (280-350 g; Harlan) used for this study were housed in standard polypropylene cages with food and water ad libitum. The colony was maintained on a 12:12 light:dark cycle in a temperature-controlled room (22°C). Rats were anesthetized with an intraperitoneal injection of a ketamine/medetomidine mixture (ketamine 0.5 mg/kg; medetomidine 0.32 mg/kg). Rats were placed on a heating pad to maintain body temperature, and the head was secured in a stereotaxic frame (Kopf Instruments, Tujunga, CA). Using aseptic procedures, a midline incision was made, skull landmarks (bregma) located, and the head leveled to conform to the atlas of Paxinos and Watson (1986). A small hole was drilled in the skull overlying the intended injection site, through which a glass pipette (tip diameter 15-20 μm) that had been filled with a 2.5% solution of Phaseolus vulgaris leucoagglutinin (PHA-L; Vector Laboratories, Burlingame, CA) or a 4% solution of Fluorogold (Fluorochrome LLC, Engelwood, CO) was positioned using a micromanipulator. The tracer was iontophoretically injected by delivering 2.5-5 μA of DC current through the pipette using a current generator (Grass Instruments, Quincy, MA) on a 50% duty cycle (7 seconds on/off) for 5-15 minutes. Current flow was monitored using an in-line ammeter (Fluka, Buchs, Switzerland). Seven to 10 days following the injection, animals were deeply anesthetized with an overdose of sodium pentobarbital (50mg/300g body weight) and perfused through the aorta with a rapid wash of phosphate-buffered saline (PBS, pH 7.4) containing heparin (5000 units/liter) followed by 4% formaldehyde freshly depolymerized from paraformaldehyde. Brains were removed, postfixed for 4 hours and then cryoprotected in 30% sucrose/PBS for 24-48 hours. Sections of brain tissue were cut at 40-50μm on a cryostat, and the tissue was stored in PBS containing 0.1% sodium azide until processed.
Immunocytochemistry for PHA-L
Sections were processed for PHA-L immunoreactivity using a modification of the protocol of Gerfen and Sawchenko (1984; see Illig, 2005) Briefly, sections were washed five times in PBS containing 2% bovine serum albumin (BSA) and 0.5% Triton X-100 (Sigma, St. Louis, MO), followed by incubation with the primary antibody (goat anti-PHA-L, Vector laboratories, Burlingame, CA; 1:2000 dilution in PBS + BSA + Triton) overnight at room temperature. Sections were then washed five times in PBS + BSA + Triton and incubated in secondary antibody (biotinylated anti-goat, Vector; 1:1000 dilution). Next, sections were washed five times in PBS, then reacted with avidin (Vector Standard Elite ABC Kit). Staining was visualized using 0.04% 3,3-diaminobenzadine (DAB; Sigma) with 0.01% H2O2 in phosphate buffer. Sections were mounted on gelatin-coated slides, dehydrated and coverslipped. Tissue from animals injected with Fluorogold was examined either under direct fluorescence microscopy, or under light microscopy following immunolabeling with anti-Fluorogold antibody (Chemicon, Temecula, CA, USA; 1:800 dilution) and visualization as above with DAB. In all cases, processing of tissue sections without the primary antibody yielded no visible staining.
Tissue Analysis
For data analysis and figures, tracings were made of PHA-L labeled axons and Fluorogold-labeled cell bodies in the contralateral hemisphere with the aid of a camera lucida (Lucivid) and computer running Neurolucida (MicroBrightField, Colchester, VT) at a final magnification of 200×. Only those axons which were clearly discernable and which displayed varicosities, (i.e. presumed synaptic boutons) were included in tracings of PHA-L material. Tracings were made for the entire section. For quantitative data analysis, fiber densities were sampled by placing a square grid (200 μm spacing) over each section and randomly choosing squares to sample within each subregion. Two squares from each region were sampled for pars medialis and pars ventralis, and three squares were sampled from each pars lateralis and pars dorsalis. Within each sample square, the number of fibers present was counted and recorded. For fibers that branched within the sampling square, each branch was counted as a single fiber (i.e., a fiber with a single collateral branch was counted as two fibers). The average number of fibers was calculated for each subregion, on the basis of no fewer than six separate samples from each of three different animals. The average number of fibers in each subregion was converted to a proportion of the total number of fibers sampled within the AON, to account for variability in injection size among animals. These proportions were averaged across animals with the same injection target, resulting in a measure of the relative connectivity from the injection site to each of the other subregions. Tracings used for figures were exported as bitmaps and compiled using CorelDraw (v. X3, Corel, Ottawa, Ontario, Canada) to allow for the addition of labels and other markers. Digital photomicrographs of tissue were taken with a SPOT camera and software (Diagnostic Instruments, Sterling Heights, MI, USA). Images used for figures were unchanged except to balance the contrast and intensity across all images using Adobe Photoshop software (Adobe Systems Inc., San Jose, CA, USA).
RESULTS
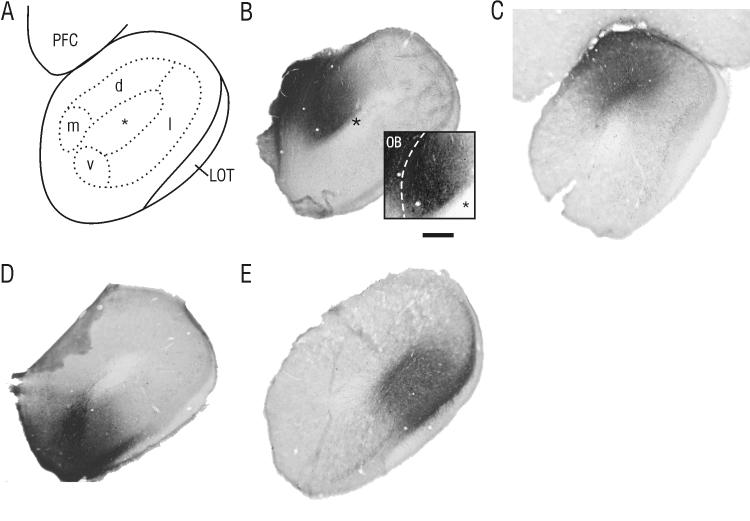
In all experiments, injections were placed between 4.0 and 5.5 mm anterior to Bregma, and varied along the medial-lateral and dorso-ventral axes (see Figure 1). Although there is substantial heterogeneity in cyto- and chemoarchitecture within the AON (Meyer et al., 2006), there is considerable disagreement over the location and extent of the various subdivisions, which are often arbitrarily defined (see Brunjes, Illig and Meyer, 2005). Indeed, one goal of the present study was to determine whether differences in contralateral projection patterns could be used as a means to more clearly demarcate subdivisions of the AON. For the sake of clarity, we describe the injections and labeled projections in the figures and text using the definitions of Haberly and Price (1978a).
Figure 1. Representative phaseolus vulgaris leucoagglutinin (PHA-L) injection sites within the anterior olfactory nucleus (AON).
A) Schematic drawing of a coronal section through the AON, showing the relative location of subdivisions. Injections were targeted to layer II (dotted line) of the AON in pars medialis (AONm; B), pars dorsalis (AONd; C), pars ventralis (AONv; D) and pars lateralis (AONl; E), between 4.2 and 4.8 mm anterior to bregma. In all cases, the region of uptake was limited to cells within the boundaries of these subregions as described by Haberly and Price (1978b). The inset in panel B shows a magnified, contrast-enhanced view of the illustrated injection into pars medialis. Injections into this region were carefully examined to ensure that no cells within the adjacent olfactory bulb (to the left of the dashed line) displayed PHA-L uptake. LOT, lateral olfactory tract; PFC, prefrontal cortex; asterisk, olfactory ventricle; scale bar in B = 100 μm for panels B-E, 250 μm for inset in B.
Contralateral projections from pars lateralis
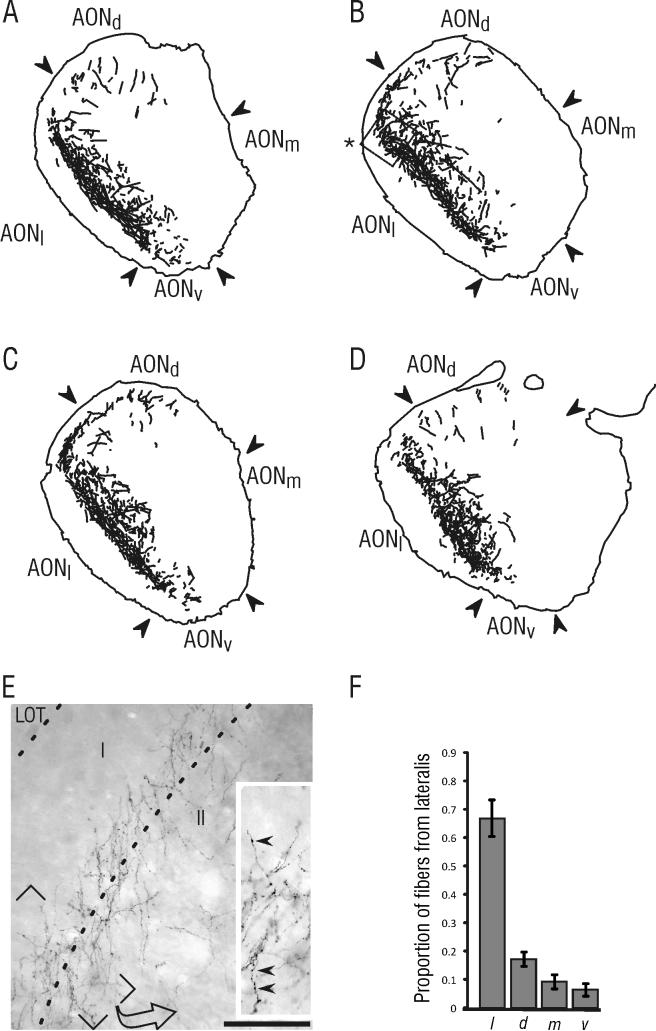
Injection sites within pars lateralis varied along the dorsoventral axis to provide a sampling of cells from the entire subregion. Successful injections encompassed the dorsoventral extent of pars lateralis, from the border with pars dorsalis to the ventromedial border with pars ventralis as defined by Haberly and Price (1978; see Figure 1D). Injections into pars lateralis yielded dense labeling in the contralateral pars lateralis. Quantitative analysis showed that this projection accounted for approximately two-thirds of the total projection from pars lateralis to the contralateral AON (66.7% ± 6.3; mean ± SE). There was also a robust contralateral projection into the lateral portion of pars dorsalis (17.3% ± 2.5), but only a relatively small number of fibers was found within contralateral pars medialis (9% ± 2.4) or pars ventralis (6% ± 2.1; Figures 2 and 7). Labeled contralateral fibers displayed a large number of presumed synaptic contacts in the form of en passant and stalked boutons (inset, Figure 2A).
Figure 2. PHA-L labeling found within the AON contralateral to an injection in pars lateralis.
Contralateral fibers were concentrated most heavily in pars lateralis, with a smaller projection found in pars dorsalis. A-D) Tracings of fibers found contralateral to the injection in pars lateralis. In this and subsequent figures, tracings were made at 200 x magnification and only included axons that displayed terminal or en passant bouton-like varicosities. The illustrated sections are located at approximately 5.0 mm (A), 4.6 mm (B), 4.2 mm (C) and 3.8 mm (D) anterior to bregma. E) Photomicrograph showing the extensive labeling from a relatively small injection in the contralateral pars lateralis. Inset shows a magnified view of labeled fibers in layers I and II of the AON, in which axonal swellings (presumed synaptic boutons) can be visualized (arrowheads). The photomicrograph for panel E was taken from the area outlined in panel B (asterisk). F) Results from quantitative analysis of projection fibers. This graph shows the mean proportion (± SE) of sampled contralateral fibers present in each subdivision (see text for details). Scale bar = 100 μm for E and 160 μm for the inset in E. The illustrated sections were taken from the same material as the injection shown in Figure 1E.
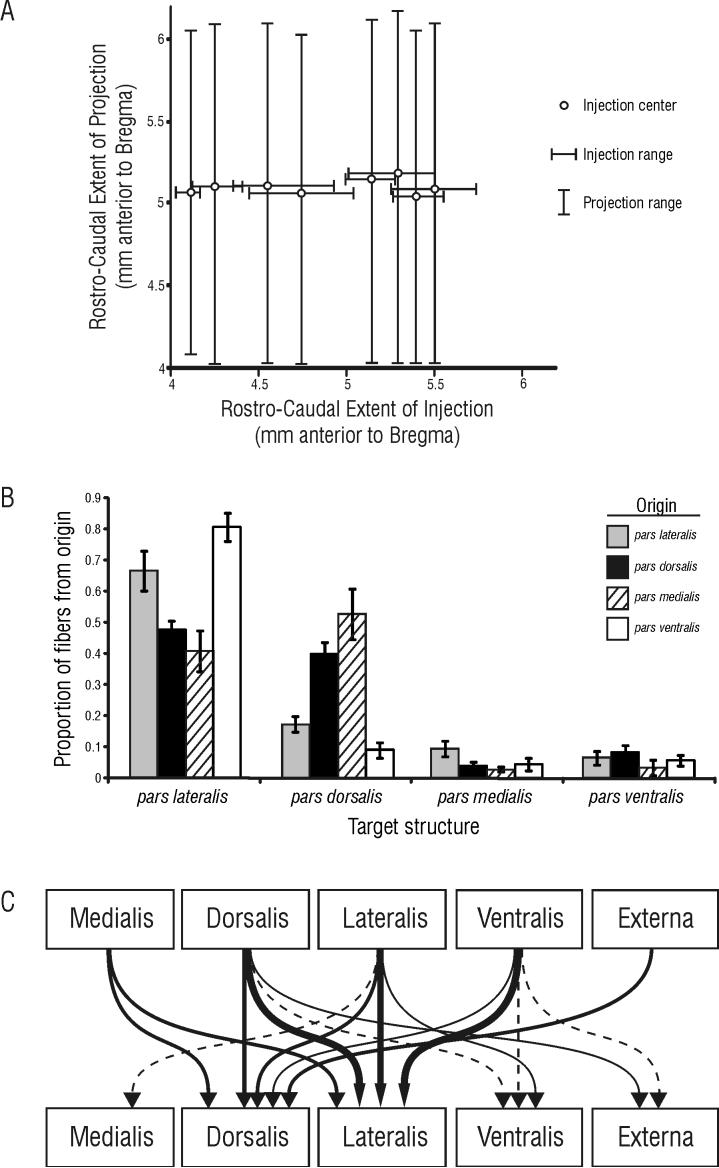
Figure 7. Summary of contralateral projections within the AON.
A) Analysis of the correlation between the location of the rostro-caudal position of the injection and the extent of labeled fibers on the contralateral side revealed that even relatively small injections result in labeled fibers throughout the rostro-caual extent of the AON. The rostral border of the AON with the olfactory bulb is approximately 6.2mm anterior to Bregma; the caudal boundary of the AON is nebulous, as the AON transitions into the piriform cortex beginning at approximately 4.2 mm anterior to Bregma (Paxinos and Watson, 1986). Note that injections at any rostro-caudal level in the AON give rise to projections that are similarly widespread in the rostro-caudal dimension. B) Comprehensive results of the quantitative analysis of labeled fibers following injections into each structure. The mean proportion of fibers (± SE) from each originating structure are illustrated for each subregional target. Note that the total number of fibers in each area is unknown, so the relative strength of the input to each target originating from any given area cannot be determined. C) Contralateral projections are schematically illustrated as lines of varying thickness; thick lines indicate strong projections, thin lines indicate weak projections, and dashed lines indicate very weak projections. Note that pars dorsalis and lateralis receive the bulk of contralateral input, while pars medialis, ventralis and externa receive only slight input from the contralateral AON.
The appearance of the projection to the contralateral pars lateralis suggested some horizontal stratification of inputs to the AON; labeled fibers were absent from the superficial portion of layer I, but were particularly concentrated in the deep portion of layer I and the superficial half of layer II (Figure 2).
Outside the AON, a heavy projection to both the ipsilateral and contralateral anterior piriform cortex (APC) was found, predominantly in the deepest portion of layer Ib and the superficial portion of layer II. Notably, there was a broad topography in this projection, with injections in ventral pars lateralis resulting in labeled fibers in the ventromedial APC, and injections in dorsal portions of pars lateralis projecting more dorsally. These results are in agreement with findings previously reported (Haberly and Price, 1978b; Luskin and Price, 1983a; Luskin and Price, 1983b). In addition, a light projection to the tenia tecta was observed.
Contralateral projections from pars dorsalis
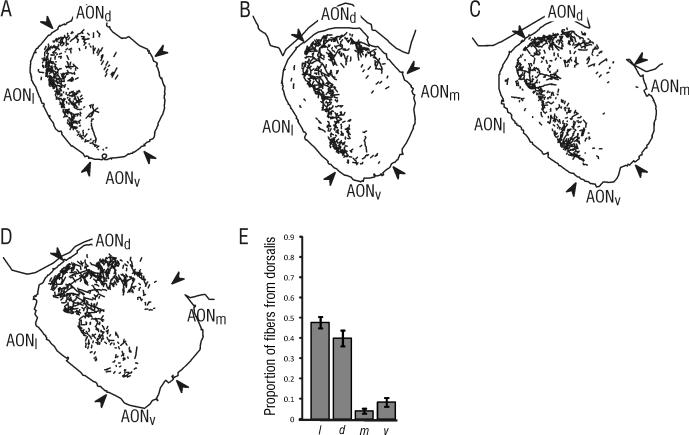
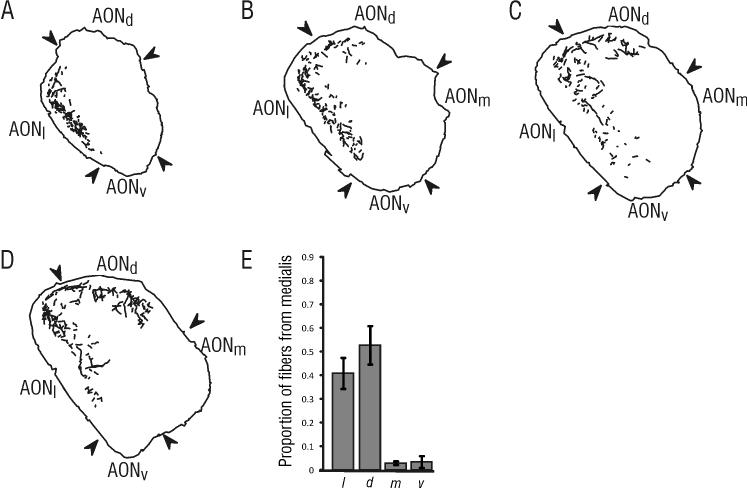
Injections were targeted to sites encompassing the medial, central and lateral portions of pars dorsalis (Figure 1B). Analyses of anterogradely-transported PHA-L revealed a heavy projection to contralateral pars lateralis (47.8% ± 2.7 of the projection to the contralateral AON) and to contralateral pars dorsalis (39.9% ± 3.8; Figures 3 and 7). As was the case following injections in pars lateralis, the projection to each of these areas was found in the deep portion of layer I, but the projection to layer II was more widespread, with fibers more evenly distributed throughout (Figure 3).
Figure 3. PHA-L labeling found within the AON contralateral to an injection in pars dorsalis.
Contralateral fibers were found primarily in pars lateralis and pars dorsalis. A-D) Tracings of fibers found contralateral to the injection in pars dorsalis, with the illustrated sections located at approximately 5.0 mm (A), 4.6 mm (B), 4.2 mm (C) and 3.8 mm (D) anterior to bregma. E) Results from quantitative analysis of projection fibers, showing the mean proportion (± SE) of sampled contralateral fibers present in each subdivision. The illustrated sections were taken from the same material as the injection shown in Figure 1C.
In some rostral sections of the AON, there was some anterograde labeling of fibers in the contralateral pars medialis (3.9% ± 1.2 of the projection to the contralateral AON; Figure 3). This sparse projection tended to fade caudally, so that there were very few fibers observed in caudal pars medialis. A small projection also was found in pars ventralis contralateral to the injection in pars dorsalis (8.3% ± 2.2 of the projection to the contralateral AON; Figure 3). A moderate number of labeled fibers also were seen in contralateral pars externa following injections in pars dorsalis.
The projection from pars dorsalis to piriform cortex appeared similar to labeling seen following injections in pars lateralis, with injections in pars dorsalis resulting in heavy labeling in deep layer Ib and superficial layer II of the APC on both the contralateral and ipsilateral sides. Further, and again in agreement with previous studies (Haberly and Price, 1978b; Luskin and Price, 1983a; Luskin and Price, 1983b), the projection from pars dorsalis was found predominantly in the dorsal portion of APC, dorsolateral to the projection from pars lateralis.
Contralateral projections from pars medialis
Following injections into pars medialis, a robust projection was observed on the contralateral side (Figures 4 and 7), with the heaviest labeling found in layer II of both pars dorsalis (52.8% ± 8.1 of the projection to the contralateral AON) and pars lateralis (40.8% ± 6.5). There did not appear to be a superficial-to-deep gradient in this projection from contralateral pars medialis, as there was in the projections from pars lateralis. However, there was a rostro-caudal gradient in the projections to pars dorsalis and pars lateralis, such that the highest concentration of projections shifted from dorsal pars lateralis rostrally to pars dorsalis caudally (Figure 4). Only a very few labeled fibers were found in pars medialis (2.9% ± 0.8) and pars ventralis (3.4% ± 2.4) following an injection in pars medialis.
Figure 4. PHA-L labeling found within the AON contralateral to an injection in pars medialis.
Contralateral fibers were found primarily in pars lateralis and pars dorsalis. A-D) Tracings of fibers found contralateral to the injection in pars medialis, with the illustrated sections located at approximately 5.0 mm (A), 4.6 mm (B), 4.2 mm (C) and 3.8 mm (D) anterior to bregma. E) Results from quantitative analysis of labeled fibers illustrating the mean proportion (± SE) of sampled contralateral fibers present in each subdivision. The illustrated sections were taken from the same material as the injection shown in Figure 1B.
Contralateral projections from pars ventralis
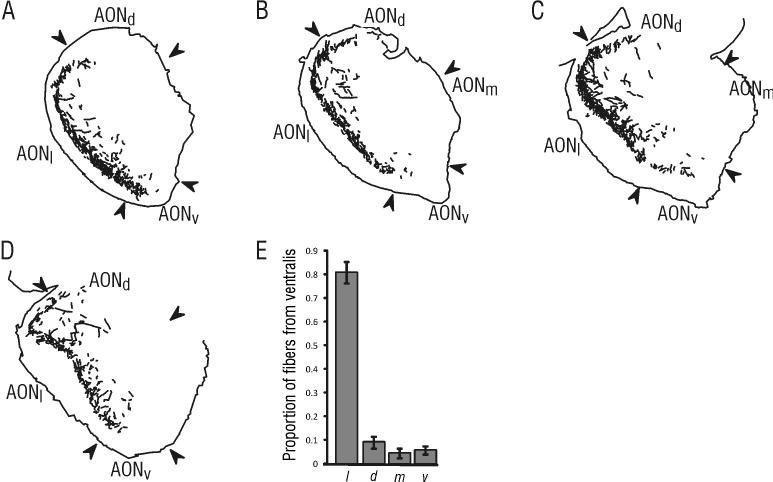
As with other subregions of the AON, injections of PHA-L placed in pars ventralis resulted in a significant contralateral projection (Figure 5 and 7). Again, labeled fibers were most prominent in pars lateralis, accounting for 80.7% (±4.5) of the projection to the contralateral AON. A smaller proportion of fibers extended into the lateral part of pars dorsalis (9.1% ± 2.6). Fibers were found almost exclusively within layer II, and displayed a prominent superficial-to-deep gradient, with most labeled fibers originating in pars ventralis projecting to the superficial half of layer II in pars lateralis. This gradient was more readily apparent in rostral sections than caudal sections.
Figure 5. PHA-L labeling found within the AON contralateral to an injection in pars ventralis.
Contralateral fibers were found primarily in pars lateralis. A-D) Tracings of fibers found contralateral to the injection in pars ventralis, with the illustrated sections located at approximately 4.8 mm (A), 4.4 mm (B), 4.0 mm (C) and 3.6 mm (D) anterior to bregma. Because the plane of section is slightly deviated from vertical in the dorso-ventral plane, the ventral portion of pars laterails illustrated in panel D contains a portion of piriform cortex. E) Results from quantitative analysis of projection fibers (mean proportion ± SE). Note the large proportion of sampled contralateral fibers present in pars lateralis compared to other subdivisions. The illustrated sections were taken from the same material as the injection shown in Figure 1D.
A small projection from pars ventralis (5.7% ± 1.6) was visible in the contralateral pars ventralis, and in the contralateral pars externa (Figure 5). Only scattered fibers were found in the pars medialis (4.4% ± 2.1) or in the medial portion of pars dorsalis contralateral to the pars ventralis injection.
Contralateral projections from pars externa
Because of the small size of pars externa and its location immediately superficial to pars lateralis and pars dorsalis, direct injections of PHA-L were not sufficiently restricted to pars externa to adequately discriminate the origin of the labeled fibers. Therefore, in order to examine the contralateral projections unique to pars externa, injections of the retrograde tracer hydroxystilbamidine (Fluorogold) were made into other subregions within the AON, and the resultant retrograde labeling of cell bodies within pars externa were used to ascertain the contralateral projections emanating from this region.
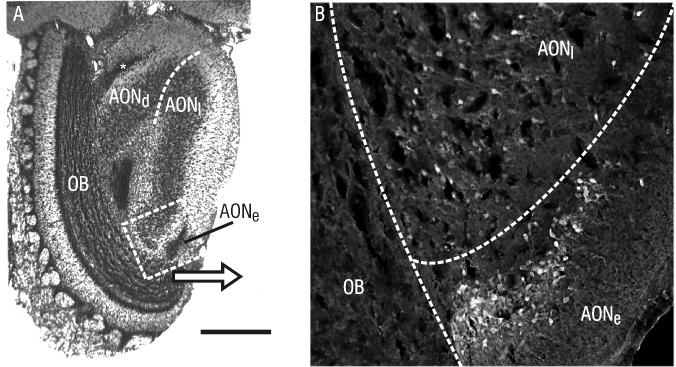
A significant number of retrogradely-labeled cells were found in pars externa only after injections of Fluorogold in the contralateral pars dorsalis (Figure 6). Injections into other areas of the AON yielded only a very few, scattered cells labeled within pars externa.
Figure 6. Pars externa projects to the contralateral pars dorsalis.
A) Coronal Nissl-stained section through the rostral AON, showing the location of pars externa (AONe; asterisk) in relation to the olfactory bulb (OB), pars dorsalis and pars lateralis. B) Darkfield photomicrograph of the region indicated in A, showing retrograde fluorogold labeling of cell bodies in pars externa following an injection into contralateral pars dorsalis. Scale bar = 150μm in A, 40μm in B.
DISCUSSION
It has been suggested, based on differences in the origins of afferent fiber populations, that subregions of the AON serve functionally separate roles (Haberly, 2001). There is some evidence available to support this notion, especially for pars externa (see Brunjes et al., 2005 for a review; Meyer et al., 2006; Yan et al., 2008). In the present study, we systematically injected PHA-L and Fluorogold into different AON subregions, and found distinct projection patterns among subregions, suggesting a more refined and complex circuitry than previously has been recognized (Figure 7). It should be noted that in this study, we have attributed the differences in projection patterns to differences among originating structures. It might be expected that systematic changes in the rostrocaudal position of the injection within subregions of pars principalis might reveal further patterns in contralateral projections. In our experiments, with PHA-L injections into AON subregions between 4.0 and 5.5 mm anterior to Bregma—nearly the entire extent of the AON—we found no correlation between the injection site and rostrocaudal extent of labeled projections (see Figure 7A). However, many of our injections overlapped substantially, so subtle differences in contralateral projection patterns that could be attributed to rostrocaudal position of the injection site may have been obscured. Nevertheless, we could find no quantitative or qualitative differences in the contralateral projection that could be attributed to rostrocaudal position of the injection or spread of the tracer within a particular subregion of pars principalis.
Comparisons with previous studies
Other investigators have examined AON projections (e.g., Haberly and Price, 1978a; Haberly and Price, 1978b; Luskin and Price, 1983b; Schoenfeld et al., 1985). However, these studies used large injections of horseradish peroxidase which extended over multiple subregions, and often were focused on projections from the AON to other areas of the olfactory system. Thus, detailed accounts of contralateral projections within the AON were not always reported. We begin the discussion of our results by comparing our findings with those from previous studies.
Haberly and Price (1978b) made three important observations on the contralateral projections of the AON. Identifying both anterograde and retrograde transport of HRP, they found that pars lateralis received projections from every subregion on the contralateral side except for pars externa, that anterograde transport of HRP to the contralateral AON yielded heavy labeling in layer I of pars lateralis, and that an injection of HRP into pars medialis yielded very few retrogradely labeled cells in the contralateral AON. On the basis of these findings, they concluded that contralateral projections within the AON primarily target pars lateralis (Haberly and Price, 1978b).
Schoenfeld and Macrides (1984) specifically examined the contralateral projections from pars externa by analyzing the retrograde transport of HRP following injections in the olfactory bulb and AON. They found no retrogradely-labeled cells in pars externa following injection into any subregion of the contralateral AON. Following up this finding with an analysis of anterogradely-labeled fibers following HRP injections suggested that the only portion of the AON that projected contralaterally to the pars externa was pars dorsalis. Thus, they concluded that pars externa, while displaying significant projections to the contralateral olfactory bulb, did not project to the contralateral AON, and received input only from pars dorsalis on the contralateral side.
Our results support the general conclusions of these previous studies, but extend these findings in important ways. We have found that in addition to targeting pars lateralis, every subregion, including pars externa, also sends a projection to contralateral pars dorsalis. This finding suggests that pars dorsalis and pars lateralis each play an important role in interhemispheric communication in the AON. Our quantitative data suggest that, although both pars dorsalis and lateralis receive significant contralateral input, pars lateralis is more heavily targeted by contralateral projections than pars dorsalis
We also have found subregional differences in the pattern of contralateral projections. For instance, the projections from pars dorsalis and pars medialis target pars dorsalis and pars lateralis roughly equally. However, the contralateral projections from pars lateralis and pars ventralis target pars lateralis preferentially. Finally, pars externa is connected only with pars dorsalis. These characteristics of AON circuitry suggest that pars dorsalis and pars lateralis each play a distinct role in contralateral processing of olfactory information.
The involvement of pars dorsalis is significant in light of the recent finding that pars externa connects contralateral isofunctional columns in the olfactory bulbs, and that the pars externa modulates information processing in the olfactory bulb (Yan et al., 2008). Our finding that pars externa is reciprocally connected with pars dorsalis suggests that olfactory processing in the olfactory bulb may be modulated by the AON in a “top-down” manner.
Our findings using anterograde transport of PHA-L and retrograde transport of Fluorogold differ from the conclusions of Schoenfeld and Macrides in two ways. First, in addition to the projection from contralateral pars dorsalis, we also found a small projection to pars externa originating in contralateral pars ventralis. Second, we found heavy retrograde labeling of cell bodies in pars externa following an injection in contralateral pars dorsalis, but not from other parts of the AON (Figure 6). Thus, pars externa has significant reciprocal connections with contralateral pars dorsalis, and receives additional input from the contralateral pars ventralis.
Laminar stratification
An intriguing result from our studies was the observation of superficial-to-deep gradients of contralateral projections within the AON. Contralateral projections from pars ventralis were primarily located in the deep layer I and superficial layer II of pars dorsalis and pars lateralis. This was also observed for projections from pars lateralis, but the effect was less pronounced, perhaps because there was a more extensive projection in the deeper layers than was seen from pars ventralis. In contrast, injections into pars dorsalis and pars medialis resulted in projections that did not exhibit significant superficial-to-deep differences. These differences in laminar termination suggest that input and association fiber systems within the AON may be stratified perpendicular to the cortical surface, similar to the organization that is found in piriform cortex. Such stratification may be a result of differences in cell types within layer II of the AON, as a recent study of cyto- and chemoarchitectural features of the AON found significant superficial-to-deep gradients in calbindin and parvalbumin immunostaining within the AON (Meyer et al., 2006). Thus, contralateral projections may preferentially target different cell types depending on their origin.
Functional Implications
An important finding is the appearance of pars dorsalis and pars lateralis as the major recipients of contralateral input. Functionally, if these two subregions display a high degree of interconnectivity ipsilaterally, then our results would suggest that they operate together to integrate information across hemispheres, perhaps to assemble a snapshot of the olfactory environment and send the result to piriform cortex. Alternatively, if there is relatively little intrinsic circuitry between these areas, then pars dorsalis and pars lateralis may receive information from the contralateral hemisphere in parallel as two relatively independent processing streams, as suggested by Haberly (2001). Indeed, the projections to the APC from these two subregions remain largely segregated in piriform cortex, with pars dorsalis and pars lateralis terminating in dorsal and ventral portions of APC, respectively (data not shown; Haberly and Price, 1978a; Luskin and Price, 1983b).
In contrast, pars medialis and pars ventralis receive little input from the contralateral side, even though both areas extend a significant contralateral projection. Indeed, we found no significant projection to pars medialis from any subregion of the AON, and the projections to pars ventralis were very limited. Interestingly, these subregions have little or no projections to the piriform cortex (Haberly and Price, 1978a; Luskin and Price, 1983b; Brunjes et al., 2005), and can be distinguished from the rest of the AON by cytoarchitectural features and projection patterns (Haberly, 2001; Brunjes et al., 2005). These results provide additional evidence supporting a distinct role for these subdivisions, and suggest that the primary functions of pars medialis and pars ventralis may be confined to intrinsic circuitry within the AON.
Acknowledgments
Funding: NIH DC005557 from NIDCD; NIH DC000338 from NIDCD; Sigma Xi Grant-in-Aid of Research; Harrison Research Award from the University of Virginia.
Literature Cited
- Brunjes PC, Illig KR, Meyer EA. A field guide to the anterior olfactory nucleus (cortex) Brain Research Reviews. 2005;50:305–335. doi: 10.1016/j.brainresrev.2005.08.005. [DOI] [PubMed] [Google Scholar]
- de Olmos J, Hardy H, Heimer L. The afferent connections of the main and the accessory olfactory bulb formations in the rat: an experimental HRP-study. J Comp Neurol. 1978;181:213–244. doi: 10.1002/cne.901810202. [DOI] [PubMed] [Google Scholar]
- Gerfen CR, Sawchenko PE. An anterograde neuroanatomical tracing method that shows the detailed morpholgy of neurons, their axons and terminals: Immunohistochemical localization of an axonally transported plant lectin, Phaseolus vulgaris leucoagglutinin (PHA-L) Brain Res. 1984;290:219–238. doi: 10.1016/0006-8993(84)90940-5. [DOI] [PMC free article] [PubMed] [Google Scholar]
- Haberly LB. Parallel-distributed processing in olfactory cortex: New insights from morphological and physiological analysis of neuronal circuitry. Chem Senses. 2001;26:551–576. doi: 10.1093/chemse/26.5.551. [DOI] [PubMed] [Google Scholar]
- Haberly LB, Price JL. Association and commissural fiber systems of the olfactory cortex of the rat. I. Systems originating in the piriform cortex and adjacent areas. J Comp Neurol. 1978a;178:711–740. doi: 10.1002/cne.901780408. [DOI] [PubMed] [Google Scholar]
- Haberly LB, Price JL. Association and commissural fiber systems of the olfactory cortex of the rat. II. Systems originating in the olfactory peduncle. J Comp Neurol. 1978b;181:781–808. doi: 10.1002/cne.901810407. [DOI] [PubMed] [Google Scholar]
- Illig KR. Projections from orbitofrontal cortex to anterior piriform cortex in the rat suggest a role in olfactory information processing. J Comp Neurol. 2005;488:224–231. doi: 10.1002/cne.20595. [DOI] [PMC free article] [PubMed] [Google Scholar]
- Luskin MB, Price JL. The laminar distribution of intracortical fibers originating in the olfactory cortex of the rat. J Comp Neurol. 1983a;216:292–302. doi: 10.1002/cne.902160306. [DOI] [PubMed] [Google Scholar]
- Luskin MB, Price JL. The topographic organization of associational fibers of the olfactory system in the rat, including centrifugal fibers to the olfactory bulb. J Comp Neurol. 1983b;216:264–291. doi: 10.1002/cne.902160305. [DOI] [PubMed] [Google Scholar]
- Meyer EA, Illig KR, Brunjes PC. Differences in chemo- and cytoarchitectural features within pars principalis of the rat anterior olfactory nucleus suggest functional specialization. The Journal of Comparative Neurology. 2006;498:786–795. doi: 10.1002/cne.21077. [DOI] [PMC free article] [PubMed] [Google Scholar]
- Paxinos G, Watson C. The rat brain in stereotaxic coordinates. Academic Press; San Diego: 1986. [DOI] [PubMed] [Google Scholar]
- Reyher CKH, Schwerdtfeger WK, Baumgarten HG. Interbulbar axonal collateralization and morphology of anterior olfactory nucleus neurons in the rat. Brain Res Bull. 1988;20:549–566. doi: 10.1016/0361-9230(88)90214-6. [DOI] [PubMed] [Google Scholar]
- Schoenfeld TA, Macrides F. Topographical organization of connections between the main olfactory bulb and pars externa of the anterior olfactory nucleus in the hamster. J Comp Neurol. 1984;227:121–135. doi: 10.1002/cne.902270113. [DOI] [PubMed] [Google Scholar]
- Schoenfeld TA, Marchand JE, Macrides F. Topographical organization of tufted cell axonal projections in the hamster main olfactory bulb: An intrabulbar associational system. J Comp Neurol. 1985;235:503–518. doi: 10.1002/cne.902350408. [DOI] [PubMed] [Google Scholar]
- Shipley MT, Ennis M. Functional organization of the olfactory system. J Neurobiol. 1996;30:123–176. doi: 10.1002/(SICI)1097-4695(199605)30:1<123::AID-NEU11>3.0.CO;2-N. [DOI] [PubMed] [Google Scholar]
- Yan Z, Tan J, Qin C, Lu Y, Ding C, Luo M. Precise Circuitry Links Bilaterally Symmetric Olfactory Maps. Neuron. 2008;58:613–624. doi: 10.1016/j.neuron.2008.03.012. [DOI] [PubMed] [Google Scholar]


