Abstract
Individualization of cancer management requires prognostic markers and therapy-predictive markers. Prognostic markers assess risk of disease progression independent of therapy, whereas therapy-predictive markers identify patients whose disease is sensitive or resistant to treatment. We show that an experimentally derived IFN-related DNA damage resistance signature (IRDS) is associated with resistance to chemotherapy and/or radiation across different cancer cell lines. The IRDS genes STAT1, ISG15, and IFIT1 all mediate experimental resistance. Clinical analyses reveal that IRDS(+) and IRDS(−) states exist among common human cancers. In breast cancer, a seven–gene-pair classifier predicts for efficacy of adjuvant chemotherapy and for local-regional control after radiation. By providing information on treatment sensitivity or resistance, the IRDS improves outcome prediction when combined with standard markers, risk groups, or other genomic classifiers.
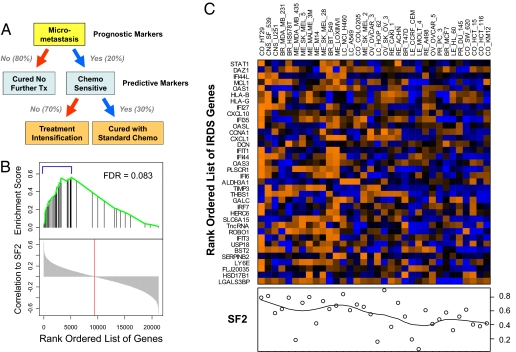
After surgical resection of breast cancer, reducing the risk of death from metastasis with adjuvant chemotherapy (ADCT) and radiation therapy (RT) is proven to result in an absolute survival benefit of ≈5% to 10% (1, 2). For ADCT, this benefit is modest primarily for two reasons. First, only 20% to 30% of treated patients actually have occult metastases and stand to benefit. Second, among the 20% to 30% of patients with occult disease, only 30% have disease that is sensitive to treatment (Fig. 1A). Therefore, the failure to identify patients who do not have occult metastases and/or have disease that is resistant to treatment results in the majority of patients receiving adjuvant therapy without benefit. Furthermore, attempts to intensify therapy to overcome treatment resistance exacerbates the problem of over-treatment because treated patients may either not need therapy or may have shown a response to less intense regimens (Fig. 1A). Thus, to optimally tailor adjuvant therapy for a heterogeneous group of patients, we need to identify a priori which patients are at risk for occult metastasis before adjuvant therapy, and which at-risk patients have disease that is sensitive to the treatment. The former is measured by prognostic markers and the latter by predictive markers, hereafter called therapy-predictive markers.
Fig. 1.
Therapy-predictive markers and the association of the IRDS with resistance to DNA damage. (A) The role of prognostic and therapy-predictive markers in the management of early-stage breast cancer after surgical resection is illustrated. Shown are the approximate percentages of patients expected to fall into each category. (B) Thirty-four cell lines were used in a gene set enrichment analysis (GSEA) to measure the correlation between the 49-gene IRDS and the SF2. The rank-ordered list of Pearson correlations for all 21,225 genes is shown on the bottom half of the graph with zero correlation marked (red line). The position of the IRDS genes in this list is marked in the top half of the graph (black vertical line) along with the corresponding enrichment score (green line) to reflect the degree to which the IRDS genes are over-represented. The false discovery rate (FDR) is shown. The 36 of 49 IRDS genes that are among the top 25% of all genes and considered enriched from the GSEA are indicated (blue bracket) and (C) displayed as rows in the heat map. Gene rows are ordered by correlation to the SF2 with STAT1 having the highest correlation. Cell lines in each column are ordered according to hierarchical clustering using Euclidean distance as a metric. The SF2 for each cell line is shown in the plot below the heat map. Gene expression shown in orange represents high expression and blue low expression. Similar results were obtained by restricting GSEA to the 40 of 49 up-regulated IRDS genes, collapsing probe sets to unique genes, or using the alternative gene set analysis method (P = 0.01, see SI Text).
The majority of standard clinicopathologic factors, risk groups, or genomics-based markers are principally prognostic markers. Clinical and pathological factors such as estrogen receptor (ER) status, tumor size, nodal status, and grade are imperfect but commonly available prognostic markers. Combining these clinicopathological factors can improve estimates for prognosis, as is the case for Adjuvant! Online (AOL), a validated and widely used prognostic tool (3), or St. Gallen criteria, a risk stratification group based on consensus recommendations (4). Further improvements may be seen with genomics-based prognostic tools (5, 6) such as the MammaPrint 70 gene signature (NKI 70), the wound signature, and molecular subtypes, to name a few.
Unlike prognostic markers, few therapy-predictive markers have been reported primarily because they are more difficult to identify than prognostic markers (5). This challenge arises because, if a better outcome is associated with a particular marker in a treated population, it is difficult to determine whether the marker is tracking with good prognosis (i.e., in patients without occult disease) or sensitivity to the treatment (i.e., in patients with occult disease cured by therapy). Nonetheless, prognostic markers and therapy-predictive markers are distinguishable and complementary. Consider patients with occult metastases who are treated with ADCT and cured. Although these patients may have been properly identified as having a poor prognosis by a particular prognostic marker, the accuracy of the prognostic marker is decreased because outcome has been unknowingly altered by therapy. The integration of a therapy-predictive marker will identify these treatment-sensitive patients as those with a better outcome than predicted by the prognostic marker alone. Therefore, combining a therapy-predictive marker with prognostic markers has the effect of increasing the accuracy of outcome prediction by an amount approximately equal to the benefit of the treatment, which for ADCT is approximately 5% to 10%. Importantly, the association of a therapy-predictive marker with clinical outcome principally occurs in the presence but not in the absence of treatment. For prognostic markers, an association is typically seen regardless of treatment.
Previously, we described the IFN-related DNA damage resistance signature (IRDS), an experimentally derived gene-expression profile that is associated with an IFN signaling pathway and with resistance to radiation-induced DNA damage (7). Here we report the existence of an IRDS(+) and IRDS(−) state among a wide variety of primary human cancers. Targeting of IRDS genes can influence experimental resistance to chemotherapy, and a clinical classifier for IRDS status is a therapy-predictive marker of adjuvant therapy for breast cancer.
Results
IRDS Genes Are Associated with Resistance to DNA Damage Across Multiple Cancer Cell Lines and Can Affect Experimental Resistance to Chemotherapy.
The parental SCC61 human squamous cell carcinoma cancer cell line was selected in vivo for resistance to ionizing radiation, resulting in the Nu61 subline that differentially expresses the 49 genes in the IRDS (7). To determine if IRDS genes are more broadly associated with resistance to RT, we analyzed 34 cancer cell lines from the NCI60 panel (8). Thirty-six IRDS genes were among the top 25% of all genes ranked by their correlation with the surviving fraction after 2 Gy of radiation (SF2), a result that is statistically significant based on the enrichment score calculated from gene set enrichment analysis (Fig. 1B). Of these 36 genes, 32 are a subset of the 40 genes up-regulated in the IRDS. Of the IRDS genes, STAT1 showed the highest correlation to the SF2 and ranked in the top 1% of all genes considered (Fig. 1 B and C).
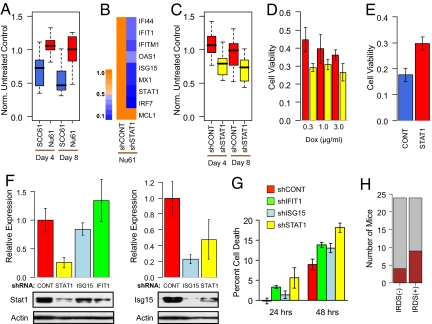
Similar to RT, IRDS(+) Nu61 xenografts are more resistant to doxorubicin chemotherapy compared with IRDS(−) SCC61 tumors (Fig. 2A). Knockdown of STAT1 using stable shRNA led to decreased expression of other IRDS genes (Fig. 2B) and a re-sensitization of Nu61 tumors to doxorubicin in vivo (Fig. 2C) and to RT (9). This re-sensitization was observed over a dose range of doxorubicin (Fig. 2D). Conversely, not only does constitutive expression of STAT1 in parental SCC61 confer resistance to DNA damaging agents as previously shown (7), resistance to doxorubicin can also be transferred to the SKBR3 human breast cancer cell line (Fig. 2E). To test whether other IRDS genes merely act as markers for STAT1 activity or can themselves mediate resistance, we also targeted ISG15 and IFIT1 by shRNA. ISG15 is a ubiquitin-like protein involved in posttranslational modification (10), and IFIT1 has been shown to regulate translation initiation (11). To the best of our knowledge, neither of these genes have been previously implicated in DNA damage resistance, and both of these genes appear to be regulated by STAT1 based on decreased expression resulting from shRNA targeting of STAT1 (Fig. 2 B and F) and induced expression after 5 h of IFN treatment (7). Although knockdown of ISG15 and IFIT1 (≈80% for ISG15 by protein and 90% for IFIT1 by quantitative RT-PCR) had no or only marginal effects on STAT1 levels (Fig. 2F), decreased expression of either gene re-sensitized Nu61 to doxorubicin (Fig. 2G). IRDS expression was not associated with enhanced metastatic ability as determined by lung metastasis assay in mice (Fig. 2H). In total, these results suggest that IRDS genes primarily regulate experimental resistance to DNA damage but not metastasis.
Fig. 2.
IRDS genes influence resistance to chemotherapy. (A) The IRDS(−) SCC61 (blue) and IRDS(+) Nu61 (red) cell lines were xenografted into the flank of nude mice and tumor volume measured after treatment with doxorubicin. Shown is a box-and-whisker plot (P < 0.001 for each time point by Wilcoxon rank-sum test, n = 9–10 for each group). Measurements are expressed relative to untreated controls. (B) STAT1 expression was inhibited in Nu61 using stable shRNA, and resulting expression levels of IRDS genes is indicated by the heat map and legend (showing proportional reduction in gene expression). (C) Nu61 with shRNA to STAT1 (yellow) or a control shRNA (red) were xenografted into mice and treated with doxorubicin as described in A (P < 0.001 for day 4 and P = 0.008 for day 8 by Wilcoxon rank-sum test, n = 14–15 in each group), or (D) treated with the indicated doses of doxorubicin in vitro. Shown is viability by MTS assay at 72 h relative to non-treated control (P < 0.05 for all doses by t test, n = 6 in each group). (E) STAT1 was constitutively over-expressed (47-fold by quantitative RT-PCR) in the SKBR3 human breast cancer cell line (red), and viability after doxorubicin was compared with a vector control (blue, P = 0.004 by t test, n = 3 in each group). (F) Expression of either STAT1 (Left) or ISG15 (Right) was determined by immunoblotting of Nu61 stably expressing a shRNA vector for STAT1 (yellow), ISG15 (light blue), IFIT1 (green), or a non-silencing control (red). Graphs show quantitation of protein levels relative to the control after normalization to actin (mean ± SEM, n = 3–4). A representative blot is shown below each graph. (G) The indicated Nu61 shRNA cell lines were treated with doxorubicin, and percent cell death was measured by subG1 content (mean ± SD, n = 3). (H) The SCC61 cell line (IRDS(−)) and Nu61 cell line (IRDS(+)) were assayed for lung metastasis. Shown is a stacked bar plot of the number of mice with gross lesions (brown) and no lesions (gray) between the two groups (P = 0.19 by Fisher's test).
Expression of the IRDS Across Various Primary Human Cancers.
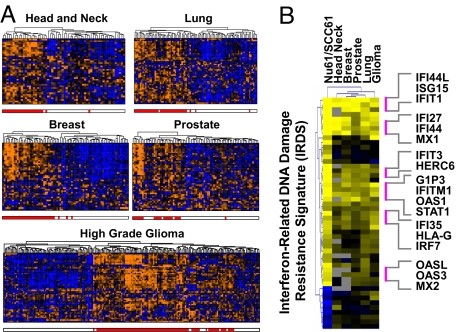
Given that IRDS genes can associate with resistance across cell lines of different cancer types, we explored whether the expression profile of IRDS genes found in different primary human tumors might resemble either Nu61 or SCC61. Individual patient samples from DNA microarray databases from a variety of different cancers (breast, head and neck, prostate, lung, glioma) were directly compared with the IRDS gene profiles from Nu61 and SCC61 by using rank correlation analysis. For each primary cancer type, the IRDS genes were able to divide the tumors into two groups that show similarity to either the Nu61 or the SCC61 profile, which define the IRDS(+) and IRDS(−) cell line states, respectively [supporting information (SI) Fig. S1A]. Motivated by these results, and to avoid the possibility of imposing idiosyncrasies of the cell line data in the class assignment process, we also performed unsupervised clustering using the IRDS genes to divide patient samples from each tumor type into two groups (Fig. 3A). The groups with positive correlation to the Nu61 centroid (r2 = 0.45 to 0.71) are defined to be IRDS(+), which represents 37%, 48%, 29%, 46%, and 50% of head and neck, lung, prostate, breast, and high-grade glioma cases, respectively. The groups correlated with the SCC61 centroid (r2 = 0.41 to 0.65) are defined as IRDS(−). As expected, class assignments made from the clustering approach are highly similar to results from the rank analysis (r2 = 0.56 to 0.90). Particularly high correlation is observed among the 78 patients with breast cancer, with a correlation between the IRDS(+) centroid and the Nu61 centroid of 0.71 and correlation between rank correlation results and clustering results of 0.90 (Fig. 3B and Fig. S1B). For all cancer types, many of the highly correlated genes are known to be involved in the IFN pathway (Fig. 3B). In total, these data demonstrate that IRDS genes can segregate a variety of human cancers into groups resembling either Nu61 or SCC61 in their IRDS profiles, representing IRDS(+) and IRDS(−) states, respectively.
Fig. 3.
The IRDS is expressed by primary breast cancer and a wide variety of other human tumors in a manner resembling Nu61/SCC61. (A) The expression pattern of the IRDS genes among primary human tumors of the indicated type is presented using hierarchical clustering of microarray data. Each column represents a primary tumor and each row an IRDS gene. The red hatch below each dendrogram indicates tumors classified as IRDS(+) based on K-means clustering and comparison to the Nu61/SCC61 centroids (see text and SI Text). Orange indicates high gene expression and blue low. (B) The heat map shows the ratio of the IRDS(+) to IRDS(−) centroids for each of the indicated tumors compared with the ratio of the Nu61 to SCC61 IRDS centroid. Each row is a gene with yellow indicating high expression and blue low expression. Also see Fig. S1.
A Classifier for IRDS Status for Testing as a Therapy-Predictive Marker for Breast Cancer.
The clustering method used to define IRDS status for the 78 patients with breast cancer (Fig. 3A) is not clinically practical for the classification of new samples. Instead, we used this data set to train a classifier to predict IRDS status using the top scoring pairs (TSP) method (12) (see SI Text). This classifier, denoted the TSP IRDS, uses simple non-parametric decision rules by measuring pair-wise relative expression between only seven gene pairs. Each pair contains an IRDS gene and a gene used for comparison. The sum of the results from each pair-wise comparison defines an eight-point ordinal scale from zero to seven, which we denote the TSP IRDS score (Fig. S2A). Notably, STAT1, IFIT1, and ISG15, which all affect experimental resistance to DNA damage (Fig. 2 C–E and G), were selected to be among the seven gene pairs in the classifier.
Given that IRDS genes can mediate experimental resistance to DNA damaging agents but is insufficient for metastasis, this provides a biological basis for testing the IRDS as a therapy-predictive marker for ADCT. To investigate this clinically, the following statistical expectations for a therapy-predictive marker were tested (see Introduction): (i) there is an interaction between the IRDS and whether patients receive ADCT (i.e., the effects of IRDS status on patient outcome depends on use of ADCT), (ii) the accuracy of outcome prediction for treated patients is improved when prognostic markers are combined with the IRDS by an amount approximately equal to the absolute benefit of treatment, and (iii) the IRDS can integrate into commonly used prognostic classifiers to identify patients with poor prognosis who are rendered low risk with adjuvant therapy.
The IRDS Is a Therapy-Predictive Marker for ADCT.
To statistically examine the IRDS as a therapy-predictive marker, a data set of 295 patients with early-stage breast cancer (NKI295) was analyzed (6). To test for an interaction between the IRDS and ADCT, a multivariable Cox proportional-hazards model for metastatic risk was used. This analysis reveals a hazard ratio of 1.2 (i.e., a 1.2-fold increased risk of metastasis for each incremental increase in the TSP IRDS score from 0 to 7) specifically when an interaction with chemotherapy is considered (P = 0.05; Table S1). These results suggest that an association of the IRDS with clinical outcome depends on the use of ADCT.
The TSP IRDS shows moderate association with some standard clinical prognostic markers and other genomic classifiers (Table S2 and Fig. S2B). If the TSP IRDS is a therapy-predictive marker, it should add unique information when combined with prognostic markers and improve prediction accuracy among treated patients. How to test this hypothesis is not straightforward. The use of Cox models has known limitations that include relying on restrictive assumptions and concerns about the correct modeling of interactions and non-linear effects. Furthermore, for judging the predictive value of a new tumor marker, P values for calculated hazard ratios derived from Cox regression are mathematically unrelated to prediction (13). Our analysis method of choice is a multivariable random survival forest (RSF) analysis (see SI Text). RSF is a non-parametric ensemble partitioning tree method for survival data that automatically estimates non-linear effects for variables and multi-way interactions between variables, and is capable of imputing missing data (14). To properly measure the effect of the TSP IRDS and other variables on prediction accuracy, we calculate an importance score, which is a metric of how much the error rate of a model is improved by addition of each variable (more influential factors have higher scores). For comparison, results using Cox regression modeling are also shown throughout the article.
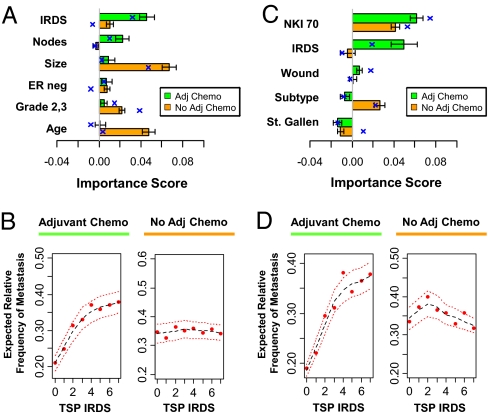
Among patients who received ADCT (see Table S3 for patient characteristics), a model that combines the TSP IRDS with standard clinicopathological factors reveals that the TSP IRDS has an importance score of ≈0.05 (Fig. 4A, green bar plot and blue crosses), meaning that the addition of the TSP IRDS to standard clinicopathological factors decreases the prediction error by 5%. This value for the importance score is within the expected range for a therapy-predictive marker of ADCT for early-stage breast cancer (i.e., approximately equal to the absolute benefit for ADCT). As expected, even after adjusting for other covariates and interactions, increasing TSP IRDS leads to a sharp increase in metastasis risk (Fig. 4B, Left). In contrast, among patients who do not receive ADCT, the TSP IRDS contributes significantly less to prediction (Fig. 4A, orange) and demonstrates no relationship to metastatic risk (Fig. 4B, Right). Standard clinicopathological factors contribute to prediction accuracy and/or associate with metastasis risk in an expected way regardless of treatment, confirming their primary role as prognostic markers (Fig. 4A and Fig. S3A). Similar results for the TSP IRDS are seen specifically among patients receiving ADCT when the TPS IRDS is combined with genomics-based markers (Fig. 4 C and D). The NKI 70, wound, and molecular subtypes are best defined as prognostic markers given their association with risk regardless of treatment (see Fig. S3B). In total, these results suggest that the TSP IRDS is a unique genomic classifier that increases the accuracy of outcome prediction not as a prognostic marker but as a therapy-predictive marker.
Fig. 4.
The IRDS is a therapy-predictive marker for ADCT. The 110 patients treated with ADCT (green) and the 185 patients not treated with ADCT (orange) from the NKI295 data set were separately analyzed using either a RSF analysis (see text) or Cox regression. The TSP IRDS was combined with (A and B) standard clinicopathological factors or (C and D) clinical risk groups [St. Gallen criteria (4)] and other gene expression signatures (NKI 70, wound, and molecular subtype). (A and C) The contribution of each covariate to overall prediction accuracy of each full model is measured by its importance score (see text). Importance scores from RSF analysis are shown by the horizontal bar plot (mean ± SD) and mean importance scores from Cox regression are superimposed (blue cross). (B and D) The partial plots show expected relative frequency of metastasis as a function of the TSP IRDS score after adjusting for all other covariates and interactions. The estimated risk is shown (red dot) with a Lowess regression (black dashes) ± 2SE (red dashes). See Fig. S3 for partial plots of other covariates. The prediction errors for the RSF models for A and C in the absence of ADCT are 30.7% and 35.9%, respectively, and in the presence of ADCT are 35.7% and 37.3%, respectively. The prediction errors for the Cox models for A and C in the absence of ADCT are 32.5% and 31.5%, respectively, and in the presence of ADCT are 34.5% and 32.5%, respectively.
The IRDS Can Integrate with Existing Prognostic Tools to Identify High-Risk Patients Rendered Low Risk by ADCT.
As a therapy-predictive marker, the IRDS is expected to identify patients who have outcomes better than predicted by prognostic markers as a result of successful treatment. To test this, we used the 2005 St. Gallen consensus criteria, the NKI 70 gene signature, or AOL to identify poor prognosis patients. IRDS status was assigned using a conservative TSP IRDS cut-off of <2 for IRDS(−) and ≥2 for IRDS(+) (see partial plots for metastasis risk as a function of TSP IRDS in Fig. 4 B and D and SI Text).
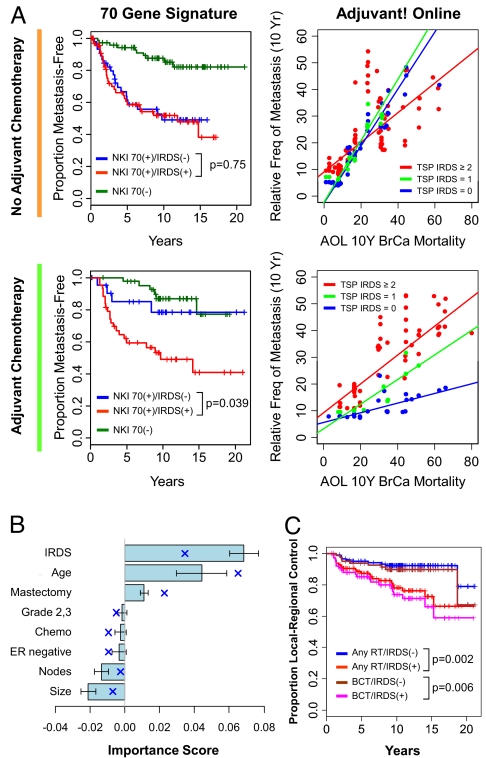
In the absence of ADCT, IRDS status is not prognostic among patients with a poor prognosis according to NKI 70 (i.e., NKI 70(+)) or St. Gallen consensus criteria (Fig. 5 and Fig. S4). However, patients at high risk who are IRDS(−) and receive ADCT have an outcome better than their IRDS(+) counterparts and similar to those patients at low risk. Similarly, in the absence of ADCT, the estimated 10-year risk for metastasis is comparable to the predicted AOL risk regardless of IRDS status. In contrast, risk among patients with low TSP IRDS scores (either 0 or 1) who received ADCT is markedly lower than predicted by AOL across a wide range of AOL 10-year risk estimates. In total, these data demonstrate that the IRDS can be integrated with available prognostic tools to identify patients at risk for distant relapse who can be rendered low risk by ADCT.
Fig. 5.
The IRDS predicts sensitivity to ADCT among patients at risk for metastasis and predicts local-regional failure after adjuvant RT. (A) Each of the 185 patients who did not receive ADCT (grouped beside the orange line) or the 110 patients who received ADCT (grouped beside the green line) were classified using the NKI 70 gene signature as having a good prognosis [NKI 70(−)] or a poor prognosis [NKI 70(+)]. NKI 70(+) patients were further split by IRDS status. TSP IRDS scores of <2 and ≥2 were used to define IRDS(−) and IRDS(+), respectively. Shown on the left are the metastasis-free survival curves. The log-rank P values compare the groups stratified by IRDS. Adjuvant! Online (AOL) mortality score and the TSP IRDS were used in an RSF model. Shown on the right are the predicted 10-year relative frequency of metastasis as a function of AOL score. IRDS(+) patients are in red, patients with a TSP IRDS of 1 are in green, and patients with a TSP IRDS of 0 are in blue. Regression lines through these points are displayed. The prediction errors of the RSF model are 37.9% for no ADCT and 39.2% for ADCT. (B) The 243 patients who received adjuvant RT were analyzed using RSF for local-regional control (LRC). The importance scores from an RSF model for the indicated covariates are shown (mean ± SD) and the mean importance scores from Cox regression are superimposed (blue cross). The error rate for the full RSF model is 38.7% and for the Cox model is 30.8%. (C) Shown is LRC stratified by IRDS status for the patients receiving adjuvant RT after breast conservation or mastectomy (any RT), or the 161 patients receiving RT after breast conservation therapy only.
IRDS Predicts Recurrence After RT.
Adjuvant RT reduces the risk of local-regional failure (LRF) following breast conservation therapy or mastectomy (1). As a mediator of DNA damage resistance, the IRDS should predict LRF after adjuvant RT. In a multivariable Cox model, the IRDS is independently associated with LRF (Table S4). Analysis of importance scores using RSF or a Cox model reveals that the IRDS significantly contributes to prediction accuracy for LRF (Fig. 5B). IRDS(+) patients who received adjuvant RT exhibit a high rate of LRF (Fig. 5C). Evaluation of patients not receiving adjuvant RT was not possible in this cohort because there are few events in the minority of patients who underwent mastectomy without RT (but see metaanalysis described later). However, a 30% to 40% LRF rate at 10 years, as seen with IRDS(+) patients, is within the expected range for patients who exhibit complete resistance to adjuvant RT (15).
Independent Validation of the IRDS and Metaanalysis.
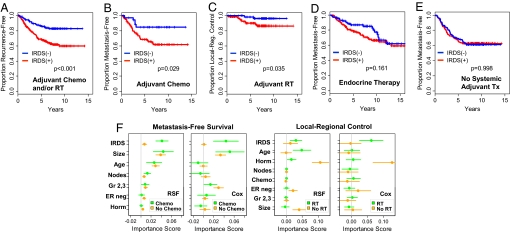
To validate the properties of the IRDS, several independent breast cancer data sets were assembled (see Table S5). Cohort A is comprised of 292 patients from the Radcliffe, University of California San Francisco, and Stockholm data sets who all received ADCT and/or RT and was used to validate that the IRDS is a therapy-predictive marker for DNA damaging agents. For each of the three data sets in cohort A, a higher TSP IRDS is associated with a higher risk for distant failure and/or LRF, which is similar to results from the NKI295 (Table S6). Survival analysis of all patients from cohort A reveals that the IRDS(−) group has a markedly better recurrence-free survival compared with IRDS(+) patients (Fig. 6A). This improvement in recurrence-free survival is a result of both fewer distant relapses among the IRDS(−) patients treated with ADCT and lower LRF among IRDS(−) patients treated with adjuvant RT (Fig. 6 B and C). Analysis using cohort B, which consists of 277 patients who received only endocrine therapy as adjuvant systemic treatment (Fig. 6D), and cohort C, which is composed of 286 patients who did not receive adjuvant systemic treatment (Fig. 6E), confirms that the IRDS is neither a therapy-predictive marker for endocrine therapy nor prognostic for distant failure in the absence of ADCT. A similar lack of therapy-predictive effect with endocrine therapy or prognostic effect was noted for two additional cohorts (Fig. S5).
Fig. 6.
Validation of the IRDS as a therapy-predictive marker for ADCT and/or radiation. Breast cancer patients from cohorts A, B, and C were used for validation of the IRDS (see Table S5). (A) Recurrence-free survival from metastasis and/or LRF as a first event for cohort A. All patients received ADCT and/or RT. (B) Patients who received ADCT and (C) patients who received adjuvant RT were separately analyzed for metastasis-free survival (MFS) or local-regional control, respectively. (D) MFS for cohort B, which received only endocrine therapy for adjuvant systemic treatment, and (E) MFS for cohort C, which received no adjuvant systemic therapy. (F) A merged set of 1,573 patients was used in a metaanalysis. Shown are bootstrap means ± SEs for the importance scores of the indicated covariates using either RSF or Cox regression models (see text and Fig. S7).
The NKI295, Radcliffe, University of California San Francisco, and Stockholm data sets were also used to validate the predictiveness of the IRDS by using each individual data set as a test set for a model trained on the other three. The patients from these four data sets differed in treatment regimens (e.g., cyclophosphamide/methotrexate/5-fluorouracil vs. an anthracycline regimen; Table S7) and patient characteristics. Nonetheless, for each of these data sets, the TSP IRDS improves prediction accuracy for metastasis-free survival and local-regional control for patients treated with ADCT or RT, respectively (Fig. S6). Importantly, as the TSP IRDS improves prediction in each test set, these results are unlikely a result of a confounding latent variable because it would have to be the same latent variable in all of the cohorts.
To provide best estimates of importance scores and their sampling error, and to test for effects of cohort heterogeneity, all data sets used in validation were combined with the NKI295, resulting in 1,573 patients. By using RSF we were able to perform a non-stratified metaanalysis whereby all 1,573 patients were analyzed simultaneously but the effects of treatment were extracted. Unlike with Cox regression, this non-stratified analysis is possible because of the ability of RSF to automatically model all possible interactions between variables. Bootstrap means and SEs for variable importance scores for metastasis-free survival confirm high values for the IRDS, specifically among patients treated with ADCT (Fig. 6F). Well established prognostic factors show importance scores of comparable magnitude regardless of treatment. Few or no cohort effects were seen, indicating that an adequate level of homogeneity across institutes was observed, and our analysis accounts for differences in these cohorts (Fig. S7A). Confirmation that the IRDS is a therapy-predictive marker is similarly seen with RT. Results from Cox regression, which are necessarily stratified by treatment and devoid of interaction effects between variables, are shown for comparison. Notable are the 3% to 8% gains in prediction accuracy for RSF over Cox regression (Fig. S7B). In total, these results suggest that the IRDS is a therapy-predictive marker that performs across patient populations that may differ in baseline characteristics and treatment.
Discussion
We and others have shown that STAT1 and IFN genes can normally be induced as part of the cellular response to DNA damage (9, 16). In previous work, we demonstrated that sensitivity to DNA damage is coupled with sensitivity to IFNs such that selection for resistance to one leads to resistance to the other (9). These observations have led to the proposal that, under most situations, the STAT1/IFN pathway transmits a cytotoxic signal either in response to DNA damage or to IFNs. In contrast, cells that are IRDS(+) show constitutive activation of the STAT1/IFN pathway and may reflect a history of chronic stimulation. This chronically activated state might have selected for the failure to transmit a cytotoxic signal and instead results in pro-survival signals mediated by STAT1 and other IRDS genes. Here, we further strengthen the notion that IRDS(+) tumors reflect this latter phenotype and demonstrate the impressive frequency by which this pathway is distinguishable among the most common human cancers.
The combined clinical and laboratory data strongly indicate that the IRDS is principally a therapy-predictive marker for DNA damaging agents. How might the IRDS contribute to clinical management? The decision to undergo adjuvant treatment is often based on the risk for recurrence and how much therapy will reduce this risk. Current methods to assess the reduction in risk from adjuvant treatment are not individualized and generally based on proportional risk reductions from metaanalysis (2). Fig. 5A highlights how the IRDS can influence decision making. For example, assuming a patient has an estimated 10-year risk of breast cancer mortality of 20%, knowing that chemotherapy effectively reduces this to approximately 5% will make the decision to undergo treatment easier for many. Furthermore, most patients identified by the IRDS to be sensitive to ADCT were treated with cyclophosphamide/methotrexate/5-fluorouracil, suggesting that the IRDS can help patients avoid the additional toxicities of anthracyclines and taxanes. Conversely, knowledge that chemotherapy will be ineffective may compel patients to accept more aggressive therapies. Others may forego adjuvant treatment altogether.
Materials and Methods
Study Populations.
See Tables S2 and S8 and SI Text for further details on all clinical and microarray data.
Cell Line and Animal Experiments.
Derivation of Nu61 from the SCC61 cell line, analysis of the IRDS, and mouse xenografting have been described (7). For additional information, including Tables S9 and S10, please see SI Text.
Statistical Analysis.
See SI Text for full details.
Supplementary Material
Acknowledgments.
We thank Samuel Hellman for his invaluable discussions. We also thank Ming-Chung Li, Vanessa Salcedo, Tony Wu, and Michael Beckett for technical assistance. This work was supported by a grant from the American Society of Therapeutic Radiology and Oncology and the Schweppe Foundation (to A.J.M.), the Ludwig Institute for Cancer Research (A.J.M. and R.R.W.), and National Institutes of Health Grants HL-072771 (to H.I.), CA113662 (to R.R.W. and N.K.), CA071933 (to R.R.W. and N.K.), CA111423 (to R.R.W.), and CA090386 (to R.R.W.).
Footnotes
The authors declare no conflict of interest.
This article contains supporting information online at www.pnas.org/cgi/content/full/0809242105/DCSupplemental.
References
- 1.Clarke M, et al. Effects of radiotherapy and of differences in the extent of surgery for early breast cancer on local recurrence and 15-year survival: an overview of the randomised trials. Lancet. 2005;366:2087–2106. doi: 10.1016/S0140-6736(05)67887-7. [DOI] [PubMed] [Google Scholar]
- 2.Early Breast Cancer Trialists Collaborative Group. Effects of chemotherapy and hormonal therapy for early breast cancer on recurrence and 15-year survival: an overview of the randomised trials. Lancet. 2005;365:1687–1717. doi: 10.1016/S0140-6736(05)66544-0. [DOI] [PubMed] [Google Scholar]
- 3.Olivotto IA, et al. Population-based validation of the prognostic model ADJUVANT! for early breast cancer. J Clin Oncol. 2005;23:2716–2725. doi: 10.1200/JCO.2005.06.178. [DOI] [PubMed] [Google Scholar]
- 4.Goldhirsch A, et al. Meeting highlights: international expert consensus on the primary therapy of early breast cancer 2005. Ann Oncol. 2005;16:1569–1583. doi: 10.1093/annonc/mdi326. [DOI] [PubMed] [Google Scholar]
- 5.Sotiriou C, Piccart MJ. Taking gene-expression profiling to the clinic: when will molecular signatures become relevant to patient care? Nat Rev Cancer. 2007;7:545–553. doi: 10.1038/nrc2173. [DOI] [PubMed] [Google Scholar]
- 6.van de Vijver MJ, et al. A gene-expression signature as a predictor of survival in breast cancer. N Engl J Med. 2002;347:1999–2009. doi: 10.1056/NEJMoa021967. [DOI] [PubMed] [Google Scholar]
- 7.Khodarev NN, et al. STAT1 is overexpressed in tumors selected for radioresistance and confers protection from radiation in transduced sensitive cells. Proc Natl Acad Sci USA. 2004;101:1714–1719. doi: 10.1073/pnas.0308102100. [DOI] [PMC free article] [PubMed] [Google Scholar]
- 8.Torres-Roca JF, et al. Prediction of radiation sensitivity using a gene expression classifier. Cancer Res. 2005;65:7169–7176. doi: 10.1158/0008-5472.CAN-05-0656. [DOI] [PubMed] [Google Scholar]
- 9.Khodarev NN, et al. Signal transducer and activator of transcription 1 regulates both cytotoxic and prosurvival functions in tumor cells. Cancer Res. 2007;67:9214–9220. doi: 10.1158/0008-5472.CAN-07-1019. [DOI] [PubMed] [Google Scholar]
- 10.Zhao C, Denison C, Huibregtse JM, Gygi S, Krug RM. Human ISG15 conjugation targets both IFN-induced and constitutively expressed proteins functioning in diverse cellular pathways. Proc Natl Acad Sci USA. 2005;102:10200–10205. doi: 10.1073/pnas.0504754102. [DOI] [PMC free article] [PubMed] [Google Scholar]
- 11.Hui DJ, Bhasker CR, Merrick WC, Sen GC. Viral stress-inducible protein p56 inhibits translation by blocking the interaction of eIF3 with the ternary complex eIF2. GTP.Met-tRNAi. J Biol Chem. 2003;278:39477–39482. doi: 10.1074/jbc.M305038200. [DOI] [PubMed] [Google Scholar]
- 12.Tan AC, Naiman DQ, Xu L, Winslow RL, Geman D. Simple decision rules for classifying human cancers from gene expression profiles. Bioinformatics. 2005;21:3896–3904. doi: 10.1093/bioinformatics/bti631. [DOI] [PMC free article] [PubMed] [Google Scholar]
- 13.Katz EM, Kattan MW. How to judge a tumor marker. Nat Clin Pract Oncol. 2005;2:482–483. doi: 10.1038/ncponc0318. [DOI] [PubMed] [Google Scholar]
- 14.Ishwaran H, Kogalur UB, Blackstone EH, Lauer MS. Random survival forests. Ann Appl Stat. 2008;2:841–860. [Google Scholar]
- 15.Fisher B, et al. Reanalysis and results after 12 years of follow-up in a randomized clinical trial comparing total mastectomy with lumpectomy with or without irradiation in the treatment of breast cancer. N Engl J Med. 1995;333:1456–1461. doi: 10.1056/NEJM199511303332203. [DOI] [PubMed] [Google Scholar]
- 16.Tsai MH, et al. Gene expression profiling of breast, prostate, and glioma cells following single versus fractionated doses of radiation. Cancer Res. 2007;67:3845–3852. doi: 10.1158/0008-5472.CAN-06-4250. [DOI] [PubMed] [Google Scholar]
Associated Data
This section collects any data citations, data availability statements, or supplementary materials included in this article.


