Abstract
Imaging MS (IMS) is an emerging technology that permits the direct analysis and determination of the distribution of molecules in tissue sections. Biological molecules such as proteins, peptides, lipids, xenobiotics, and metabolites can be analyzed in a high-throughput manner with molecular specificity not readily achievable through other means. Tissues are analyzed intact and thus spatial localization of molecules within a tissue is preserved. Several studies are presented that focus on the unique types of information obtainable by IMS, such as Aβ isoform distributions in Alzheimer's plaques, protein maps in mouse brain, and spatial protein distributions in human breast carcinoma. The analysis of a biopsy taken 100 years ago from a patient with amyloidosis illustrates the use of IMS with formalin-fixed tissues. Finally, the registration and correlation of IMS with MRI is presented.
Keywords: MALDI, molecular histology
Protein analysis is a vital part of the process of investigation and understanding of human disease. The expression of proteins in terms of both qualitative and quantitative aspects, structure, modifications, protein–protein and protein–liquid interactions, spatial distribution, and temporal behavior all constitute essential aspects of the study of proteins. Several commonly used technologies that can assess these various aspects of protein structure and function include 2D gel electrophoresis, MS, and fluorescence- and affinity-based techniques. However, as studies progress and more complex and detailed questions are asked at the molecular level, it is clear that new enabling approaches are needed that transcend the limitations of current technologies. In this article, we describe our own current work involving the study of proteins using imaging and profiling MALDI MS in the analysis of tissue sections. This is not a review of the field of imaging MS (IMS) (see ref. 1 for such a review).
MS Technology
The use of MS for the molecular image analysis of samples has been known for decades for the analysis of elements and small organic molecules. Secondary ion MS and laser desorption MS have been effectively used in this manner for >20 years (2). However, these techniques have not been effective for the image analysis of polypeptides and proteins.
Direct analysis of tissues of biological and clinical interest using MALDI MS has been shown to be successful for the study of the mid- to low molecular weight proteome. Because this technology analyzes intact tissue, avoiding homogenization and separation steps, the spatial distribution of molecules within the tissue is preserved. The process is relatively simple in that a matrix (typically a small aromatic organic molecule dissolved in an organic solvent) is deposited on top of a tissue section followed by irradiation with a laser (e.g., nitrogen, 337 nm or Nd:YAG, 355 nm). Molecules are subsequently desorbed and ionized (3). MALDI is often coupled with TOF mass analyzers in which ions are accelerated at a fixed potential, traverse a field free drift region (flight tube) where they become separated in time based on their m/z ratio and are subsequently detected. Because to a close approximation the total energy of the ions is the same, ions of lower m/z traverse the flight tube more quickly than those of higher m/z. Ion flight times are recorded and then are converted to m/z through calibration with species of known molecular mass. A major advantage of TOF analysis is that the mass range is virtually unlimited with analytes >200 kDa capable of being measured (4).
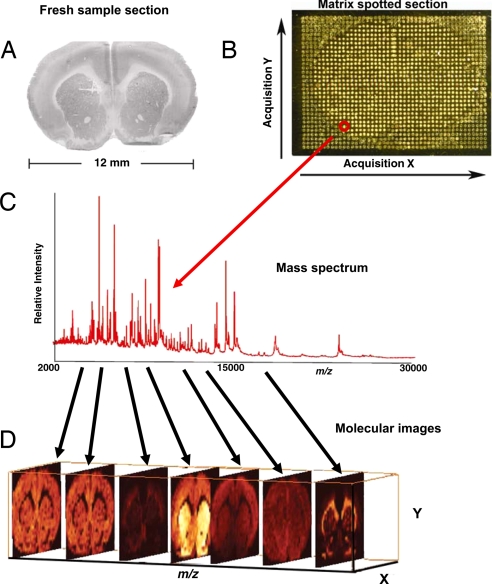
Image analysis of discrete molecules in tissue can be acquired by using MALDI MS to determine their spatial localization with a lateral resolution of 10–100 μm. A thin (≈10 μm) (5) tissue section is collected on a target plate, and matrix is applied over the surface of the tissue by a robotic liquid dispensing device followed by desorption, ionization, and separation processes. Spectra are recorded in a systematic fashion over the tissue by moving the sample stage underneath a fixed laser beam. Thus, a spot array over the entire sample then constitutes the image dataset analogous to pixels in a digital photograph. Each laser-irradiated spot (pixel) gives rise to a mass spectrum that is correlated to discrete a X,Y coordinate location on the tissue. Thus each spot or pixel contains a dataset having thousands of channels (m/z values) with each channel having its own brightness (intensity). The intensity of each m/z value can be expressed over the array of pixels as a 2D ion density map. Commercial or custom software can be used to generate images depicting the localization and relative intensities of hundreds of ions in a single acquisition from a tissue section. Fig. 1 shows the workflow of the imaging process using the example of a coronal section of rat brain.
Fig. 1.
Work flow of an IMS experiment. (A) A tissue section is collected on a conductive MALDI plate. (B) Matrix is deposited in a uniform manner over the surface of the tissue. (C) Spectra are acquired from each location (pixel) over the surface of the tissue. (D) 2D ion density images are reconstructed from the spectra. Hundreds of protein images can be created from a single 12-μm-thick section of tissue from a single acquisition.
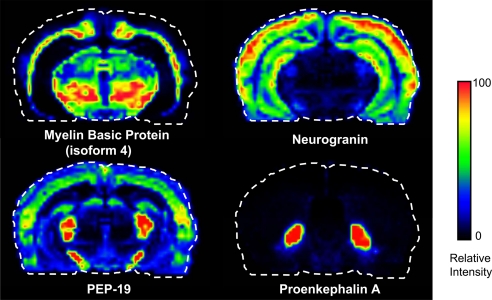
The measurement of the molecular mass of a given protein does not necessarily provide its unique identification and so further measurements are necessary. One approach involves extraction of the protein from tissues followed by separation by reversed-phase chromatography. Fractions containing the protein of interest are purified on a 1D SDS polyacrylamide gel, and the band of interest is cut out, digested, and identified by peptide mass fingerprinting and MS/MS sequencing of the peptides. Alternatively, for identification of targeted proteins, in situ tryptic digestion of a spot on a tissue followed by peptide sequencing of a predicted fragment by MALDI MS/MS can be done (6). Protein identifications may be further verified with classical immunohistochemical staining when such reagents are available for a given protein. Several medium-resolution (≈200 μm) images obtained from this technology from a coronal rat brain section are shown (Fig. 2) for proteins indentified from in situ digestion.
Fig. 2.
Coronal rat brain images of four different proteins showing very different distributions throughout the brain. These images were constructed from a dataset obtained from pixels (matrix spots) of ≈180 μm in diameter located in an ordered array 200 μm apart (center to center).
IMS can also be used in a “profiling” mode in cases where only discrete spots are of interest and high-resolution images are not needed. This approach has the advantage of rapid acquisition times and smaller data files. Matrix is deposited in the desired locations on a tissue section by using a robotic spotting device. Often histological staining, either on the same section (7) or a serial section (8–10), is used to guide the placement of matrix and provides the capability of focusing on areas having a high content of a cell type of interest. Because the technology allows acquisition and movement from spot to spot in a few seconds or less, many locations can be analyzed from a single section while still maintaining spatial localization through registration protocols. Profiling may be considered a low-resolution survey analysis of predefined areas within the tissue.
Sample Preparation
Sample handling and preparation are critical for achieving good spectral quality and reproducibility. Tissue samples must be promptly dissected followed by flash freezing in liquid nitrogen within minutes. Quick freezing of tissues helps preserve the molecular state at the time of resection and prevents degradative processes.
Tissue collection protocols should be standardized in any given study to prevent introduction of artifacts that may give rise to differences caused by sample handling. Sections should be gently placed onto a cold target surface to help reduce protein degradation while allowing control over placement and orientation of the samples on the target, important for high-throughput analyses with many samples on a single target. Additionally, the tissue section should be dried for ≈10 min in a vacuum desiccator immediately after sectioning to remove residual water from the tissue.
The intensities of protein signals can be maximized through a gentle chemical fixation protocol using graded alcohol washes (11) that serves to locally fix or precipitate proteins while greatly reducing the amount of biological salts and lipids that can subsequently interfere with analysis. A systematic study was carried out in our laboratory in which a number of different solvents were tested in terms of their effects on tissue preservation and influence on the MALDI MS signals observed. Fixation using graded isopropanol resulted in excellent preservation of the tissue with a spectrum acquired 2 weeks after sectioning virtually identical to that obtained the same day of sectioning (12).
Matrix application is critical for achieving high-quality, reproducible spectra, and several approaches may be used, depending on the final result desired. The easiest and quickest of these if only a few spots are to be analyzed is manual application with a pipette, generally used in simple profiling experiments. However, it suffers from creating a relatively large spot diameter (1–2 mm), poor reproducibility of matrix coverage, and a more variable mass spectral signal. A second approach uses a robotic spotter that allows for greater control over the location of matrix deposition and a much smaller spot size (80- to 200-micron spot diameter). There are two main technologies for robotic matrix spotting: acoustic deposition (13) or inkjet printing (14, 15), both of which can either be printed in ordered arrays or deposited at discrete locations, for example, through correlation with histological staining (16). Robotic spotting leads to robust mass spectral signals with high reproducibility. The user is limited in spatial resolution for imaging to roughly the size of the matrix spots on tissue. A third matrix application option is the homogenous spraying of matrix over the surface of the tissue section. This can be achieved manually through use of a TLC reagent sprayer (11) or robotic spray deposition devices (17) where a homogenous field of small (1–20 μm in length) matrix crystals is deposited. The lateral resolution of the images produced in this process depends on the size of the laser ablation area. Care must be taken when spraying not to overwet the tissue as this may lead to delocalization of analytes. Manual spraying techniques generally suffer from poorer reproducibility relative to that obtained with computer-controlled robotic sprayers.
The choice of matrix and solvent has an impact on the analytes that are ionized. Protein analysis is most frequently carried out with tissues prepared by using sinapinic acid (SA) as the matrix in 50–60% acetonitrile. This protocol tends to give the best protein extraction, sensitivity, and resolution for high molecular mass species (>5,000 Da). For peptide analyses in tissue (6, 18), α-cyano-4-hydroxycinnamic acid or 2,5-dihydroxybenzoic acid (DHB) in 50% acetonitrile is preferred. These matrices tend to have less chemical interference in the lower molecular weight range and higher sensitivity. For lipid analysis, DHB and 2,6-dihydroxyacetophenone (DHA) in 60–70% ethanol are commonly used (19). DHA can be used for both positive and negative ionization mode analysis. Other low molecular weight compounds may require optimization through testing several different matrix and solvent combinations because the specific chemistries of small molecules such as drugs and metabolites can vary widely.
Histology-Directed MS Profiling
We have recently developed a technique termed histology-directed protein profiling (16) as a way of marrying traditional histologic approaches for disease detection and diagnosis with MALDI IMS. Briefly, a section of tissue is collected on a glass target plate for histological staining and MALDI analysis. For certain mass spectrometers using high-voltage sources, the glass slide surface must be electrically conductive, e.g., coated with indium tin oxide. Histologic stains such as cresyl violet and methylene blue as well as others are compatible with MS and provide high-quality stain characteristics for many tissue types (7). H&E staining cannot be used if MS is to be carried out on the same section, so serial sections should be used. Generally, the procedure used for histology-directed MS profiling is as follows. A photomicrograph of the stained slide is reviewed by a pathologist, and each area of interest is digitally marked (color coding links areas having similar cell types). The histology-annotated optical images are merged to a photomicrograph of the section on the MALDI target, and the pixel coordinates of the annotated areas are obtained. Through registration points, coordinates are transferred to a robotic spotter, matrix is deposited at the desired locations, and the coordinates of the spots are transferred to the mass spectrometer for spectral acquisition. Data acquisition is extremely fast: a biopsy when 10 discrete areas of tissue are analyzed, each consisting of 10 ablation areas within each spot and using 100 shots per ablation area would take only a few minutes to acquire. After data acquisition, mass spectra are preprocessed (baseline subtraction, normalization, peak detection, and alignment) before biostatistical analysis (20, 21). IMS has the advantage of discovery as well in this approach because it does not use a target-specific reagent such as an antibody and therefore lends itself to the study of unknown molecular events in disease.
Previous reports (11) have used fresh frozen tissues for MALDI profiling and imaging and, indeed, this type of sample is best from the point of view of native molecular discovery. However, recent work has included the analysis of optimal cutting temperature (OCT) polymer-embedded tissue with several large studies carried out on cohorts consisting entirely of embedded samples. This OCT protocol is used in histology laboratories because it simplifies cryosectioning by making the tissue rigid. To minimize interference of OCT polymer with the protein signal, steps should be taken to reduce the OCT associated with the sample. These include trimming most of the OCT away from the edges of the tissue with a razor blade or a scalpel before sectioning and fixing tissue sections with graded ethanol washes before matrix application and MS analysis. This washing step helps to remove OCT that may have been dispersed across the surface of the tissue while cutting. With this protocol, spectra obtained from OCT-embedded samples are virtually identical to those obtained from fresh frozen tissue.
Clinical/Biological Applications
MALDI IMS was initially applied to tissue sections in 1997 (22) and since then has been applied to a wide variety of different tissues and analytical and clinical problems. Normal invertebrate (17) and mammalian tissues (23, 24) have been examined to determine spatial localization of proteins in different structures. The mouse epididymis has been imaged to identify proteins in specific regions of the organ that may be involved in spermatozoa maturation (25). Developmental studies have been carried out involving the maturation of mouse prostate (26) and the implantation process of the mouse embryo (27). A major focus of protein imaging has been in the area of cancer (8, 10, 23, 28–31) where studies have been carried out to improve molecular classification of grade, help predict clinical outcome, and examine molecular tumor margins. Additionally, IMS has been used to determine early markers of nephrotoxicity (32) that may result from drug treatment. Recently, IMS has been applied to whole animal sections to examine protein, drug, and metabolite distributions (33, 34).
A significant advantage of IMS is the capability to distinguish molecular species not easily achievable by other means. Traditionally, drug distribution analysis has been carried out through the use of autoradiography, a method that visualizes a radio tag but not the specific molecular species that carries the tag. In contrast, IMS allows for the simultaneous detection of the drug of interest and its metabolites (33). Confirmation of the identities of these species can be achieved through MS/MS of the compounds of interest directly from the same section.
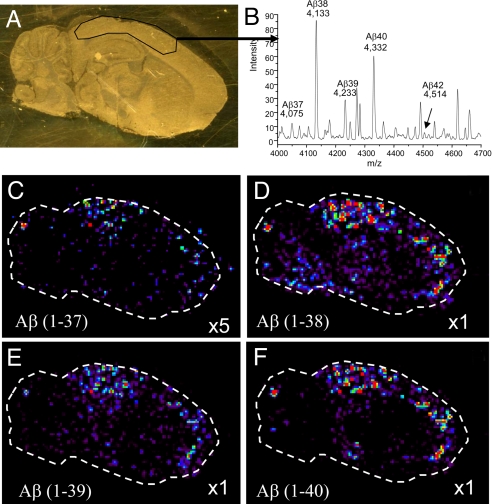
IMS has also been used to distinguish the various truncated molecular forms of β-amyloid plaques in a mouse model of Alzheimer's disease. Traditional analyses of these plaques are carried out through antibody or Congo red staining that provides information on the location of plaques but cannot distinguish the specific molecular species present. Fig. 3 shows four images of different truncations of β-amyloid that are present in an Alzheimer's plaque. Relative intensities of the four species can be seen in the average spectrum of the cortex region of the brain shown in Fig. 3B.
Fig. 3.
IMS allows for distinction of different molecular species of β-amyloid plaques in an Alzheimer's disease model. (A) Optical image of the mouse brain tissue section on a gold-coated MALDI target. Enclosed area is a region of high concentration of β-amyloid plaques. (B) Average spectrum from the selected region of the tissue from A. (C–F) Ion density images of four different truncations of the β-amyloid protein.
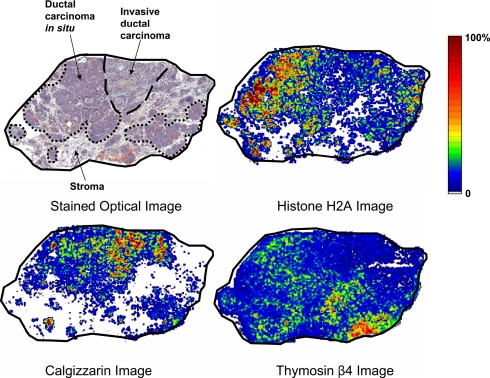
Analysis of human breast carcinoma sections allows visualization of proteins specific to different stages of disease (Fig. 4). The H&E-stained section shows areas of invasive ductal carcinoma, ductal carcinoma in situ, and stroma. Examples are presented for three different proteins that show a higher relative abundance in each of these three different clinical diagnoses. Many hundreds of proteins are equally imaged from a single data acquisition scan.
Fig. 4.
H&E-stained section and mass spectral images of a human breast carcinoma section. The stained section shows areas of invasive ductal carcinoma, ductal carcinoma in situ (DCIS), and stroma. Histone H2A shows the highest abundance in DCIS, calgizzarin in the invasive carcinoma region, and thymosin β4 in stroma.
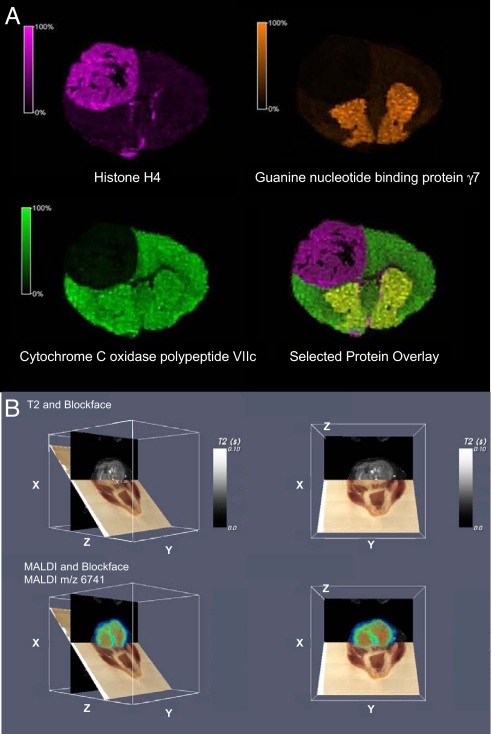
We have investigated the use of IMS for the 3D reconstruction of protein and peptide images within brain structures (18). Such mass spectral images can be correlated with more traditional imaging modalities such as MRI (35). For example, a mouse with a brain tumor derived from implanted human tumor cells was imaged by MRI before being killed. For IMS analyses, the head of the mouse was sectioned in a cryo-microtome at 20-μm thickness and block face images were taken with a digital camera with sections collected every 160 μm for IMS. Using image processing software, the MRI and IMS data were correlated to the block face images in the same rendered volume. Fig. 5B shows examples of the coregistration of MS, MRI, and optical images of the tumor-bearing mouse brain. For comparison, a 2D protein image of the mouse brain section is shown in Fig. 5A.
Fig. 5.
Mouse brain tumor images. (A) Mouse model of human glioma showing proteins that localize to the tumor (histone H4), to the striatum (guanine nucleotide binding protein γ7), and one that is uniformly distributed throughout the normal brain tissue (cytochrome c oxidase polypeptide VIIc). (B) Coregistered block face optical images (brown plane), MRI data (black plane), and protein images (colored plane) from a mouse head with a tumor. Four angles of intersection of the MRI, optical, and MS planes are shown.
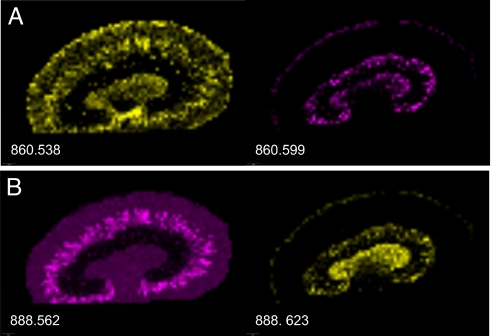
The majority of IMS studies are carried out by using TOF mass analyzers that have a resolving power of up to ≈15,000 for peptides in the range of ≈1,500 Da. Although this technique easily resolves isotopes of a peptide, many species of the same nominal mass cannot be resolved. Fourier transform ion cyclotron resonance (FT-ICR) instruments are capable of achieving a resolving power in excess of 1,000,000 that allows for baseline resolution of species separated in mass by several millimass units or less. Cornett et al. have demonstrated this capability by imaging human breast tissue using an FT-ICR instrument.† Similarly, Fig. 6 shows an example of lipid images for mouse kidney for different molecular pairs having the same nominal mass but different exact masses. As shown in Fig. 6, the localization patterns of the isobaric masses are quite different. Because each of these pairs differ in mass by 0.061 Da, they would appear as a single peak on a TOF analyzer; therefore, their individual spatial distributions could not be differentiated.
Fig. 6.
FT-ICR imaging of a mouse kidney. Two examples (A and B) are shown of lipid species of the same nominal mass, but that display very different spatial distributions. The 0.06-Da mass difference between these species is easily resolved in MALDI-FT-ICR.
The need to extend IMS to fixed and preserved tissue is compelling because the majority of banked human tissue samples are formalin-fixed and paraffin-embedded (FFPE). FFPE tissues present special challenges because the fixation process results in the cross-linking of primary amines and other groups in the proteins. Recent work has demonstrated that it is possible to analyze FFPE tissue that has been subjected to antigen retrieval processes and tissue enzymatic digestion (29). MALDI MS/MS can be carried out directly from the tissue section to sequence the desorbed peptides and subsequently identify the proteins. This process has significant value for clinical diagnostics because the archives of FFPE tissues often are associated with detailed patient information, especially outcomes. The ability to analyze FFPE tissues will enable large-scale studies focused on the discovery of prognostic indicators of disease progression and treatment efficacy.
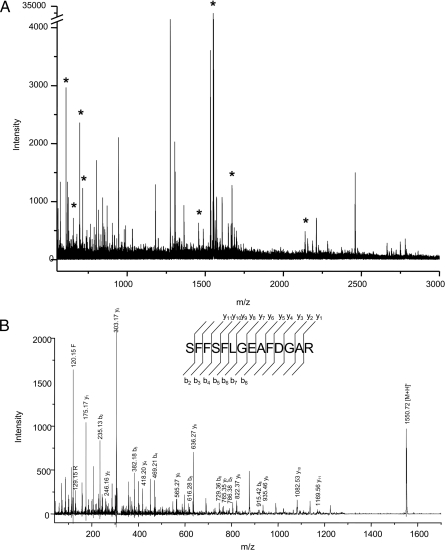
We have used IMS for the analysis of a sample of human spleen resected in 1899 and stored in formaldehyde from a patient believed to have had amyloidosis. Previous analysis of this sample by immunoblotting and amino acid composition analysis indicated that amyloid deposits contained the protein serum amyloid A (36). IMS analysis of peptides obtained from in situ digestion of the sample resulted in the identification of many arginine-containing peptides that matched predicted tryptic peptides of serum amyloid A. The detected peptides were sequenced directly off the tissue by using MS/MS procedures (Fig. 7) for validation of the proteins in the deposits.
Fig. 7.
Direct analysis of a human spleen sample collected in 1899 and stored in formaldehyde. (A) MS spectrum of tryptic peptides obtained from in situ digestion of a tissue section. Serum amyloid A peptides are indicated by *. (B) MS/MS spectrum of the peptide of m/z 1550.7. Database searching identified this peptide and many others as being from serum amyloid A.
Perspectives and Limitations
The physical and chemical processes that give rise to ions desorbed from tissues by laser pulses in a MALDI analysis have several inherent limitations that present significant challenges as technology developments go forward. In nearly all types of ionization processes including MALDI, a phenomenon often referred to as “ion suppression” can occur. Although this process is complex, briefly, some desorbed species that preferentially capture protons in the ionization (protonation) process can appear to be at higher abundance in the spectrum, and conversely others can appear at lower abundance relative to their true compositions in the sample. Thus, although the relative intensity measurements of the same protein in several samples can be compared with reasonable reproducibility (33), this comparison may not apply to the relative intensities of two separate proteins in a spectrum because their ionization efficiencies may be different.
Further improvement in sensitivity is a never-ending challenge, and current commercial instrumentation only allows a small portion of the proteome in tissues to be measured at any given time. Clearly there is the need to achieve higher sensitivity to measure proteins of low expression levels. Generally, soluble proteins are favored in the ablation process. To aid in the analysis of membrane-bound and transmembrane proteins, we have developed several cleavable detergents that are MS friendly, i.e., when the matrix is added to give low pH, the detergent hydrolyzes and the resulting products do not interfere with the analysis (37). This method has proven to be an effective way to measure proteins having high hydrophobic character.
Another aspect of IMS that is important to consider is the laser spot size on target and the tradeoff between image resolution and sensitivity; the smaller the spot size used to gain higher lateral image resolution, the less material there is in the ablated spot and therefore the greater the need for higher sensitivity. The limit of detection currently is estimated to be in the high attomole to low femtomole range, depending on the molecule being analyzed, but it is difficult to measure accurately in tissue. Nonetheless, proteins that are expressed at a few hundreds of copies per cell or less will not be readily analyzed with current instrumentation.
Relative quantitation has been shown to be quite acceptable (SEM ± 10–15%) when measuring a given protein in similar types of tissue (33). Protocols have been developed for preparation of the section and matrix application that provide a high level of uniformity and reproducibility. For example, an ongoing study of protein signatures in glioma biopsies assessed the reproducibility of the spectral patterns of a given biopsy in many areas that were of similar histology. A total of 687 individual spectra from 89 biopsies from 58 patients were analyzed in this study. The result of statistical analysis of the data obtained from these samples was that only 7% of the variability was the result of MS signal variation within a morphologically similar region of a given biopsy. The reproducibility of a given signal from different parts of a tissue that are not morphologically similar but contain the same concentration of an analyte is much harder to assess but does not appear to be a source of significant error. This idea is supported by the fact that, when possible, IMS images are matched against high-quality immunochemical methods and the comparisons have shown a high degree of congruence. Also, in the cases of proteins known to be evenly distributed in tissue, the MS image intensity has been found to be quite similar throughout the section even though the morphology may change significantly.
Conclusions
The integrated molecular complexity of cells, tissues, organs, and whole animals in both health and disease present formidable challenges to our understanding of the relevant biological processes involved. Such processes not only are composed of chemically diverse biologically active species, but also are dispersed and compartmentalized in discrete regions of tissue. Further, their appearance and activity often possess a temporal component that is often not yet well understood. Our ability to progress in the fundamental understanding of the relevant biology is directly linked to the development and availability of advanced molecular technologies.
MALDI IMS allows investigators to directly analyze a wide variety of molecules from intact tissue for the presence and distribution of proteins, peptides, lipids, metabolites, xenobiotics, and other biological molecules. The molecular images produced correlate well with histology and other imaging modalities such as MRI while providing specific molecular weight information. Its strength as a discovery technology lies in the fact that it does not require a target-specific reagent. It also is capable of extraordinarily high throughput and can handle virtually all types of tissue from both the animal and plant world. As this technology goes forward and the instrumentation and associated protocols mature, higher-resolution images obtained at greater sensitivities are certain to help bring new knowledge and understanding to biology.
Acknowledgments.
We thank Shannon Cornett for help with figures and FT-ICR images; M. Reid Groseclose for coronal rat brain images; Sara Frappier for the glioma images; Sheerin Khatib-Shahidi, Tuhin Sinha, and John Gore for their work on the 3D reconstructions and correlation of protein and MR images; Michelle Reyzer for β-amyloid images from the mouse model of Alzheimer's disease; Darrell Ellsworth (Windber Research Institute, Windber, PA) for the human breast tumor sample; and Charles Murphy, Per Westermark, and Alan Solomon (University of Tennessee Graduate School of Medicine, Knoxville, TN) for the 1899 museum amyloid sample. This work was supported by U.S. Public Health Service Research Grant CA 10056, the National Cancer Institute, the Aslan Foundation, National Institutes of Health/National Institute of General Medical Sciences Grant 5RO1 GM58008-09, and Department of Defense Grant W81XWH-05-1-0179.
Footnotes
The authors declare no conflict of interest.
This article is a PNAS Direct Submission.
Cornett DS, Seeley EH, Groseclose MR, Caprioli RM, 55th American Society for Mass Spectrometry Conference on Mass Spectrometry and Allied Topics, June 3–7, 2007, Indianapolis, IN.
References
- 1.McDonnell LA, Heeren RMA. Imaging mass spectrometry. Mass Spectrom Rev. 2007;26:606–643. doi: 10.1002/mas.20124. [DOI] [PubMed] [Google Scholar]
- 2.Pacholski ML, Winograd N. Imaging with mass spectrometry. Chem Rev. 1999;99:2977–3005. doi: 10.1021/cr980137w. [DOI] [PubMed] [Google Scholar]
- 3.Hillenkamp F, Karas M, Beavis RC, Chait BT. Matrix-assisted laser desorption ionization mass spectrometry of biopolymers. Anal Chem. 1991;63:A1193–A1202. doi: 10.1021/ac00024a002. [DOI] [PubMed] [Google Scholar]
- 4.Chaurand P, Hayn G, Matter U, Caprioli RM. Exploring the potential of cryodetectors for the detection of matrix-assisted laser desorption/ionization produced ions: Application to profiling and imaging mass spectrometry. Zhipu Xuebao. 2004;25:205–206. 215. [Google Scholar]
- 5.Sugiura Y, Shimma S, Setou M. Thin sectioning improves the peak intensity and signal-to-noise ratio in direct tissue mass spectrometry. J Mass Spectrom Soc Jpn. 2006;54:45–48. [Google Scholar]
- 6.Groseclose MR, Andersson M, Hardesty WM, Caprioli RM. Identification of proteins directly from tissue: In situ tryptic digestions coupled with imaging mass spectrometry. J Mass Spectrom. 2007;42:254–262. doi: 10.1002/jms.1177. [DOI] [PubMed] [Google Scholar]
- 7.Chaurand P, et al. Integrating histology and imaging mass spectrometry. Anal Chem. 2004;76:1145–1155. doi: 10.1021/ac0351264. [DOI] [PubMed] [Google Scholar]
- 8.Schwartz SA, et al. Proteomic-based prognosis of brain tumor patients using direct-tissue matrix-assisted laser desorption ionization mass spectrometry. Cancer Res. 2005;65:7674–7681. doi: 10.1158/0008-5472.CAN-04-3016. [DOI] [PubMed] [Google Scholar]
- 9.Rahman SMJ, et al. Proteomic patterns of preinvasive bronchial lesions. Am J Respir Crit Care Med. 2005;172:1556–1562. doi: 10.1164/rccm.200502-274OC. [DOI] [PMC free article] [PubMed] [Google Scholar]
- 10.Reyzer ML, et al. Early changes in protein expression detected by mass spectrometry predict tumor response to molecular therapeutics. Cancer Res. 2004;64:9093–9100. doi: 10.1158/0008-5472.CAN-04-2231. [DOI] [PubMed] [Google Scholar]
- 11.Schwartz SA, Reyzer ML, Caprioli RM. Direct tissue analysis using matrix-assisted laser desorption/ionization mass spectrometry: Practical aspects of sample preparation. J Mass Spectrom. 2003;38:699–708. doi: 10.1002/jms.505. [DOI] [PubMed] [Google Scholar]
- 12.Seeley EH, Oppenheimer SR, Mi D, Chaurand P, Caprioli RM. Enhancement of protein sensitivity for MALDI imaging mass spectrometry after chemical treatment of tissue sections. J Am Soc Mass Spectrom. 2008;19:1069–1077. doi: 10.1016/j.jasms.2008.03.016. [DOI] [PMC free article] [PubMed] [Google Scholar]
- 13.Aerni H-R, Cornett DS, Caprioli RM. Automated acoustic matrix deposition for MALDI sample preparation. Anal Chem. 2006;78:827–834. doi: 10.1021/ac051534r. [DOI] [PubMed] [Google Scholar]
- 14.Baluya DL, Garrett TJ, Yost RA. Automated MALDI matrix deposition method with inkjet printing for imaging mass spectrometry. Anal Chem. 2007;79:6862–6867. doi: 10.1021/ac070958d. [DOI] [PubMed] [Google Scholar]
- 15.Shimma S, Furuta M, Ichimura K, Yoshida Y, Setou M. A novel approach to in situ proteome analysis using chemical inkjet printing technology and MALDI-QIT-TOF tandem mass spectrometer. J Mass Spectrom Soc Jpn. 2006;54:133–140. [Google Scholar]
- 16.Cornett DS, et al. A novel histology-directed strategy for MALDI-MS tissue profiling that improves throughput and cellular specificity in human breast cancer. Mol Cell Proteomics. 2006;5:1975–1983. doi: 10.1074/mcp.M600119-MCP200. [DOI] [PubMed] [Google Scholar]
- 17.Kruse R, Sweedler JV. Spatial profiling invertebrate ganglia using MALDI MS. J Am Soc Mass Spectrom. 2003;14:752–759. doi: 10.1016/S1044-0305(03)00288-5. [DOI] [PubMed] [Google Scholar]
- 18.Andersson M, Groseclose MR, Deutch AY, Caprioli RM. Imaging mass spectrometry of proteins and peptides: 3D volume reconstruction. Nat Methods. 2008;5:101–108. doi: 10.1038/nmeth1145. [DOI] [PubMed] [Google Scholar]
- 19.Wang H-YJ, Jackson SN, Woods AS. Direct MALDI-MS analysis of cardiolipin from rat organs sections. J Am Soc Mass Spectrom. 2007;18:567–577. doi: 10.1016/j.jasms.2006.10.023. [DOI] [PMC free article] [PubMed] [Google Scholar]
- 20.Norris JL, et al. Processing MALDI mass spectra to improve mass spectral direct tissue analysis. Int J Mass Spectrom. 2007;260:212–221. doi: 10.1016/j.ijms.2006.10.005. [DOI] [PMC free article] [PubMed] [Google Scholar]
- 21.Klinkert I, et al. Tools and strategies for visualization of large image data sets in high-resolution imaging mass spectrometry. Rev Sci Instrum. 2007;78:053716/1–053716/10. doi: 10.1063/1.2737770. [DOI] [PubMed] [Google Scholar]
- 22.Caprioli RM, Farmer TB, Gile J. Molecular imaging of biological samples: Localization of peptides and proteins using MALDI-TOF MS. Anal Chem. 1997;69:4751–4760. doi: 10.1021/ac970888i. [DOI] [PubMed] [Google Scholar]
- 23.Stoeckli M, Chaurand P, Hallahan DE, Caprioli RM. Imaging mass spectrometry: A new technology for the analysis of protein expression in mammalian tissues. Nat Med. 2001;7:493–496. doi: 10.1038/86573. [DOI] [PubMed] [Google Scholar]
- 24.Altelaar AFM, et al. High-resolution MALDI imaging mass spectrometry allows localization of peptide distributions at cellular length scales in pituitary tissue sections. Int J Mass Spectrom. 2007;260:203–211. [Google Scholar]
- 25.Chaurand P, et al. Profiling and imaging proteins in the mouse epididymis by imaging mass spectrometry. Proteomics. 2003;3:2221–2239. doi: 10.1002/pmic.200300474. [DOI] [PubMed] [Google Scholar]
- 26.Chaurand P, et al. Monitoring mouse prostate development by profiling and imaging mass spectrometry. Mol Cell Proteomics. 2008;7:411–423. doi: 10.1074/mcp.M700190-MCP200. [DOI] [PubMed] [Google Scholar]
- 27.Burnum KE, et al. Imaging mass spectrometry reveals unique protein profiles during embryo implantation. Endocrinology. 2008 doi: 10.1210/en.2008-0309. [DOI] [PMC free article] [PubMed] [Google Scholar]
- 28.Schwamborn K, et al. Identifying prostate carcinoma by MALDI imaging. Int J Molec Med. 2007;20:155–159. [PubMed] [Google Scholar]
- 29.Lemaire R, et al. Specific MALDI imaging and profiling for biomarker hunting and validation: Fragment of the 11S proteasome activator complex, Reg alpha fragment, is a new potential ovary cancer biomarker. J Proteome Res. 2007;6:4127–4134. doi: 10.1021/pr0702722. [DOI] [PubMed] [Google Scholar]
- 30.Caldwell RL, Gonzalez A, Oppenheimer SR, Schwartz HS, Caprioli RM. Molecular assessment of the tumor protein microenvironment using imaging mass spectrometry. Cancer Genomics Proteomics. 2006;3:279–288. [Google Scholar]
- 31.Amann JM, et al. Selective profiling of proteins in lung cancer cells from fine-needle aspirates by matrix-assisted laser desorption ionization time-of-flight mass spectrometry. Clin Cancer Res. 2006;12:5142–5150. doi: 10.1158/1078-0432.CCR-06-0264. [DOI] [PubMed] [Google Scholar]
- 32.Meistermann H, et al. Biomarker discovery by imaging mass spectrometry: Transthyretin is a biomarker for gentamicin-induced nephrotoxicity in rat. Mol Cell Proteomics. 2006;5:1876–1886. doi: 10.1074/mcp.M500399-MCP200. [DOI] [PubMed] [Google Scholar]
- 33.Khatib-Shahidi S, Andersson M, Herman JL, Gillespie TA, Caprioli RM. Direct molecular analysis of whole-body animal tissue sections by imaging MALDI mass spectrometry. Anal Chem. 2006;78:6448–6456. doi: 10.1021/ac060788p. [DOI] [PubMed] [Google Scholar]
- 34.Crossman L, McHugh NA, Hsieh Y, Korfmacher WA, Chen J. Investigation of the profiling depth in matrix-assisted laser desorption/ionization imaging mass spectrometry. Rapid Commun Mass Spectrom. 2006;20:284–290. doi: 10.1002/rcm.2259. [DOI] [PubMed] [Google Scholar]
- 35.Sinha TK, et al. Integrating spatially resolved three-dimensional MALDI IMS with in vivo magnetic resonance imaging. Nat Methods. 2008;5:57–59. doi: 10.1038/nmeth1147. [DOI] [PMC free article] [PubMed] [Google Scholar]
- 36.Westermark P, Nilsson GT. Demonstration of amyloid protein AA in old museum specimens. Arch Pathol Lab Med. 1984;108:217–219. [PubMed] [Google Scholar]
- 37.Norris JL, Porter NA, Caprioli RM. Combination detergent/MALDI matrix: Functional cleavable detergents for mass spectrometry. Anal Chem. 2005;77:5036–5040. doi: 10.1021/ac050460g. [DOI] [PubMed] [Google Scholar]


