Abstract
A new approach to quantitative single-molecule imaging by confocal laser scanning microscopy (CLSM) is presented. It relies on fluorescence intensity distribution to analyze the molecular occurrence statistics captured by digital imaging and enables direct determination of the number of fluorescent molecules and their diffusion rates without resorting to temporal or spatial autocorrelation analyses. Digital images of fluorescent molecules were recorded by using fast scanning and avalanche photodiode detectors. In this way the signal-to-background ratio was significantly improved, enabling direct quantitative imaging by CLSM. The potential of the proposed approach is demonstrated by using standard solutions of fluorescent dyes, fluorescently labeled DNA molecules, quantum dots, and the Enhanced Green Fluorescent Protein in solution and in live cells. The method was verified by using fluorescence correlation spectroscopy. The relevance for biological applications, in particular, for live cell imaging, is discussed.
Keywords: fluorescence correlation spectroscopy, live cells, sensitivity
Limited sensitivity and spatial resolution impede the usage of fluorescent microscopy for quantitative analysis of low copy numbers of biologically relevant molecules in live cells. Therefore, methodological and instrumental advancements are required. The aim of our work is to explore the benefits of integrating confocal laser scanning microscopy (CLSM) with fluorescence correlation spectroscopy (FCS) (1–4) as a platform for quantitative imaging of the spatiotemporal dynamics of cellular processes in real time.
Fast scanning was suggested as a possible way to increase signal intensity in CLSM (5–8), but has not been systematically pursued. A contributing factor is that for increased scanning speed the number of detected photons becomes lower. With low photon counts, detector properties become increasingly relevant because the internal noise of the detector may considerably limit the quality of the image. Therefore, our first aim was to build an instrument for CLSM imaging with improved detection efficiency. We achieved this by introducing avalanche photodiodes (APDs) as detectors. Compared with the photomultiplier tubes (PMTs), normally used as detectors in conventional CLSM, the APDs are characterized by higher quantum and collection efficiency—≈70% in APDs compared with 15–25% in PMTs; higher gain, faster response time, and lower dark current (6, 9). The considerably improved signal-to-noise ratio that was achieved by the introduction of APDs enabled the implementation of fast scanning. Fast scanning offers additional advantages: increased fluorescence yield by avoiding intersystem crossing, data collection at higher encountering frequency and from independent volumes, further significantly improving the signal-to-background ratio (SBR) in imaging.
We first demonstrate that improved SBRs enabled us to quantify the average number of molecules in the observation volume element by analyzing the image statistics, without resorting to temporal or spatial autocorrelation analyses. Our results, which report on direct quantitative imaging with single-molecule sensitivity by CLSM, were verified by using classical FCS.
We address temporal resolution of fluorescence imaging in the second part of our study. Slow image acquisition is a standard practice, particularly suitable for imaging fixed biological preparations, but becomes a serious limitation when it comes to studying processes in live cells where molecules are in perpetual motion; they are transported from the sites of their synthesis, to the sites of action, and finally to the degradation sites, exhibiting complex spatiotemporal dynamics. To study molecular motility in live cells with single-molecule sensitivity fast imaging routines are a necessity.
Results
Water solutions of organic fluorescent dyes Rhodamine 6G (Rh6G) and Cyanine 5 (Cy5) were used as reference standards. CLSM images were acquired at scanning speeds 0.64–163.8 μs per pixel. Images were collected without averaging, using a 512 × 512-pixel resolution and 70 × 70-nm pixel size. In the digital image pixel intensity is an integer, ip = 0, 1, 2…, and fluorescence intensity associated with it is related to the scanning speed, Iipθ = ip/θ. For a 1-count pixel in the image acquired at the fastest scanning speed, θ = 0.64 μs per pixel, the fluorescence intensity is I10.64 = 1.56 MHz. The corresponding value in the image acquired at the slowest scanning speed, θ = 163.8 μs per pixel, is I1163.8 = 6.1 kHz. Statistical methods were used to analyze the image-associated fluorescence intensity distribution. The results of image analysis were compared with FCS measurements, where temporal autocorrelation analysis was performed to evaluate the average number of particles in the observation volume element and determine the lateral diffusion time of the investigated fluorescence reporter.
Fluorescence Gain by Abolishing Intersystem Crossing.
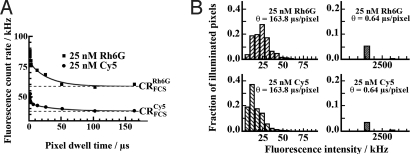
The most readily obtained parameter from image analysis that can be compared with FCS measurements is the average fluorescence count rate (Fig. 1A). The average fluorescence count rate determined by imaging (CRimageθ) is:
 |
where ip = 0, 1, 2… is the pixel intensity; 512 × 512 is the total number of pixels per image frame and θ is the scanning speed, that is, the pixel dwell time. Alternatively, the average fluorescence count rate can be determined from the fluorescence intensity distribution of the image (Fig. 1B) and expressed as the sum of fractions (fip) with corresponding intensity (Iipθ); pip is the number of pixels in the image frame with intensity ip, and fip = pip/512 × 512 is the fraction of pixels with intensity Iipθ = ip/θ.
Fig. 1.
Fluorescence intensity gain by fast scanning due to abolished intersystem crossing. (A) Dependence of the average fluorescence count rate (CRimageθ) on the scanning speed. The corresponding value measured by FCS (CRFCS) is given by the dashed lines. (B) Fluorescence intensity distribution in images acquired by slow (sparsely striped bars) and fast scanning (densely striped bars).
CRimageθ depends on the scanning speed (Fig. 1A), with high values being observed in the fast scanning mode (CRimage0.64 = 89 kHz), and converging for slow scanning to values determined by classical, that is, stationary FCS (CRimage163.8 = CRFCS = 58 kHz). Thus, the average fluorescence count rate is ≈1.5 times higher in the fast scanning mode, compared with slow scanning or stationary FCS.
In continuous-wave excitation, fluorescence is typically lost through the transition of the fluorophore to the triplet state, fractional depopulation of the singlet state, or irreversible photochemical destruction (10). By using the initial velocity approximation to analyze the experimentally observed fluorescence count rate decay (Fig. 1A), we estimated that fluorescence loss occurred at rates proportional to kRh6G = (2 ± 1)×106 s1 and kCy5 = (5 ± 2)×106 s1. These values are in good agreement with rate constants for intersystem crossing (11), suggesting that during slow scanning and for low/moderate excitation intensities (100 μW–1.5 mW) fluorescence is mainly lost because of transition of the fluorophore to the triplet state, a well known phenomenon from the early days of FCS (12, 13). We verified this finding by numerical simulation (see supporting information (SI) Text, Numerical Simulation of Singlet–Triplet Transition Kinetics, and Fig. S1).
Quantitative Single-Molecule Imaging by CLSM.
In a solution in thermodynamic equilibrium, the passage of dissolved fluorescent molecules through a volume element is well described by the Poisson distribution. For such processes the mean number of events generating the fluctuation, like the fluctuation in the average number of fluorescent molecules in the observation volume element (N̄), may be determined directly from the mean square fluctuation:
Direct determination of N̄ from the mean square fluctuation is not possible because the detected signal, in this instance the fluorescence intensity, is not only a function of the concentration, but also of the instrumental and experimental setup that delimits the background noise (4, 6, 9, 14). The influence of background noise is well known in FCS (4, 9). Therefore, a prerequisite for direct determination of N̄ is the virtual absence of background noise.
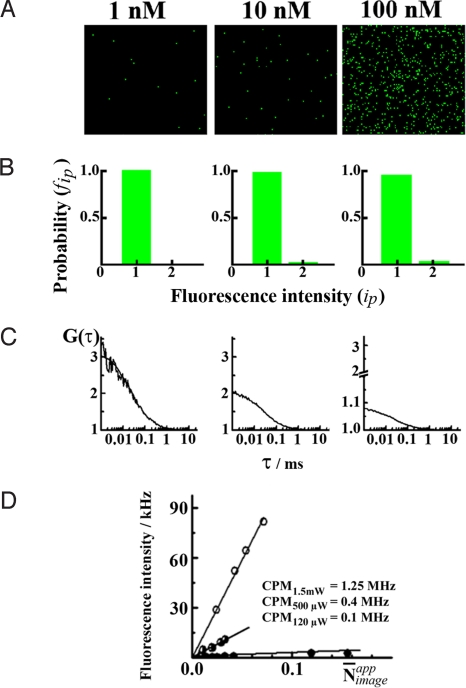
The detector background noise was significantly reduced by the use of APD detectors. In our instrumental setup, the total number of detector-related counts were ≈50 pixels per image frame, compared with 17,069 (100 nM Rh6G), 1,059 (10 nM Rh6G), and 337 (1 nM Rh6G). Hence, the respective contribution of detector noise was 0.2, 5, and 15% of the mean intensity. Given the very low dark count of APDs, which can be further reduced by a proper selection of the diode, the quantitative number analysis from the imaged intensity fluctuations can be done at very low concentrations.
The quality of the signal was additionally improved by scanning. As discussed above, fast scanning increased the fluorescence yield. In addition, it enables data collection at a higher encountering frequency and from independent volumes.
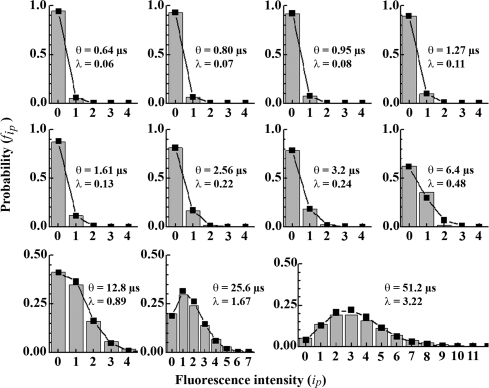
With the improved SBR performance, digital images of standard dye solutions taken at different scanning speeds were examined to establish whether the fluorescence intensity distribution in the image complies with the Poisson distribution.
In the image analysis, we derive the average fluorescence intensity per pixel:
 |
The variance (Var) of the average pixel intensity is calculated as the square of the standard deviation (σ):
 |
The results, Table 1 and Fig. 2, show that the average fluorescence intensity per pixel is equal to the variance of the average pixel intensity for all scanning speeds tested, and could be best fitted by a Poisson distribution with a mean of the distribution (λ) being equal to the image-associated fluorescence intensity variance (λ = Var).
Table 1.
CLSM image-associated fluorescence intensity distribution analysis
| Observation time, μs/pixel | Image analysis |
Mean of the Poisson distribution* (λ) | R2* | N̄imageapp† | |
|---|---|---|---|---|---|
| ip | σ2 | ||||
| 0.64 | 0.06 | 0.06 | 0.06 | 0.99998 | 0.06 |
| 0.80 | 0.07 | 0.07 | 0.07 | 1.0 | 0.07 |
| 0.95 | 0.08 | 0.08 | 0.08 | 0.99999 | 0.08 |
| 1.27 | 0.11 | 0.11 | 0.11 | 0.99999 | 0.11 |
| 1.61 | 0.13 | 0.14 | 0.13 | 1.0 | 0.13 |
| 2.56 | 0.21 | 0.22 | 0.22 | 0.99999 | 0.22 |
| 3.20 | 0.25 | 0.25 | 0.24 | 0.99999 | 0.24 |
| 6.40 | 0.39 | 0.27 | 0.48 | 0.98477 | 0.48 |
| 12.8 | 0.94 | 1.05 | 0.89 | 0.99855 | 0.89 |
| 25.6 | 1.76 | 2.14 | 1.67 | 0.99499 | 1.67 |
| 51.2 | 3.39 | 4.62 | 3.22 | 0.98836 | 3.22 |
The average number of molecules in the observation volume element and the lateral diffusion time determined by nonlinear least square fitting of Eq. 16 yield N̄image = (3.3 ± 0.8) and τDiff = (33 ± 0.4) μs, respectively. These values are in good agreement with values determined by FCS (N̄FCS = 3.5 and τDiff = 35.5 μs).
*The observed fluorescence intensity distribution was fitted to the closest Poisson distribution by using http://faculty.vassar.edu/lowry/poissonfit.html. The quality of fitting was evaluated by using the linear covariance (R2).
Fig. 2.
Fluorescence intensity distribution as a function of the scanning speed. Fluorescence intensity distribution histograms (gray bars) obtained by imaging 40 nM water solution of Rh6G by using different scanning speeds, together with the Poisson distribution fitting best the experimental data (squares).
The apparent number of fluorescent molecules (N̄appimage) accounting for the imaged fluorescence intensity fluctuations was then calculated by using:
N̄appimage depends on the scanning speed (Table 1). It is linearly proportional to the concentration and excitation intensity, exemplified in Fig. 3 for the fastest scanning speed. Linear proportionality between the image-related fluorescence intensity distribution and the average number of molecules in the observation volume element shows that quantitative imaging with single-molecule sensitivity is indeed achieved and the average number of fluorescent molecules per observation volume element (N̄) can be determined directly from the imaged fluorescence intensity fluctuations.
Fig. 3.
Comparison of quantitative CLSM imaging with FCS. (A) Quantitative APD images of 1 nM, 10 nM, and 100 nM water solutions of Rh6G, recorded by using fast scanning, θ = 0.64 μs per pixel. The total number of detector-related counts was ≈50 pixels per image frame, as compared with 17,069 for 100 nM Rh6G, 1,059 for 10 nM Rh6G, and 337 for 1 nM Rh6G. (B) Fluorescence intensity distribution histograms. (C) Temporal autocorrelation curves obtained by FCS. (D) Apparent molecular brightness determined as the average fluorescence count rate (CRimageθ) versus the apparent number of molecules (N̄imageapp; see Table 1). Rh6G solutions were in the concentration range 1–300 nM. The slopes give the apparent counts per molecule in the scanning regime, which is in the MHz range, as compared with the counts per molecule in the stationary FCS mode that was ≈40 kHz.
Determination of Molecular Diffusion by Imaging.
Molecular encountering frequency in a stationary observation volume element.
According to the theory of photon count distribution derived for diffusing molecules undergoing singlet-triplet transition (15–17), the overall probability that (n) photons are emitted by a random number of molecules (m) from a stationary volume element (dV) during a counting interval (θ) is equal to:
 |
where c is the concentration of the fluorescence emitter and P(m) (n;θ, r→) is the distribution of photons emitted from molecule m found in point r→ by the end of the counting interval. For molecules undergoing translational diffusion the probability distribution P(n;T, r→) of photon counts is also Poissonian (16). Thus, the overall distribution of photon counts acquired by imaging mobile molecules can be regarded as double Poissonian; the first term giving the probability to find a molecule within the observation volume element during the observation period and the second term defining the probability distribution of photon counts emitted by a single molecule.
We analyze the first term in Eq. 6. The frequency of encountering a freely diffusing fluorescent molecule in a stationary spherical volume element depends on the size of the volume element, the diffusion coefficient of the fluorescent molecule, and the concentration of fluorescent molecules:
where rs is the radius of a spherical volume element, D is the diffusion coefficient of the fluorophore, and c is the concentration of the fluorophore expressed as the number of fluorescent molecules per volume unit (5). For a cylindrical observation volume element of radius rc and a long half-axis lc the encountering frequency is (5):
Assuming that the laser intensity profile can be approximated by a 3-dimensional Gaussian and using the relation between D and the lateral diffusion time (τDiff):
Eq. 7 becomes
 |
In Eq. 10 the volume of the prolate ellipsoid was approximated by the volume of a cylinder (Vc) with equal half-axes (re = rc and le = lc) and c·Vc = N̄.
The apparent number of fluorescent molecules encountered in a stationary observation volume element during observation time (θ) is proportional to the length of the observation time and the encountering frequency. Hence, the probability of observing m molecules in a stationary observation volume element during an observation period θ is:
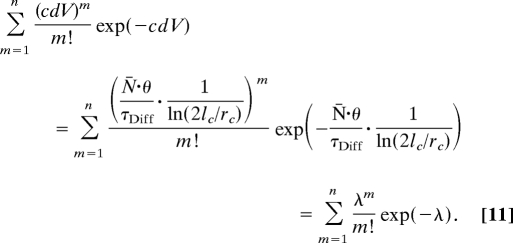 |
Thus, the mean value of molecular occurrence distribution:
is related to macroscopic properties, namely the average number of fluorescent molecules in the observation volume element (N̄) and the lateral diffusion time (τDiff) of the fluorophore. Eq. 12 implies that N̄ and τDiff can be determined from images acquired by using different observation times, providing that images with enhanced SBR are obtained.
Molecular encountering frequency in a moving observation volume element.
In the scanning regime, the encountering frequency of fluorescent molecules (νencount) has contributions from molecular diffusion (νDiff) and the translational repositioning of the observation volume element (νScan):
 |
The time required for the observation volume element to be translated by scanning is:
where rc is the radius of the observation volume element and pw is the pixel width. Eqs. 13 and 14 relate FCS with CLSM imaging by linking the observation volume element (rc = ω) used for the examination of τDiff in FCS with the pixel size (pw) and the scanning speed (τScan) used for CLSM imaging.
Imaging of mobile particles by CLSM can be considered in analogy to systems where diffusion is coupled with 1-dimensional flow with constant velocity (18, 19). This implies that in the scanning regime the total mean square displacement (MSDScan) is equal to the sum of the MSD by molecular diffusion and the translational repositioning of the observation volume element. By relating Eqs. 13 and 14 to 12, the mean value of the molecular occurrence distribution in the scanning regime can be derived:
 |
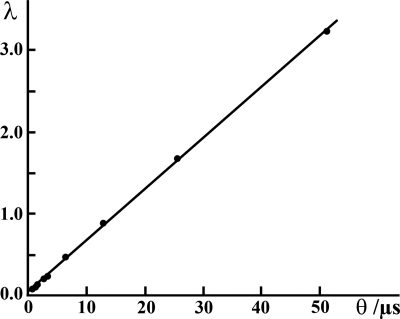
The parameters of Eq. 15 can be determined by fitting the relationship λ = f(θ) (Fig. 4), yielding the average number of Rh6G molecules in the observation volume element, N̄ = (3.3 ± 0.8), and the lateral diffusion time, τDiff = (33.0 ± 0.4) μs. Thus, the average number of Rh6G molecules in the observation volume element and the diffusion time could be determined from image analysis, without resorting to temporal or spatial autocorrelation. The values obtained by imaging are in good agreement with values determined by FCS, N̄FCS = (3.5 ± 0.5) and τDiff = (35.5 ± 1.5) μs. Examples for other concentrations and fluorophores are given in SI Text, Determination of Molecular Numbers by Quantitative CLSM. (See also Table S1.)
Fig. 4.
Determination of the average number of Rh6G molecules in the observation volume element (N̄image) and the diffusion time (τDiff) by quantitative CLSM imaging. The mean of the fluorescence intensity distribution as a function of the scanning speed. By using Eq. 15, the geometric factor 2lc/rc = 5, rc = 210 nm, and pw = 70 nm, the average number of molecules in the observation volume element and the lateral diffusion time were determined to be N̄FCS = 3.3 and τDiff,image = 33.5 μs, respectively. These values are in good agreement with the corresponding values determined by FCS (N̄FCS = 3.5 and τDiff,FCS = 35.5 μs).
Quantitative Live Cell Imaging.
Optical microscopy is currently undergoing major development, because new concepts are being formulated and instruments built to improve the spatial resolution and localization precision even beyond the classical diffraction limit (20–22). These advancements are of crucial importance for applications in life sciences. To study at the single-molecule level processes in live cells, which are tightly spatiotemporally entangled, spatially and temporally resolved imaging methods are required. We address here the latter aspect in relation to quantitative CLSM imaging.
Random molecular displacement of particles undergoing Brownian diffusion is projected in CLSM imaging onto the 2-dimensional image plane and the probability density function of the imaged particle displacement can be described by a 2-dimensional Gaussian probability density function:
where Δx and Δy denote the projected displacements. By introducing the pixel dwell time (θ), a relationship linking molecular diffusion (D) with image parameters is obtained. Eq. 16 indicates that for long pixel dwell times the mean square displacement by diffusion, which is proportional to D·θ, becomes large enough for fast-moving molecules to leave/enter the observation volume element during the observation time. Therefore, the pixel-associated fluorescence intensity acquired for long pixel dwell times is averaged-out by diffusion, approaching the temporal average over the observation volume element and a “blurred” image of moving molecules is obtained. In contrast, the molecules appear to be immobile and “crisp” images are obtained by fast scanning (SI Text, Imaging Mobile Molecules by Quantitative CLSM, Fig. S2, and Table S2).
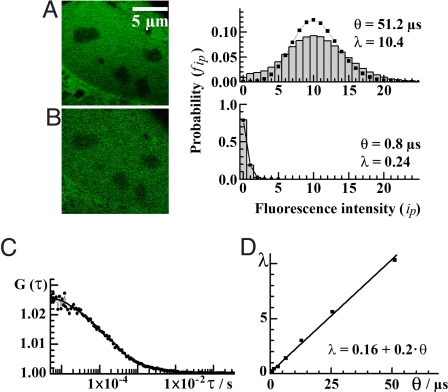
To quantify the number of EGFP molecules and determine their mobility in live cells by the proposed CLSM imaging approach, we analyzed the image-related statistics (Fig. 5) by using Eq. 15. The average number of EGFP molecules was determined to be N̄image = 35, in very good agreement with the value determined by FCS, N̄FCS = 39.5. The diffusion time of EGFP determined by imaging, τDiff, image = 110 μs, is also in good agreement with the value determined by FCS, τDiff, FCS = 140 μs.
Fig. 5.
Determination of the average number of EGFP molecules in live cells by quantitative CLSM imaging. (A) Confocal APD image of the nucleus of a neuroblastoma cell expressing EGFP acquired by slow scanning, θ = 51.2 μs per pixel, with a corresponding fluorescence intensity distribution histogram (bars) and the Poisson distribution (squares). The mean of the Poisson distribution is equal to the average pixel intensity of the image, λ = 10.4. (B) The same image acquired by fast scanning, θ = 3.2 μs per pixel, together with the corresponding fluorescence intensity distribution histogram (bars) fitted to a Poisson distribution (line) with the mean of the distribution being equal to the average pixel intensity of the image, λ = 0.24. (C) Temporal autocorrelation curve obtained by FCS measurements in the nucleus, N̄FCS = 39.5 and τDiff, FCS = 140 μs. (D) Mean of the fluorescence intensity distribution as a function of the scanning speed. Average number of EGFP molecules in the observation volume element (N̄image) and the diffusion time (τDiff, image) could be determined by using Eq. 15 (2lc/rc = 5, rc = 210 nm, and pw = 35 nm) to analyze the relationship λ versus θ, N̄image = 35 and τDiff, image = 110 μs.
Discussion
Many biological problems are addressed by using fluorescence microscopy-based approaches and the confocal fluorescence microscope has become a centerpiece in the cell biology laboratory. Fluorescence intensity fluctuation analysis, offering the possibility to study quantitatively molecular interactions in live cells, is still a technique that is overwhelmingly used in laboratories specialized in biophysical analysis and has not yet reached the wider community of researchers in the biomedical field. The introduction of fluorescence intensity fluctuation analysis in imaging offers the possibility to achieve quantitative fluorescence imaging with single-molecule sensitivity, an accomplishment that would considerably advance our understanding of biological processes at the molecular level. To this point, introduction of fluorescence intensity fluctuation analysis in imaging was successfully pursued in the form of fluorescence fluctuation correlation in image correlation spectroscopy (ICS) (23), raster image correlation spectroscopy (RICS) (24, 25), and photon-counting histogram analysis (PCH) (26, 27).
To develop instruments for quantitative fluorescence imaging the scanning speed and the properties of the fluorescence detector are essential for acquiring a good-quality signal in a time interval that is as short as possible—the observation time has to be short enough to avoid intersystem crossing and averaging of the fluorescence intensity fluctuations by diffusion. This requirement necessitates detectors with superb characteristics. At present, the APDs perform outstandingly better than the PMTs or the charge-coupled device (CCD) cameras. In PMTs, the lower quantum and collection efficiency, lower gain, slower response time, and higher dark current are the limitations, whereas the major limiting factor in CCD cameras is the relatively slow readout, which is presently ≈10 ms at best.
Fast scanning of the observation volume element (θ < τDiff) improves significantly the SBR as compared with stationary FCS. When molecular brightness and the diffusion rate of the fluorophore do not vary significantly and the solvent background is sufficiently low, the concentration and diffusion coefficient can be obtained directly from image analysis by using the quantitative CLSM imaging approach proposed in this study.
For slow scanning, Eq. 15 converges to 12 derived for stationary imaging, as the second term in the brackets becomes negligible. For very short observation times, θ ≪ τDiff, the information on molecular diffusion is lost as molecular movement by diffusion becomes insignificant in comparison with the observation volume displacement by scanning, as evident from Eq. 15.
Deviations from Eq. 15 were observed in limiting cases, dilute (c < 1 nM) or concentrated solutions (c > 1 μM) and extreme excitation. In the limiting cases, the imaged fluorescence intensity distribution is not correctly described by the Poisson distribution. Images of dilute solutions acquired by fast scanning are characterized by a large excess of pixels associated with zero intensity, skewing the distribution away from the Poissonian. On the other side, the negative binomial distribution, where a second fitting parameter is introduced to adjust for the variance of the Poisson distribution independently of its mean, gives a better fitting. The requirement of an additional variable arises because of unfavourable processes like excessive photobleaching or detector saturation. Detector saturation was observed for fluorescence intensities >4 MHz.
So far, we developed the formalism and analyzed successfully in solution and in live cells examples where the brightness and diffusion of the fluorophore could be considered as uniform properties. Heterogeneity in molecular mobility can be accounted for by extending Eq. 15. As can be seen from the dependence of λ on θ, immobile structures will give a zero slope because of the τDiff being very long.
In summary, we have developed a CLSM/FCS instrument with performance optimized for single-molecule imaging and quantification in vitro and in live cells, demonstrated that quantitative imaging with single-molecule sensitivity is realized and showed that information about the concentration and molecular mobility can be retrieved from analyzing the molecular occurrence statistics captured by imaging, without resorting to temporal or spatial correlation analyses. The proposed method may be regarded as the imaging counterpart of FCS—fluorescence intensity fluctuations recorded by APDs are stored in the format of a digital CLSM image. The ensemble of photon counts acquired at time intervals of different lengths is analyzed to determine the average number of molecules and their mobility, without using temporal autocorrelation analysis. This is an alternative to RICS (24, 25), which relies on temporal autocorrelation analysis.
Quantitative determination of molecular numbers and mobility by APD imaging relies on FCS for instrumental calibration. The accuracy and precision of the method is comparable to FCS for fluorescent molecules in solution. Whereas the diffusion time could be determined with high precision, ΔτD = ±2%, the uncertainty in determining the average number of molecules was somewhat higher, ΔN̄ = ±20%.
Advantages of the proposed approach lie in the fact that low-intensity irradiation is required, facilitating quantitative analysis of molecular numbers and mobility in live cells without resorting to autocorrelation analysis. Moreover, the achieved high-detection sensitivity allows sparse molecules, like, for example, gene-fused fluorescence markers, to be quantified in live cells, making it possible to study in real time the dynamics of genes transcription.
Materials and Methods
CLSM/FCS Instrumentation.
CLSM/FCS measurements were performed on a uniquely modified ConfoCor3 instrument (Carl Zeiss MicroImaging GmbH) consisting of the inverted microscope for transmitted light and epifluorescence (Axiovert 200 M); the VIS-laser module comprising the Ar-ion (458, 477, 488, and 514 nm), HeNe 543 nm and HeNe 633 nm lasers; scanning module LSM 510 META modified to enable detection in the imaging mode by using silicone avalanche photodiodes (SPCM-AQR-1X; PerkinElmer) and the FCS module with 3 detection channels. The C-Apochromat 40×/1.2 W, objective was used throughout. CLSM/FCS data were analyzed by using programs for image examination and online FCS data analysis that are part of the running software package. For APD imaging purposes a program for fluorescence intensity distribution analysis was developed. The FCS data were also evaluated offline, by using the Levenberg–Marquardt algorithm for fitting.
Cell Culture and Cloning.
SK-N-MC cells (American Type Culture Collection) were cultured in Eagle's Minimal Essential medium with Earle's BSS and 2 mM l-glutamine (EMEM) containing 1.0 mM sodium pyruvate, 0.1 mM nonessential amino acids, 1.5 g/L sodium bicarbonate, supplemented with 10% FBS, 50 units/mL penicillin, and 50 μg/mL streptomycin in a humidified incubator with 5% CO2 at 37 °C. Stable transfection of SK-N-MC cells was carried out with pEGFP-N1 (Clontech) by using Lipofectamine (Invitrogen) according to the manufacturer's instructions. At 72 h after transfection, the cells were washed with PBS and then selected and maintained in EMEM and 10% FBS containing 800 μg/mL G-418 (Gibco). Approximately 2 weeks later Geneticin-resistant colonies were selected and continuously cultured.
Standard Solutions and Reagents.
Standard solutions of Rhodamine 6G (Invitrogen), Cyanine 5 (Amersham), double-stranded DNA probes labeled with these dyes (EvoTech), and Adirondack Green water soluble quantum dots [cadmium selenide with a zinc sulfide shell (CdSe/ZnS); EviTag] were prepared in phosphate buffer saline (PBS; pH = 7.5) or deionized water, specific resistance, ρ = 12 MΩ cm1.
Supplementary Material
Acknowledgments.
Quantum dots were a kind gift from Professor Hjalmar Brismar, Royal Institute for Technology, Stockholm, Sweden. This work was supported by the Swedish Research Council, Cancerdegradome, and The Knut and Alice Wallenberg Foundation.
Footnotes
The authors declare no conflict of interest.
This article contains supporting information online at www.pnas.org/cgi/content/full/0809250105/DCSupplemental.
References
- 1.Magde D, Elson EL, Webb WW. Thermodynamic fluctuations in a reacting system: Measurement by fluorescence correlation spectroscopy. Phys Rev Lett. 1972;29:705–708. [Google Scholar]
- 2.Elson EL, Magde D. Fluorescence correlation spectroscopy. I. Conceptual basis and theory. Biopolymers. 1974;13:1–27. doi: 10.1002/bip.1974.360130103. [DOI] [PubMed] [Google Scholar]
- 3.Ehrenberg M, Rigler R. Rotational Brownian motion and fluorescence intensity fluctuations. Chem Phys. 1974;4:390–401. [Google Scholar]
- 4.Koppel DE. Statistical accuracy in fluorescence correlation spectroscopy. Phys Rev A. 1974;10:1938–1945. [Google Scholar]
- 5.Eigen M, Rigler R. Sorting single molecules: Application to diagnostics and evolutionary biotechnology. Proc Natl Acad Sci USA. 1994;91:5740–5747. doi: 10.1073/pnas.91.13.5740. [DOI] [PMC free article] [PubMed] [Google Scholar]
- 6.Rigler R, Mets Ü, Widengren J, Kask P. Fluorescence correlation spectroscopy with high count rate and low-background: Analysis of translational diffusion. Eur Biophys J Biophys Lett. 1993;22:169–175. [Google Scholar]
- 7.Koppel DE, Morgan F, Cowan AE, Carson JH. Scanning concentration correlation spectroscopy using the confocal laser microscope. Biophys J. 1994;66:502–507. doi: 10.1016/s0006-3495(94)80801-x. [DOI] [PMC free article] [PubMed] [Google Scholar]
- 8.Donnert G, Eggeling C, Hell SW. Major signal increase in fluorescence microscopy through dark-state relaxation. Nat Methods. 2007;4:81–86. doi: 10.1038/nmeth986. [DOI] [PubMed] [Google Scholar]
- 9.Rigler R, Mets Ü. Diffusion of single molecules through a Gaussian laser beam. In: Korppi-Tommola JE, editor. Laser Spectroscopy of Biomolecules. Vol 1921. Bellingham: SPIE; 1993. pp. 239–248. [Google Scholar]
- 10.Davis LM, Shen G. Accounting for triplet and saturation effects in FCS measurements. Curr Pharm Biotechnol. 2006;7:287–301. doi: 10.2174/138920106777950843. [DOI] [PubMed] [Google Scholar]
- 11.Costantino S, Comeau JWD, Kolin DL, Wiseman PW. Accuracy and dynamic range of spatial image correlation and cross-correlation spectroscopy. Biophys J. 2005;89:1251–1260. doi: 10.1529/biophysj.104.057364. [DOI] [PMC free article] [PubMed] [Google Scholar]
- 12.Widengren J, Mets Ü, Rigler R. Fluorescence correlation spectroscopy of triplet-states in solution: A theoretical and experimental study. J Phys Chem. 1995;99:13368–13379. [Google Scholar]
- 13.Eggeling C, Widengren J, Rigler R, Seidel CAM. Photobleaching of fluorescent dyes under conditions used for single-molecule detection: Evidence of two-step photolysis. Anal Chem. 1998;70:2651–2659. doi: 10.1021/ac980027p. [DOI] [PubMed] [Google Scholar]
- 14.Elson EL. Quick tour of fluorescence correlation spectroscopy from its inception. J Biomed Opt. 2004;9:857–864. doi: 10.1117/1.1779234. [DOI] [PubMed] [Google Scholar]
- 15.Palo K, Mets Ü, Jäger S, Kask P, Gall K. Fluorescence intensity multiple distributions analysis: Concurrent determination of diffusion times and molecular brightness. Biophys J. 2000;79:2858–2866. doi: 10.1016/S0006-3495(00)76523-4. [DOI] [PMC free article] [PubMed] [Google Scholar]
- 16.Gopich IV, Szabo A. Photon counting histograms for diffusing fluorophores. J Phys Chem B. 2005;109:17683–17688. doi: 10.1021/jp052345f. [DOI] [PubMed] [Google Scholar]
- 17.Kask P, Palo K, Ullmann D, Gall K. Fluorescence-intensity distribution analysis and its application in biomolecular detection technology. Proc Natl Acad Sci USA. 1999;96:13756–13761. doi: 10.1073/pnas.96.24.13756. [DOI] [PMC free article] [PubMed] [Google Scholar]
- 18.Chandrasekhar S. Stochastic problem in physics and astronomy. Rev Mod Phys. 1943;15:1–89. [Google Scholar]
- 19.Qian H, Sheetz MP, Elson EL. Single particle tracking. Analysis of diffusion and flow in two-dimensional systems. Biophys J. 1991;60:910–921. doi: 10.1016/S0006-3495(91)82125-7. [DOI] [PMC free article] [PubMed] [Google Scholar]
- 20.Willig KI, et al. Nanoscale resolution in GFP-based microscopy. Nat Methods. 2006;3:721–723. doi: 10.1038/nmeth922. [DOI] [PubMed] [Google Scholar]
- 21.Betzig E, et al. Imaging intracellular fluorescent proteins at nanometer resolution. Science. 2006;313:1642–1645. doi: 10.1126/science.1127344. [DOI] [PubMed] [Google Scholar]
- 22.Rust MJ, Bates M, Zhuang X. Sub-diffraction-limit imaging by stochastic optical reconstruction microscopy (STORM) Nat Methods. 2006;3:793–795. doi: 10.1038/nmeth929. [DOI] [PMC free article] [PubMed] [Google Scholar]
- 23.Kolin DL, Wiseman PW. Advances in image correlation spectroscopy: Measuring number densities, aggregation states, and dynamics of fluorescently labeled macromolecules in cells. Cell Biochem Biophys. 2007;49:141–164. doi: 10.1007/s12013-007-9000-5. [DOI] [PubMed] [Google Scholar]
- 24.Digman MA, et al. Fluctuation correlation spectroscopy with a laser-scanning microscope: Exploiting the hidden time structure. Biophys J. 2005;88:L33–36. doi: 10.1529/biophysj.105.061788. [DOI] [PMC free article] [PubMed] [Google Scholar]
- 25.Digman MA, Dalal R, Horwitz AF, Gratton E. Mapping the number of molecules and brightness in the laser scanning microscope. Biophys J. 2008;94:2320–2332. doi: 10.1529/biophysj.107.114645. [DOI] [PMC free article] [PubMed] [Google Scholar]
- 26.Chen Y, Müller JD, So PTC, Gratton E. The photon counting histogram in fluorescence fluctuation spectroscopy. Biophys J. 1999;77:553–567. doi: 10.1016/S0006-3495(99)76912-2. [DOI] [PMC free article] [PubMed] [Google Scholar]
- 27.Chen Y, Müller JD. Determining the stoichiometry of protein heterocomplexes in living cells with fluorescence fluctuation spectroscopy. Proc Natl Acad Sci USA. 2007;104:3147–3152. doi: 10.1073/pnas.0606557104. [DOI] [PMC free article] [PubMed] [Google Scholar]
Associated Data
This section collects any data citations, data availability statements, or supplementary materials included in this article.


