

Abstract
Rodents use their vibrissae (whiskers) to sense and navigate the environment. A main target of this sensory information is the superior colliculus in the midbrain, which rats can use to detect meaningful whisker stimuli in behavioral contexts. Here, we used field potential, single-unit, and intracellular recordings to show that, although cells in the intermediate layers of the superior colliculus respond relatively effectively to single whiskers, the cells respond much more robustly to simultaneous, or nearly simultaneous, wide-field (multiwhisker) stimuli. The enhanced multiwhisker response is temporally stereotyped, consisting of two short latency peaks caused by convergent trigeminal synaptic inputs and cortical feedback, respectively. The cells are highly sensitive to the degree of temporal dispersion and contact order of multiwhisker stimuli, which makes them excellent detectors of initial multiwhisker contact. In addition, their output is most robust during quiescent states because of the dependence of cortical feedback on forebrain activation, and this may serve as an alerting signal to drive orienting responses.
Keywords: superior colliculus, thalamus, barrel cortex, sensory processing, whisker, multiwhisker, rat, arousal
Introduction
Sensory information from the vibrissae (whiskers) enters the CNS via the trigeminal ganglion and travels to the brainstem trigeminal complex from where it is widely distributed throughout the brainstem, cerebellum, and diencephalon. Two main pathways ascend toward the forebrain from the trigeminal complex, one to the thalamus (trigeminothalamic) and another to the superior colliculus (trigeminotectal) in the midbrain (Killackey and Erzurumlu, 1981; Veazey and Severin, 1982; Huerta et al., 1983; Bruce et al., 1987; Rhoades et al., 1989; Veinante et al., 2000). Although the response properties of trigeminothalamic pathways have received considerable attention (for review, see Castro-Alamancos, 2004b), comparatively less is known about the response properties of trigeminotectal pathways. Superior colliculus cells are sensitive to single whisker stimulation and have large receptive fields with significant responses to a principal whisker (PW) and to several adjacent whiskers (AWs) (Stein and Dixon, 1979; Fujikado et al., 1981; Rhoades et al., 1983, 1987; McHaffie et al., 1989; Grunwerg and Krauthamer, 1990; Hemelt and Keller, 2007).
The superior colliculus is a major component of ascending loops through the basal ganglia (McHaffie et al., 2005; Redgrave and Gurney, 2006) and descending projections that give rise to orienting and escape responses (Sprague and Meikle, 1965; Schneider, 1969; Sparks, 1986; Dean et al., 1989; Westby et al., 1990; Redgrave et al., 1993; Stein and Meredith, 1993). It is an early hub for sensorimotor processing that appears well suited to mediate sensory detection of salient stimuli that require immediate action. Indeed, we recently found that, during inactivation of the trigeminothalamic pathway, animals can effectively detect and respond to conditioned whisker stimuli using the intact trigeminotectal pathway (Cohen and Castro-Alamancos, 2007). The ability of the superior colliculus to detect meaningful whisker information prompted us to further characterize whisker-evoked responses in superior colliculus cells.
Here, we show that, although superior colliculus cells respond relatively effectively to single whiskers, including the PW and several AWs, cells respond much more robustly to simultaneous, or nearly simultaneous, wide-field (multiwhisker) stimuli. The enhanced multiwhisker response is temporally stereotyped, consisting of two short latency excitatory peaks separated by ∼10 ms that have different characteristics and origins. These properties make superior colliculus cells highly sensitive to the degree of temporal dispersion of stimulated whiskers during multiwhisker stimulation.
Materials and Methods
Surgery.
Fifty-nine adult Sprague Dawley rats (300–350 g) were used in this study and cared for in accordance with National Institutes of Health guidelines for laboratory animal welfare. All experiments were approved by the Drexel University Institutional Animal Care and Use Committee. Rats were anesthetized with urethane (1.5 g/kg, i.p.) and placed in a stereotaxic frame. All skin incisions and frame contacts with the skin were injected with lidocaine (2%). Small craniotomies and small incisions of the dura were made over the target structures as necessary. Body temperature was automatically maintained constant with a heating pad at 37°C. The level of anesthesia was monitored with field potential (FP) recordings and limb withdrawal reflexes and kept constant at about stage III/3 (i.e., slow large amplitude FP cortical oscillations, absence of pinch withdrawal reflex, absence of whisker movements) using supplemental doses of urethane. For intracellular recording experiments, animals were subjected to the previous procedures but were also paralyzed with gallamine triethiodide (40 mg/kg supplemented every 2 h) and artificially ventilated through a tracheotomy.
Electrophysiology.
In every case, a tungsten electrode was lowered into the depth of the barrel cortex (0.6–1 mm) to record FP and multiunit activity. A second electrode was lowered into the superior colliculus to perform either FP and single-unit recordings or intracellular recordings from cells located within the following coordinates: 1.5–2.5 mm from lambda, 1.5–2.5 mm lateral from midline, and 3.5–5 mm in depth. These coordinates routinely yielded whisker responsive cells. Single-unit recordings were obtained using electrodes pulled from glass pipettes (10–30 MΩ) that were filled with saline. These electrodes generally record only a well discernible single unit of very large amplitude. Every single unit included in this study corresponds to a recording in which there was only one discernible large amplitude spike in the recording electrode. Intracellular recordings were obtained, using high-impedance (80–120 MΩ) sharp electrodes filled with K-acetate (2 m). All intracellular recordings included had overshooting action potentials and were stable for >15 min. Average responses shown are the mean of 15–30 stimulus trials per condition. The average was calculated after a median filter (20 kHz acquisition rate; moving time window, 60 points) was applied to each trace to remove the action potentials. A median filter substitutes each value with the median value in the moving time window.
In some cases, intracellular recordings were performed with electrodes filled with Neurobiotin (1% in 2 m K-acetate) in an attempt to label the cells. Stained neurons were visualized through standard avidin–biotin–peroxidase reaction with diaminobenzidine. Briefly, the brains were perfused using 4% paraformaldehye with 1% glutaraldehyde. Eighty micrometer sections were cut using a vibratome. Sections were incubated in 3% hydrogen peroxide, followed by 0.2% Triton X-100 and 2% goat serum. Incubation with ABC reagent (Vector Laboratories) occurred overnight. The following day, diaminobenzidine was applied to the sections. After color development, sections were mounted and cleared in xylene. Cells were later traced using Neurolucida software (MicroBrightField).
Whisker stimulation.
Sensory stimulation consisted of independently deflecting six single whiskers using six different whisker stimulators. The whiskers were trimmed to a length of ∼15 mm, and once a cell was isolated in the superior colliculus, a hand-held probe was used to identify the PW, the whisker evoking the strongest audible response. The hand-held mapping was then confirmed by placing a whisker stimulator on the PW and five other stimulators on AWs surrounding the PW. The PW always produced the most robust response (i.e., shortest latency and highest amplitude/probability response). The five AWs were selected as those producing the most robust responses after the PW. Each of the selected whiskers was inserted into a glass micropipette (1/0.5 mm outer/inner diameter) that was glued to the membrane of a miniature speaker. Each whisker was inserted into the micropipette for ∼5 mm, leaving ∼10 mm from the end of the micropipette to the skin. Application of a 1 ms square current pulse to the speaker deflected the micropipette and the whiskers inside. The resulting whisker deflection is very low amplitude (∼2°) and very high velocity (∼1000°/s) stimulus. Each whisker stimulator was calibrated using a sensing piezoelectric device attached to the glass pipette of the stimulator to monitor its movement and adjusting it by changing the current applied to the speaker. Note that each stimulator produced identical deflections during single-whisker and multiwhisker stimulations because nothing changed during these stimulation conditions. The whisker stimulators were oriented in the preferred direction to produce the largest response as determined with the hand probe. Each of the six whisker stimulators were driven by counter/timer boards controlled with Labview software (National Instruments).
Whisker stimulation was delivered according to the following protocols. A trial consisted of an initial 2 s without whisker stimulation followed by stimulation delivered to each whisker at 2 s intervals (the order of whisker stimulation was randomly selected). The first whisker was stimulated 2 s after the trial began, the second whisker was stimulated 4 s after the trial started, and so on, so that the sixth (last) whisker stimulus was delivered 12 s after the start of the trial. Thus, a single trial contained stimuli for all six whiskers and lasted a total of 14 s. Whisker stimulation at 10 Hz consisted of a train of 10 stimuli and the last stimulus in the train was used. When all whiskers were stimulated simultaneously (ALL) or at short interwhisker intervals (IWIs), each trial lasted 5 s. Every trial was repeated at least 30 times to derive peristimulus time histogram (PSTH) and to average FP and intracellular responses. In most experiments, protocols for single whisker stimulation and simultaneous multiwhisker stimulation were combined in the same trial, so that stimulation of each single whisker was followed (3 s after the last whisker) by stimulation of the six whiskers together in the same trial.
Data analysis.
Spontaneous cell firing was computed by counting the number of spikes during the 2–3 s period at the beginning of each trial and for a minimum of 30 trials. Unless indicated otherwise, population data are presented as mean ± SD. If the data were considered normally distributed, according to the Shapiro–Wilk normality test, we used parametric statistics. For two groups, we used the t test (paired or independent). For more than two groups, we tested for a significant main effect using the repeated-measures ANOVA followed by comparisons with Bonferroni's test (paired comparisons) or a one-way ANOVA followed by Tukey's test (independent comparisons). If the data were considered not normally distributed, we used nonparametric statistics. For two groups, we used the Wilcoxon signed ranks (paired comparisons) and the Mann–Whitney (nonpaired comparisons) tests. For more than two groups, we first tested for a significant main effect using the Friedman test (repeated measures) or the Kruskal–Wallis test (independent), followed by multiple comparisons with Wilcoxon and Mann–Whitney, respectively.
Results
Single-whisker receptive fields
Whisker-responsive single-units (n = 34) were recorded from the following coordinate ranges that comprise the intermediate layers: 1.3–2.6 mm from lambda (median, 2.25), 1.5–2.2 mm lateral (median, 2), and 3.8–5.3 mm in depth (median, 4.3). To assess the receptive field structure of whisker-responsive cells in the superior colliculus, we used six independent whisker stimulators and calculated sensory responses as the number of spikes per stimulus (spike probability) produced by each of the six deflected whiskers (Fig. 1A; PW, Aw1, Aw2, Aw3, Aw4, and Aw5) during a specific time window. We then compared the responses evoked by the whiskers to each other and to the spontaneous activity of the cell in the absence of whisker stimulation. Taking the entire cell population (n = 34 cells), and assessing a short-latency poststimulus time window of between 2 and 25 ms (Fig. 1C, short latency), we found that each of the six whiskers produced a response that was significantly (p < 0.05) above the spontaneous activity. Moreover, the PW produced a stronger response than any of the other whiskers (p < 0.01). The best AW (Aw1) produced a stronger response (p < 0.05) than the other AWs (Aw2–5), and Aw2 produced a stronger response (p < 0.05) than the remaining AWs (Aw3–5). Aw3, Aw4, and Aw5 did not differ between each other in evoked response. When we considered a longer latency poststimulus time window of between 26 and 100 ms (Fig. 1C, long latency), we found no significant effect of whisker stimulation on spike probability compared with the spontaneous activity and no significant difference between the whiskers.
Figure 1.
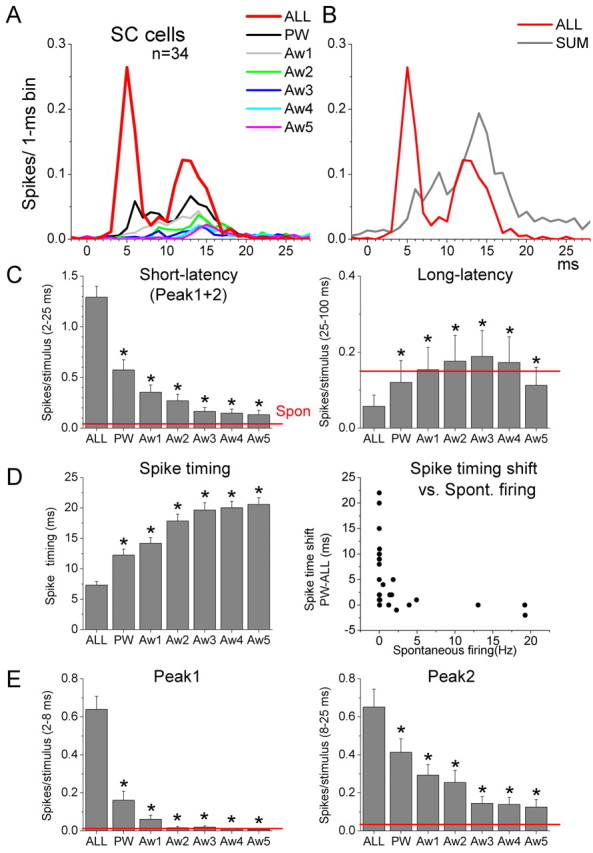
Effect of single-whisker and multiwhisker stimulation on single units in the superior colliculus. A, Population PSTHs of superior colliculus responses evoked by single-whisker stimulation of the PW and five AWs or by multiwhisker stimulation of these six whiskers (ALL). B, Population PSTHs of the multiwhisker response in A compared with the sum of the single-whisker responses in A (SUM). C, Effect of multiwhisker and single-whisker stimulation on short-latency and long-latency single-unit responses. The short-latency time window encompasses 2–25 ms poststimulus and the long-latency time window encompasses 25–100 ms. Note the increase in the short-latency spike probability during multiwhisker stimulation (ALL) and the suppression in the long-latency spike probability during multiwhisker stimulation. *p < 0.01 versus ALL. D, Effect of multiwhisker and PW stimulation on spike timing. Note that multiwhisker stimulation decreases spike timing. The right panel plots the change (shift) in spike timing measured by subtracting the timing of multiwhisker responses and the best single-whisker response (PW-ALL) versus the spontaneous firing of each cell. Note that cells with high spontaneous firing tend to shift less. *p < 0.01 versus ALL. E, Effect of multiwhisker and single-whisker stimulation on short-latency responses for peak1 (2–8 ms) and peak2 (8–25 ms) time windows. *p < 0.01 versus ALL. Error bars indicate SEM.
In addition to spike probability, another measure of sensory responses is spike timing. To measure spike timing in single units, we calculated for each cell the time from stimulus onset at which 30% of the spikes comprising the response time window (2–25 ms) occur (Fig. 1D, spike timing). Taking the entire cell population (n = 34 cells), we found that the PW had significantly faster spike timing than any of the other whiskers (p < 0.01). Aw1 also had faster responses than the other AWs (p < 0.05). However, the other AWs (Aw2–5) were not significantly different in spike timing among themselves. These results indicate that the receptive fields of superior colliculus cells are broad, and present varying degrees of response robustness per whisker. The responses to single whiskers measured in a fairly large window (2–25 ms) are relatively small, even for the PW (∼0.5 spikes/stimulus). Thus, in urethane-anesthetized rats, superior colliculus cells are characterized by broad whisker receptive fields and relatively sparse responses. We judge these single whisker responses as sparse compared with those we have previously recorded in ventral posterior medial nucleus of the thalamus (VPM) and barrel cortex under identical conditions. Moreover, they are also sparse compared with the responses evoked by the same cells during multiwhisker stimulation, as described below.
Multiwhisker enhancement of sensory responses
The previous results indicate that superior colliculus cells have significant responses to many single whiskers but these responses are usually sparse. Perhaps superior colliculus cells prefer more salient stimuli, such as multiwhisker stimulation. Thus, we next considered the impact of simultaneous multiwhisker stimulation of six whiskers, including the PW and five AWs (ALL).
Compared with PW responses, simultaneous multiwhisker stimulation of six whiskers using six independent whisker stimulators produced much stronger and sharper responses that were characterized by two short-latency peaks (peak1 and peak2) (Fig. 1A, red traces). Peak1 is an early response component that encompasses 2–8 ms poststimulus and peak2 is a later component that encompasses 8–25 ms poststimulus. The response evoked by multiwhisker stimulation was significantly greater than the response evoked by stimulation of the PW or any of the five AWs alone, during either peak1 (Fig. 1E) (2–8 ms; p < 0.01; n = 34), peak2 (Fig. 1E) (9–25 ms; p < 0.01; n = 34), or both time windows together (Fig. 1C) (2–25 ms; p < 0.01; n = 34). It was also evident that multiwhisker enhancement was much stronger during peak1 (400% of PW response) than during peak2 (158% of PW response). Moreover, the enhancement during the peak1 time period was so strong that, even if the responses to each single whisker were summed (Fig. 1B, SUM), the response evoked by multiwhisker stimulation was much stronger than the SUM response for peak1. Therefore, multiwhisker stimulation exerts a very robust enhancing effect on spike probability that is most obvious during the peak1 time window. Whereas spike probability for peak1 and peak2 was enhanced by multiwhisker stimulation, the spike probability for a longer latency time window of 25–100 ms was significantly suppressed by multiwhisker stimulation compared with the PW response or any of the AWs (Fig. 1C, long latency) (p < 0.01). However, this long-latency suppression by multiwhisker stimulation was only present (p < 0.01) in cells that had significant spontaneous firing (called FS cells) (6.3 ± 2 Hz; n = 11), and not (p = 0.7) in cells that had virtually no spontaneous firing (called LS cells) (0.01 ± 0.004 Hz; n = 23). Thus, multiwhisker stimulation enhances spike probability of short-latency responses (2–25 ms) by producing two sharp and distinct peaks, and suppresses spike probability of long-latency (25–100 ms) responses for cells that have spontaneous firing.
Multiwhisker response enhancement not only increased spike probability, but was also evident as a leftward shift in spike timing that led to faster spike onsets. Compared with the PW response, multiwhisker stimulation produced a significant leftward shift in spike timing from 12.2 ± 0.9 to 7.3 ± 0.6 ms (p < 0.01) (Fig. 1D), resulting in a ∼5 ms shorter latency during multiwhisker stimulation. Interestingly, such a shift in spike timing was present for LS cells (p < 0.01) but not for FS cells (p = 0.15) (Fig. 1D). However, it is worth noting that both FS and LS cells displayed multiwhisker enhancement of spike probability (2–25 ms window; p < 0.01) (data not shown). Compared with single-whisker stimulation, multiwhisker stimulation strongly enhances spike probability and reduces spike timing of superior colliculus cells. The reduction in spike timing is less evident in cells with spontaneous firing.
Multiwhisker responses during peak1 and peak2 are on average of equal strength in evoked spikes (∼0.6 spikes/stimulus) (Figs. 1E, 2A) and are significantly above the spontaneous activity (p < 0.01) (Fig. 1E). However, single-whisker responses measured during peak1 and peak2 showed clear differences (Fig. 1E). For peak1, only the PW (p < 0.01) and Aw1 (p < 0.05) responses were significantly above the spontaneous activity. Also, the PW and Aw1 responses were significantly stronger (p < 0.01) than the responses of the other whiskers, and the PW was stronger than Aw1 (p < 0.05). In contrast, for peak2, each of the six single whiskers produced a response that was significantly (p < 0.01) above the spontaneous activity. Also, the PW response was stronger than the response of Aw1 (p < 0.05) and the subsequent whiskers (Aw2–5; p < 0.01). The Aw1 response was stronger than the responses of Aw2 (p < 0.05) and the subsequent whiskers (Aw3–5; p < 0.01). The Aw2 response was stronger than the responses of the subsequent whiskers (Aw3–5; p < 0.01). Thus, the size of the receptive field is much smaller if peak1 is considered (two whiskers) than if peak2 is considered (all six whiskers). Interestingly, in most cells, stimulation of the PW produced responses with a stronger peak2 than peak1 (Fig. 2B). However, during multiwhisker stimulation, the majority of the cells shifted their responses to a stronger peak1 response (Fig. 2B), and the cells that had a larger peak2 response during multiwhisker stimulation also tended to have spontaneous firing (FS cells) (Fig. 2B).
Figure 2.
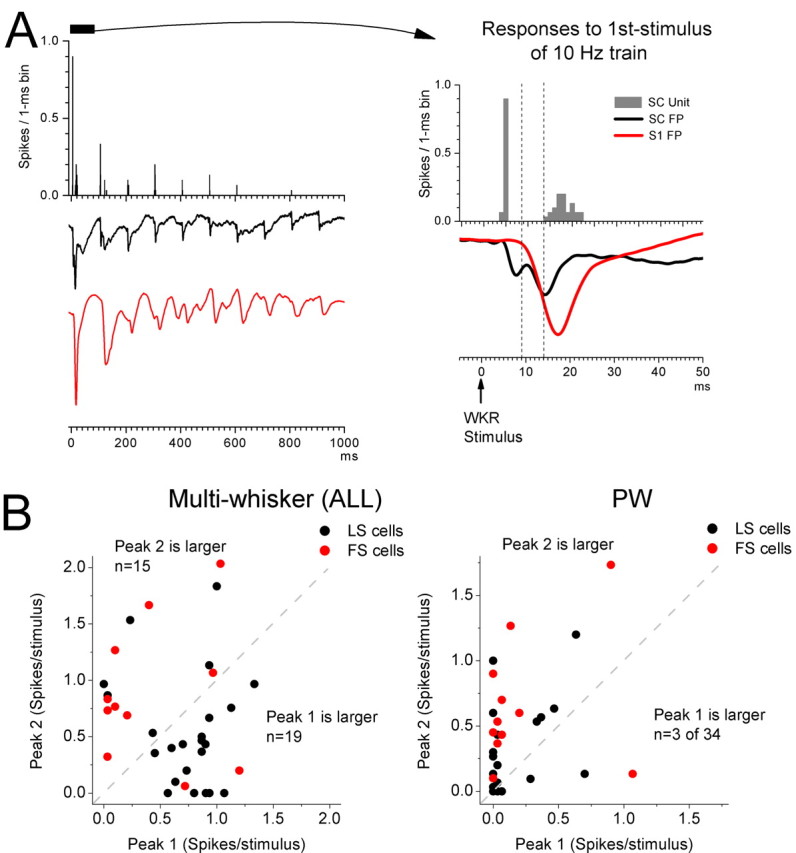
Characteristics of peak1 and peak2 single-unit responses in superior colliculus. A, Example of a single-unit PSTH and FP recorded through the same electrode in the superior colliculus (black trace) and FP recorded with another electrode in the barrel cortex (S1). The plot shows the responses evoked by a train of 10 stimuli delivered at 10 Hz and is the average of 30 trials. The right panel shows a close up of the first response in the train. Note the peak1 and peak2 responses in the PSTH and FP of the superior colliculus and that peak2 follows the barrel cortex response. B, Plot of peak1 versus peak2 single-unit responses for 34 cells during multiwhisker and single-whisker stimulation of the PW. Note that during single-whisker stimulation peak2 is usually larger, whereas during multiwhisker stimulation significant peak1 responses arise in the same cells. Red-colored cells are those that had some spontaneous firing (FS cells).
Another observation regarding single-unit peak1 and peak2 multiwhisker responses is that they have very different spike dispersion or jitter (Fig. 2A). During peak1, the cell produces consistent spike latencies across trials that lead to a very sharp response encompassing only about a single 1 ms bin. In contrast, during peak2 the cell produces spikes with much more jitter resulting in a broader response that encompasses several bins. This difference in spike jitter between peak1 and peak2 was observed for every cell in the superior colliculus that had both peaks during multiwhisker stimulation (n = 22). To measure the dispersion of both peaks, we calculated the SD of the spike times in each cell for both responses; the SDs were used as the measure of dispersion. We found that dispersion was three times larger in peak2 than in peak1 (0.49 ± 0.37 vs 1.48 ± 0.69 ms; p < 0.01; n = 22). Thus, simultaneous multiwhisker stimulation leads to a sharp peak1 response that is followed by a more dispersed peak2 response.
The previous results reveal that superior colliculus cells are much more responsive to multiwhisker stimulation than to single-whisker stimulation. Figure 2A shows a typical multiwhisker response (six whiskers are stimulated at 10 Hz) recorded from a single unit in the superior colliculus (this was an LS cell; no spontaneous firing). Also shown are FP responses recorded simultaneously from the same electrode in superior colliculus (black trace) and from another electrode in the barrel cortex (S1; red trace). Both electrodes had been carefully aligned so that they would record responses to the same set of stimulated whiskers. Notably, although superior colliculus and barrel cortex responses are very robust to the first stimulus in the 10 Hz train, all responses are strongly depressed by the 10 Hz stimulation. A close up (Fig. 2A) of the response to the first stimulus in the 10 Hz train reveals a clear peak1 and peak2 for the superior colliculus responses in both the PSTH and the FP. Moreover, the onset and time course of the barrel cortex FP response occurs after peak1 of the superior colliculus response, but precedes and tracks peak2. This suggests that the barrel cortex response could be related to peak2 in superior colliculus.
Laminar profile of multiwhisker FP responses
As mentioned above, multiwhisker enhancement was also observed in FP responses. Figure 3A shows FP responses (n = 14 experiments) evoked by single whiskers and by simultaneous stimulation of six whiskers at low frequency (0.2 Hz) and at high frequency (10 Hz). Single-unit PSTHs (n = 14 cells) for cells recorded through the same electrode are also shown for comparison. Two main negative deflections, peak1 and peak2, were clearly evoked in FP recordings during multiwhisker stimulation, and these FP peaks corresponded to the peaks observed during single-unit recordings. Moreover, high-frequency whisker stimulation strongly suppressed both peaks (Fig. 3A).
Figure 3.
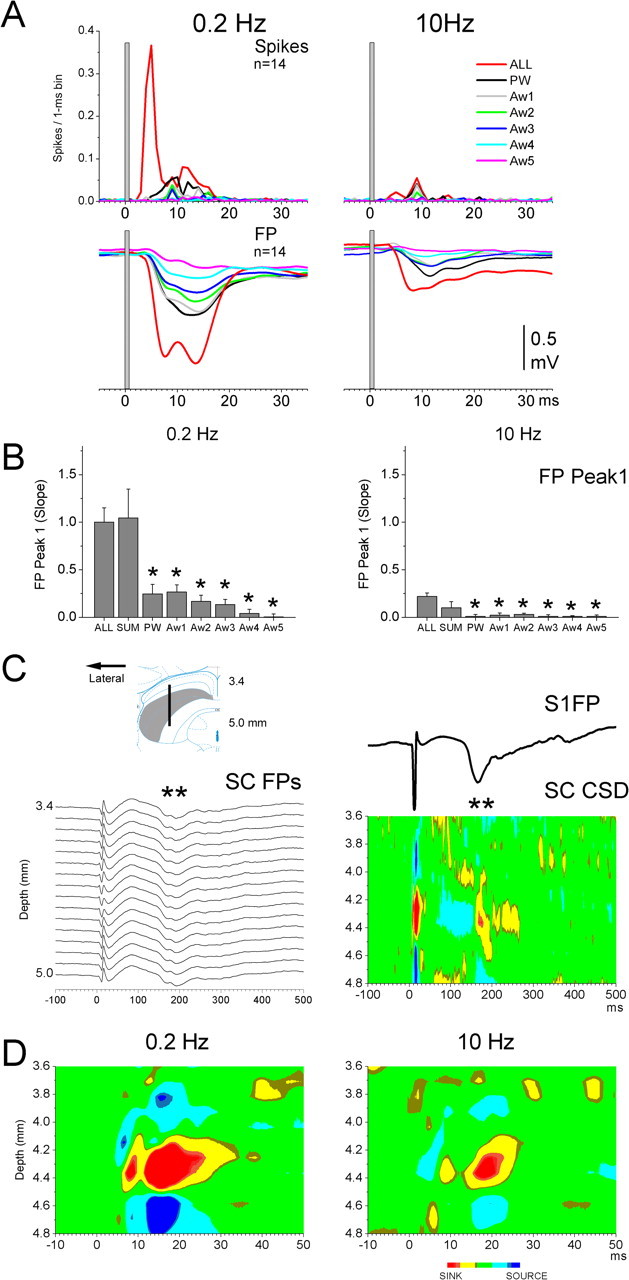
FP responses evoked in superior colliculus by whisker stimulation. A, Population PSTH and FP responses evoked in the superior colliculus by multiwhisker and single-whisker stimulation at low frequency (0.2 Hz) and at high frequency (10 Hz). Single-unit and FP responses were obtained through the same electrode. B, Measurement of FP slope for the data shown in A. SUM corresponds to measuring the slope of the sum of the single-whisker FP responses evoked by each of the six whiskers. *p < 0.01 versus ALL. Error bars indicate SEM. C, CSD analysis of multiwhisker responses recorded from a 16 channel linear array silicon probe inserted into the intermediate layers of the superior colliculus. The inset plots the location of the 16 electrodes. The FP responses (left panel) and the corresponding CSD (right panel) show that multiwhisker stimulation evokes a rebound response in barrel cortex (S1FP), which is associated with a corresponding current sink in the superior colliculus (marked by **). D, Close-up of the CSD response in superior colliculus. Note the existence of two current sinks that correspond in time to single-unit and FP peak1 and peak2 responses. The current sinks have associated current sources immediately above and below. The local current flow is suppressed during 10 Hz stimulation.
To quantify the FP responses, we measured the slope of peak1 as the negative slope between response onset and peak1. Multiwhisker stimulation produced a peak1 slope that was significantly steeper than that of any of the single whiskers (p < 0.01) (Fig. 3B). Moreover, FP peak1 slopes for the four best whiskers did not differ among themselves (PW, Aw1, Aw2, Aw3) indicating that the four best whiskers had similar population responses. If these responses converge in single cells, they may lead to synaptic summation and thus to a stronger multiwhisker response. If this is the case, then the sum of the peak1 responses from the single whiskers should produce a slope that is similar to the slope of the peak1 response produced by multiwhisker stimulation. Indeed, Figure 3B compared the peak1 slope of the multiwhisker response to the slope of the response resulting from the sum of the single whisker responses and found no significant difference (p = 0.5; n = 14). Thus, convergence of synaptic inputs from multiple whiskers may lead to the strong multiwhisker enhancement observed for peak1 in the superior colliculus. This hypothesis will be further addressed with intracellular recordings later.
To demonstrate that the whisker-evoked FP responses for peak1 and peak2 are generated locally within the superior colliculus, we used a 16-channel linear silicon probe to record FPs throughout the depth of the superior colliculus. FPs are recorded from all layers of the superior colliculus, but volume conduction from distant generators can produce some of these voltage traces. Thus, the FP recordings were used to derive a current source density analysis (CSD). CSD analyses are presented as the second derivative of potential as a function of depth, and serve to localize the origin of the extracellular currents. Sinks (plotted in red) reflect inward currents, and sources (in blue) reflect outward currents. Sinks and sources can be active or passive depending on whether they reflect active membrane conductance changes or passive return current. There are several concerns regarding the application of CSD to the superior colliculus. First, differences in resistivity in the extracellular space (e.g., between layers), which can affect the amplitude but not the location of recorded currents, may exist in the superior colliculus. Thus, we will not consider the absolute values of the CSD. A second concern is that current also flows in the horizontal plane within the superior colliculus, which could distort a one-dimensional CSD. However, we found that CSD samples obtained along parallel tracks give very similar profiles, suggesting little interference of horizontal flow. With these caveats in mind, it is important to note that our goal is not to describe the detailed interlaminar profile of current flow but simply to show that the FPs reflect local current flow originating within the superior colliculus. Figure 3C shows an example of recordings obtained from a 16 channel electrode placed at 1.8 mm lateral from the midline and 2.8 mm anterior from lambda. At these coordinates, and a depth of 5 mm, the 16 electrode sites span the intermediate layers (Fig. 3C, inset). The results show that multiwhisker stimulation produced a current sink that was located within the intermediate layers between 4.1 and 4.5 mm. Moreover, the corresponding current sources were located immediately above and below the current sink within the borders of the intermediate layers. Multiwhisker stimulation produced a short-latency sink that was followed by a long-latency (rebound) sink that peaked at ∼200 ms poststimulus (Fig. 3C, **). This rebound closely followed the typical FP rebound simultaneously recorded in the barrel cortex (Fig. 3C, S1FP). Similar results were obtained from eight other electrode penetrations in two animals.
A close-up of the short-latency current sink reveals both peak1 and peak2 components, and high-frequency whisker stimulation (10 Hz) depressed both of the current sinks and also the corresponding sources (Fig. 3D). These results indicate that peak1 and peak2 response components detected in the FP responses reflect local current flow within the intermediate layers of the superior colliculus, and confirm the primary location of whisker-responsive cells within the intermediate layers.
Fast corticotectal feedback contributes to peak2
The superior colliculus receives descending inputs from the barrel cortex (Wise and Jones, 1977), and our results (Figs. 2A, 3C) show that the barrel cortex response precedes peak2, but not peak1. Thus, feedback from barrel cortex could potentially cause peak2. We tested this hypothesis by applying drugs in the S1 barrel cortex via microdialysis to pharmacologically enhance [n = 5; bicuculline methiodide (BMI); 10–50 μm] or suppress (n = 5; TTX; 10 μm) whisker-evoked activity in S1. To monitor the effect of the drugs on cortical responses, we recorded FP and multiunit activity from a tungsten electrode placed adjacent to the microdialysis probe (∼800 μm in depth). The cortical electrode and a superior colliculus recording electrode were both aligned so that they would record a multiwhisker response during stimulation of the same set of whiskers (six whiskers).
Figure 4A shows data from one experiment consisting of a single-unit PSTH in superior colliculus and FP responses in S1 during control conditions, during application of BMI in S1 and during subsequent application of TTX in S1. BMI significantly increased the peak amplitude of the FP response in S1. Enhancement of the cortical response was accompanied by a selective increase in spike probability of the peak2 response in the superior colliculus, with little effect on the peak1 response. Subsequent application of TTX in S1 was followed by a complete abolishment of the cortical response, as well as a selective decrease of peak2 and no significant effect on peak1. Figure 4B shows another experiment. In this case, FPs were recorded in both S1 and superior colliculus. During control conditions, FP responses in superior colliculus consisted of prominent peak1 and peak2 components, and the cortical response precedes peak2. Application of TTX in S1 abolished the cortical response and selectively suppressed the peak2 component of the superior colliculus response.
Figure 4.

Effect of barrel cortex response enhancement and suppression on superior colliculus responses. A, Example of a single-unit PSTH recorded in the superior colliculus during control conditions (black), during application of a small dose of bicuculline (BMI) into the barrel cortex (blue) and during subsequent application of TTX in S1 (red). Shown below are the simultaneously recorded FP responses in barrel cortex. Traces are the mean of 30 trials. Note the selective enhancement of peak2 in superior colliculus during BMI in S1 and its suppression during TTX in S1. B, Another example showing FP recordings in both superior colliculus (FPSC) and in barrel cortex (FPS1) during control conditions and during application of TTX in barrel cortex (red). Note the suppression of peak2 during cortical inactivation. C, Effect of BMI and TTX in barrel cortex on peak1 and peak2 single-unit responses in the superior colliculus during multiwhisker and single-whisker stimulation (PW and Aw1 were considered together). D, Effect of BMI and TTX in barrel cortex on peak1 and peak2 FP responses in the superior colliculus during multiwhisker (ALL) and single-whisker stimulation of the PW or Aw1. Error bars indicate SEM. *p < 0.05, **p < 0.01.
Figure 4, C and D, shows population data from several experiments that tested the impact of BMI and TTX in S1 on single-unit (Fig. 4C) and FP (Fig. 4D) peak1 and peak2 superior colliculus responses. For multiwhisker stimulation, enhancement of cortical responses with BMI produced a significant increase of single-unit (p < 0.01; n = 5) (Fig. 4C) and of FP (p < 0.05; n = 5) (Fig. 4D) peak2 responses, but not of peak1 responses. Moreover, suppression of cortical responses with TTX produced a significant reduction of single-unit (p < 0.01; n = 3) (Fig. 4C) and of FP (p < 0.05; n = 5) (Fig. 4D) peak2 responses, but not of peak1 responses. The selective effects of cortical manipulations on peak2 responses indicate that multiwhisker peak2 responses are caused by feedback to superior colliculus from the barrel cortex.
We also tested the impact of cortical enhancement with BMI and cortical inactivation with TTX on single-whisker responses, including the PW and AW1. We found that for single-whisker responses, BMI in S1 significantly increased single-unit (p < 0.05; n = 5) (Fig. 4C) and FP (p < 0.05; n = 5) (Fig. 4D) peak2 responses, but not peak1 responses. Moreover, suppression of cortical responses with TTX produced a significant reduction of single-unit (p < 0.05; n = 3) (Fig. 4C) and of FP (p < 0.05; n = 5) (Fig. 4D) peak2 responses, but not of peak1 responses. These results indicate that a significant portion of superior colliculus spike responses (∼30%) evoked by single-whisker stimulation within the peak2 time window (8–25 ms) are relayed through the barrel cortex, whereas those that fall within the peak1 time window (2–8 ms) are not. In contrast, during multiwhisker stimulation most of the spike responses (∼90%) within the peak2 time window are relayed through the cortex, whereas those during the peak1 time window are not.
Intracellular correlates of sensory responses
FP and single-unit recordings indicate that multiwhisker stimulation produces a robust response that leads to two clearly differentiated peaks. To determine the subthreshold correlates of these responses, we performed intracellular recordings from superior colliculus cells. We recorded from 18 cells that responded to whisker stimulation. Whisker-responsive cells were located at a mean depth of 4.26 ± 0.35 mm (range, 3.7–4.9 mm; n = 18). Considering the coordinates we used (coordinates, 1.5–2.5 mm from lambda and 1.5–2.5 mm lateral from midline), this corresponds to the intermediate layers of the superior colliculus, which was confirmed by electrode tract tracing. The location of the cells was also confirmed in a few cases (n = 3) by labeling the recorded cell.
All the recorded cells presented a very consistent response profile of peak1 and peak2 EPSPs that could lead to the generation of action potentials. Figure 5 shows a typical example of a responsive cell that was also labeled and reconstructed. Multiwhisker stimulation produced two clearly differentiated depolarizations that correspond to peak1 and peak2 observed in FP and single-unit recordings (Fig. 5A). Simultaneous FP recordings were also obtained from an electrode placed in the barrel cortex that showed responses to the same whiskers (Fig. 5A, FPS1; 700 μm depth). Current pulses injected into this cell led to the generation of action potentials that showed little adaptation (Fig. 5B), and action potential frequency increased linearly as a function of current intensity (Fig. 5C). This firing behavior is characteristic of multipolar cells in the intermediate layer of rat superior colliculus studied in slices (Saito and Isa, 1999). Indeed, tracing of this cell labeled with Neurobiotin revealed that it was a multipolar cell located in the intermediate layer of the superior colliculus (Fig. 5D). In the present study, we focused on characterizing the subthreshold potentials evoked by whisker stimulation.
Figure 5.
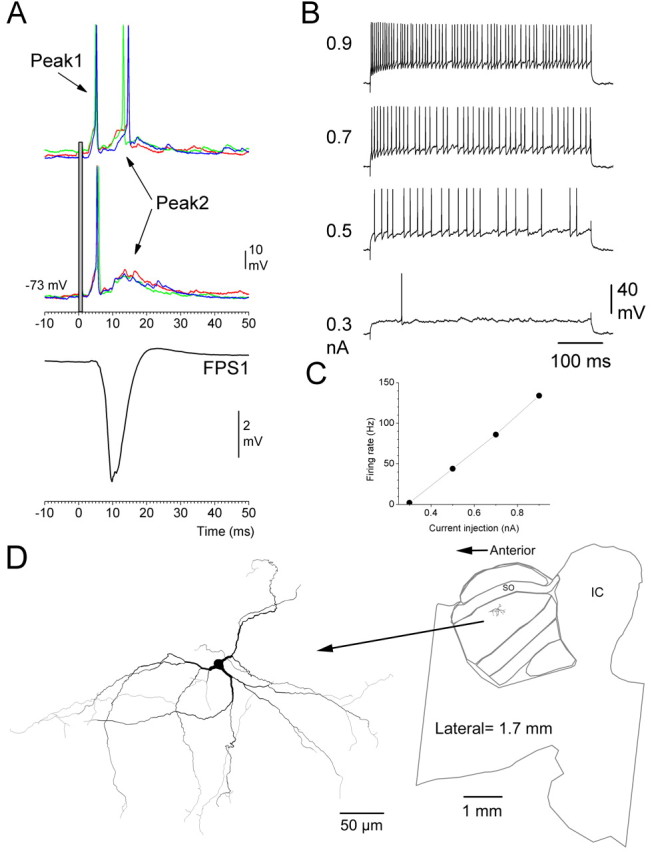
Intracellular recordings in superior colliculus. A, Effect of multiwhisker stimulation on intracellular potentials recorded from a superior colliculus cell located in the intermediate layers. Six trials are overlaid. The top trials evoked spikes during both peak1 and peak2 time windows, and the bottom trials only evoked spikes during peak1. Also shown is the FP response recorded simultaneously in the barrel cortex (FPS1; mean of the six trials). B, Effect of 500 ms intracellular current pulses on the firing of cell. C, Plot of current injection versus firing rate. D, Reconstruction of the cell revealed that it is a multipolar cell located in the intermediate layers.
Figure 6 shows another superior colliculus cell. Multiwhisker stimulation produced two excitatory peaks in all the cells, but the amplitude of both peaks differed among cells. Thus, some cells fired consistently in response to both peaks, and some cells fired only to peak1 or peak2, which agrees with the single-unit data presented above (Fig. 2B). PSTHs were generated from the intracellular records by detecting the intracellular spikes. As shown in Figure 6A, peak1 produces a fast rising depolarization that triggers consistent spike latencies across trials. Thus, peak1consists of a very sharp PSTH response encompassing a single 1 ms bin. In contrast, peak2 produced either one or two spikes on each trial riding on a broader depolarization that triggers spikes with much more jitter than peak1. The spike jitter results in a broader PSTH response for peak2 that encompasses several bins. In addition, the peak2 depolarization followed the onset of the cortical response in S1 (Fig. 6A, gray trace), in agreement with the role of the cortical response in triggering peak2.
Figure 6.

Intracellular correlates of peak1 and peak2 during multiwhisker and single-whisker responses. A, Multiwhisker responses evoked in another cell. Ten trails are shown. Peak1 always evoked a single spike and has little jitter. Peak2 evoked one spike in nine trials and two spikes in one of the trials. The bottom panel shows a PSTH of the spikes evoked in the superior colliculus cells and overlays the FP response recorded simultaneously in the barrel cortex (FPS1). The arrow in A and B indicates the existence of two components in the rising slope of the PSP. B, Subthreshold PSPs evoked by multiwhisker and single-whisker stimulation for the cell shown in A. The bottom panel shows the FP responses recorded simultaneously in the barrel cortex. C, Multiwhisker responses recorded at three different membrane potentials. The PSPs are overlaid for comparison. D, Plot of the peak amplitude of the response components indicated by arrows in C.
To reveal the subthreshold PSPs underlying peak1 and peak2 responses, the action potentials were eliminated from the intracellular recording using a median filter (Fig. 6B). Figure 6B, top panel, shows PSPs evoked in the superior colliculus cell by stimulation of each of six different whiskers separately or simultaneously. Figure 6B, bottom panel, shows FP responses recorded simultaneously in S1 during the same stimulation protocols (FPS1), which themselves show multiwhisker enhancement consisting of a ∼1 ms reduction of latency for the multiwhisker response compared with the PW response (Hirata and Castro-Alamancos, 2008). The multiwhisker EPSP in superior colliculus leading to peak1 had an onset latency of 2.5 ± 0.3 ms (n = 14), and this was consistent across all cells; only one cell had an onset latency >2.7 ms (3.8 ms). The rising phase of the peak1 EPSP was found to be composed of two components; a very fast rising component that was followed by a slower component leading to the spike onset. The two components (termed 1a and 1b) are clearly discernible in Figure 6, A and B, and the transition is marked by a black arrow. Independent measurement of the two peak1 components, in Figure 6, C and D, revealed that they have different voltage sensitivity; the second component (1b) is more strongly suppressed as the cell is slightly depolarized. This behavior is consistent with a low threshold current that is inactivated at depolarized levels. In contrast, the first component (1a) is more linearly reduced with depolarization, consistent with an EPSP (Fig. 6D). Interestingly, in all the cells in which we compared multiwhisker and single-whisker EPSPs (n = 6), we found that the peak1 EPSP produced by multiwhisker stimulation had a steeper slope than the EPSP produced by the PW (p < 0.01; n = 5) (Fig. 6B). Thus, multiwhisker stimulation produces a faster rising and stronger peak1 EPSP than single-whisker stimulation.
To reveal whether the whisker evoked EPSPs in superior colliculus cells were accompanied by IPSPs, we recorded the responses at different membrane potentials (Fig. 6C). If inhibition is present, then there should be a clearly observable hyperpolarizing potential, as the cell is depolarized because of the very different reversal potentials of EPSPs (∼0 mV) and IPSPs (around −75 mV). Figure 6C shows multiwhisker responses triggered while the cell was held at three different membrane potentials. At the most hyperpolarized potential, all the responses were depolarizing (−75 mV; black trace). However, as the cell was depolarized (−68 mV; green trace), there was an obvious prominent hyperpolarization that begins during peak1. This hyperpolarization lasts for tens of milliseconds but is interrupted by peak2, which rides on top of the hyperpolarization. Similar results were obtained in three different cells; each cell revealed similar IPSPs on top of which peak2 occurred (Fig. 6D). Thus, the results indicate that whisker-evoked responses produce a robust IPSP and that peak2 must overcome this inhibition to produce a spike.
Multiwhisker enhancement of peak1 is caused by trigeminotectal convergence
Because of its short latency, peak1 is caused by afferents from the trigeminal complex. Approximately 10–30% of Pr5 cells, which have large multipolar somata with expansive dendritic trees and multiwhisker receptive fields, project to the superior colliculus (Killackey and Erzurumlu, 1981; Huerta et al., 1983; Bruce et al., 1987; Veinante and Deschenes, 1999). Likewise, cells in Sp5 interpolaris (Sp5i) and Sp5 oralis (Sp5o), which have multiwhisker receptive fields, project to the superior colliculus (Huerta et al., 1983; Bruce et al., 1987; Veinante et al., 2000). In contrast, cells in Sp5 caudalis produce negligible projections to the superior colliculus (Killackey and Erzurumlu, 1981; Bruce et al., 1987; Rhoades et al., 1989). One explanation for the multiwhisker enhancement of peak1 is that it is caused by convergence of synaptic inputs from the trigeminal complex. If multiwhisker enhancement of peak1 is attributable to convergence of synaptic inputs driven by single whiskers that sum to produce a faster rising EPSP, then summing the EPSPs produced by single whiskers should yield an EPSP with a slope that is similar to the slope of the multiwhisker EPSP. Indeed, we found that summing the EPSPs evoked by each of the six whiskers stimulated alone produced an EPSP with an onset and rising slope similar to the multiwhisker EPSP (Fig. 7A). All the cells we measured that had fast EPSP onset latencies of <3 ms, showed this simple behavior (n = 5), in which multiwhisker enhancement of peak1 could be explained by convergence from single whiskers. In these cells, the onset and slope of the multiwhisker EPSP was not significantly different from that of the summed EPSP resulting from summing the single-whisker EPSPs. Moreover, these intracellular results are in close agreement with the FP data described above (Fig. 3B) showing that the slope of the summed FP response was not significantly different from the slope of the multiwhisker response.
Figure 7.

Convergence of trigeminal synaptic inputs explain multiwhisker enhancement of peak1. A, Overlay of multiwhisker responses (red) and the sum of the responses evoked by the six single-whiskers (green) reveals that the slope of peak1 overlaps but the slope of peak2 does not. The onset of the peak2 response evoked by multiwhisker stimulation is faster than the sum of the single-whisker responses, indicating that enhancement is already occurring in the origin of peak2 responses, the barrel cortex. B, Population PSTHs of single units recorded in the trigeminal complex (Sp5) and in layer 5, the origins of peak1 and peak2 responses, respectively. In Sp5, the multiwhisker response is not significantly different from the PW response. In layer 5, the multiwhisker response is faster than the PW response. C, D, Multiwhisker (ALL) and PW responses measured as spike timing and spike probability for Sp5 and layer 5 cells. Multiwhisker enhancement, measured as a reduction in spike timing, is present in layer 5 but not in Sp5. *p < 0.01. Error bars indicate SEM.
The previous results indicate that multiwhisker enhancement of peak1 can be explained by convergent inputs to superior colliculus cells from the stimulated whiskers. If this is the case, the cells providing the afferents that cause peak1 must not display multiwhisker enhancement themselves, because if they did they would simply relay the enhancement to the superior colliculus. Thus, there must be no evidence of multiwhisker enhancement in Pr5, Sp5i, and Sp5o. In a previous study, we found that, despite having multiwhisker receptive fields, Pr5 cells and their main targets, VPM cells, do not show any multiwhisker enhancement (Aguilar and Castro-Alamancos, 2005). In those cells, multiwhisker responses are identical with PW responses. Thus, because Pr5 cells do not produce multiwhisker enhancement, they cannot be relaying it to superior colliculus cells. To test whether Sp5i and Sp5o cells produce multiwhisker enhancement, we recorded from cells in those nuclei and measured their response to single-whisker and multiwhisker stimulation. Our electrode penetrations targeted both nuclei, and we combined the data. Figure 7B shows population data from cells in Sp5 (n = 6). All the cells recorded had multiwhisker receptive fields and a robust PW response, but there was no significant difference in spike timing (p = 0.9; 3–25 ms; n = 6) (Fig. 7C) or spike probability (p = 0.8; 2–8 ms; n = 6 cells) (Fig. 7D) between the PW response and the multiwhisker response. Thus, Sp5 cells are not relaying the multiwhisker enhancement to superior colliculus cells. Together with the intracellular and FP data, these results indicate that multiwhisker enhancement of peak1 in superior colliculus is caused by convergent synaptic inputs driven by the single stimulated whiskers that sum to produce a stronger response.
Multiwhisker enhancement of peak2
Regarding the multiwhisker enhancement of peak2, we have shown above that this response component is composed of feedback from the S1 barrel cortex (Fig. 4). Moreover, we also showed above that multiwhisker enhancement of peak2 is much less than that found for peak1 (Fig. 1E). There are two nonmutually exclusive options to explain multiwhisker enhancement of peak2. First, enhancement of peak2 responses may be generated in S1 cortex and relayed from there. Second, peak2 responses may be the result of convergence from multiple cortical barrel columns that sum to produce a larger response.
Regarding the first option, we have recently demonstrated (Hirata and Castro-Alamancos, 2008) that S1 cortical responses produce robust multiwhisker enhancement themselves that consists of a ∼1 ms reduction in spike latency in upper layer cells (layers 2–4), and this is clearly shown in the FP S1 responses in Figure 6B, bottom panel. To be sure that multiwhisker enhancement is also present in layer 5 cells that provide the afferents to the superior colliculus, we recorded from a population of layer 5 cells located between 1.3 and 1.6 mm in depth in barrel cortex (n = 10). All the cells recorded showed significant multiwhisker enhancement consisting of a 1.1 ± 0.2 ms reduction in spike timing during multiwhisker stimulation compared with PW stimulation (p < 0.01; 3–25 ms; n = 10) (Fig. 7C). There was no significant difference in spike probability between multiwhisker and PW responses (p = 0.3; 5–15 ms; n = 10 cells) (Fig. 7D). Thus, during multiwhisker stimulation, layer 5 cells produce faster responses and this should be manifested as a change in the onset of the peak2 EPSP in superior colliculus cells. The onset of the peak2 EPSP was measured as the ascending EPSP that originates from the descending phase of the peak1 EPSP. Indeed, we found that the peak2 EPSP caused by multiwhisker stimulation has a 1 ± 0.2 ms faster onset latency (p < 0.05; n = 5) than that caused by the PW EPSP (Fig. 7A).
Considering the change in EPSP onset, peak2 spikes driven by multiwhisker stimulation should occur faster than those driven by the single-whisker stimulation. Thus, we compared single-whisker and multiwhisker spike timing of superior colliculus cells with peak2 responses (9–25 ms; n = 14). We found that multiwhisker spike responses significantly shortened their spike latency by 1.1 ± 0.2 ms (p < 0.01; multiwhisker vs PW, 12.5 vs 13.6 ms). The fact that the spike timing shift was similar in superior colliculus cells (1.1 ± 0.2 ms) than in layer 5 cells (1.1 ± 0.2 ms) indicates that there is significant multiwhisker response enhancement in layer 5 cells that can account for the multiwhisker enhancement seen in peak2 of the superior colliculus response. Thus, multiwhisker enhancement of peak2 is clearly reflecting the enhancement already occurring in barrel cortex. However, our results do not exclude the possibility that layer 5 cells also converge from different cortical barrel columns to enhance the spike probability of peak2 responses in superior colliculus.
Interwhisker interval coding
The previous results indicate that simultaneous stimulation of six whiskers, including the PW, leads to a large enhancement of peak1 responses and a smaller but significant enhancement of peak2 responses. Next, we tested the impact of IWI during multiwhisker stimulation on evoked responses. In these experiments, when stimuli were applied at different intervals, the PW was either stimulated first (PW first) or last (PW last). In PW first trials, the PW was stimulated first and the additional whiskers were stimulated in descending order of responsiveness (i.e., Aw1, Aw2, Aw3…). In PW last trials, the whiskers were stimulated in ascending order of responsiveness (i.e., Aw5, Aw4, Aw3…) with the PW last. We measured how peak1 and peak2 evoked by the PW are affected by the interval between the whiskers (IWI) and the order of the PW in the whisker sequence.
Figure 8, A and C, shows population PSTHs (n = 13 cells) of PW first trials aligned to the first stimulated whisker (i.e., PW). Compared with the PW alone response (black trace), simultaneous stimulation of the six whiskers (red trace) produced strong enhancement of peak1 and peak2. However, the enhancement of peak1 and peak2 were rapidly and differentially affected by the IWI. The enhancement of peak1 was strongly reduced at 1 ms IWI and completely abolished at the 2 ms IWI. When the six whiskers are stimulated in sequence and the PW is first (descending order), a 2 ms IWI is sufficient to abolish the enhancement of peak1. Intriguingly, the enhancement of peak2 was unaffected at 1 ms IWI and was only slightly reduced at 2 and 3 ms IWIs. Thus, peak1 and peak2 are differentially affected by the IWI when the PW is stimulated first in a sequence. Figure 9 plots the percentage change of peak1 (Fig. 9A) and peak2 (Fig. 9B) multiwhisker responses at different IWIs compared with the single PW response. Whereas peak1 enhancement compared with the PW response was present only during simultaneous stimulation of the six whiskers (IWI = 0) and 1 ms IWI (p < 0.05), peak2 enhancement was significant for a range of IWIs between 0 and 10 ms (0, 1, 2, 3, 6, and 10 ms IWI; p < 0.05; n = 13). This indicates that peak1 enhancement is highly tuned to simultaneous or nearly simultaneous multiwhisker stimulation, whereas peak2 enhancement is more broadly tuned up to 10 ms IWI.
Figure 8.

Effect of IWI and whisker order during multiwhisker stimulation on superior colliculus single-unit responses. A, B, Population PSTHs of multiwhisker stimuli delivered simultaneously (ALL IWI, 0 ms) or at different IWI intervals (1, 2, and 3 ms) with the PW first (A) or the PW last (B). Also shown in A is the response evoked by the PW alone (black trace). The PSTHs are aligned to the first stimulated whisker. C, PW first trials. Some of the PSTHs shown in A are shown again (1, 2, and 3 ms IWI and PW), and additional IWIs are also shown for comparison. All the PSTHs are aligned to the fist stimulated whisker, which in the trials is the PW. Note the gradual reduction of peak2 as the IWI increases, until it reaches the PW amplitude. The PW alone response is shown below (black) for comparison. D, PW last trials. Some of the PSTHs shown in B are shown again (1, 2, and 3 ms IWI), but here they are aligned to the last whisker (PW). The PW alone response is shown below (black) for comparison. Note the gradual shift to the left of the response until it completely collapses at 10 ms IWI. Note also the absence of PW response, which begins to recover at 50 ms IWI.
Figure 9.

Population data showing the effect of IWI and whisker order on superior colliculus single-unit responses. The x-axis denotes the type of whisker stimulation starting with the PW alone (PW), followed by different IWIs when the PW was stimulated first (20–1 ms), followed by simultaneous multiwhisker stimulation (0 ms) and followed by IWIs when the PW was stimulated last (−1 to −50 ms). Responses are plotted as a percentage of the PW response. *p < 0.01 versus PW. A, Effect of IWI on peak1 responses measured from the PW stimulus onset. B, Effect of IWI on peak2 responses measured from the PW stimulus onset. C, Effect of IWI on responses measured in a longer time window that encompasses 2–120 ms from the first stimulated whisker. This window includes IWIs of up to 20 ms. Also shown is the spontaneous activity of the cells during this time window in the absence of whisker stimulation (gray). D, Effect of IWI on spike timing measured during the same time window as in C. The black symbols plot the timing from the onset of the first stimulus. The gray symbols plot the timing from the last whisker (PW), which reveals the leftward time shift observed in Figure 8D. Negative symbols are not shown. Error bars indicate SEM.
When the whiskers were stimulated in ascending order with the PW last (Fig. 8B), the multiwhisker enhancement of both peak1 and peak2 was absent at even 1 ms IWI. This is evident if the responses are aligned to the first stimulated whisker (i.e., Aw5 for these PW last trials), as shown in Figure 8B. Thus, there is no enhancement of either peak1 or peak2 if the whiskers are stimulated in ascending order. Interestingly, we found that in these PW last protocols, if the responses are aligned to the last stimulated whisker (PW), which shows how the PW response is affected by previous stimulation of other whiskers, the response is found to shift in time with respect to the PW (Fig. 8D). Basically, as the IWI increases, the response shifts to the left until the response completely collapses at 10 and 20 ms IWI, and then begins to recover to the normal PW response starting at 50 ms IWI.
Thus, if the PW is stimulated last, there are two effects. First, at very short IWIs (1–6 ms), the cooperativity between the different AWs is sufficient to drive a number of spikes equivalent to the PW response but this response shifts to the left with respect to the PW onset and becomes more dispersed as the IWI increases until it collapses. Second, at long IWIs (10–20 ms), the response is virtually abolished because the long IWI does not allow for cooperativity and the previously stimulated whiskers inhibit the responses of succeeding whiskers, including the PW. This IWI suppression commences to recover at 50 ms IWI (Fig. 8D, bottom panel). Therefore, multiwhisker responses are virtually inexistent for either peak1 or peak2 when the whiskers represented by the cell are stimulated in ascending order (PW last) and with an IWI >6 ms (Fig. 9A,B). This means that only the cells representing the first stimulated whiskers will fire and all other cells representing the succeeding whiskers in a sequence will be inhibited, which indicates a population code signaling the whiskers that first made contact.
In addition to measuring the peak1 and peak2 responses of the PW response as a function of IWI and order in the sequence, we also measured overall numbers of spikes (spike probability) and spike timing evoked during a 3–120 ms time window from the first stimulus (PW or Aw5). This response window encompasses IWIs of up to 20 ms for six whiskers. Figure 9, C and D, shows that both spike probability and spike timing were significantly affected by the IWI and the order in the sequence. When the PW is stimulated first, spike probability increases gradually as the IWI is reduced until simultaneous stimulation is achieved, and then spike probability falls abruptly when the PW is stimulated last starting at 1 ms IWI and the response becomes significantly less than the PW response at IWIs >3 ms (Fig. 9C).
A very similar effect is observed when spike timing is considered (Fig. 9D). Spike timing decreases gradually as the IWI is reduced and the PW is first until simultaneous stimulation is achieved, and then spike timing increases sharply when the PW is stimulated last, starting at 1 ms IWI and becoming significantly longer than the PW response at IWIs >3 ms (Fig. 9D, black symbols). As mentioned above, when the PW is stimulated last and spike timing is measured with respect to the PW onset (Fig. 9D, gray symbols), the latency continues decreasing from the multiwhisker response until it becomes negative (i.e., occurring earlier than the PW stimulus). This shifting response, which collapses completely at IWIs >6 ms, is not driven by the PW but instead by the convergence of the AWs that are stimulated before it. In a sense, the cell is no longer representing the PW but shifts its tuning to other AWs.
These results demonstrate that superior colliculus cells are highly sensitive to the order and temporal dispersion of multiwhisker stimulation. Cells are most responsive when the PW is stimulated first and AWs follow at short intervals between 0 and 10 ms, 0–1 ms range for peak1 and 0–10 ms for peak2. Intriguingly, when the PW is stimulated last and with an interval >2 ms, the cells do not respond at all to the PW and this suppression starts to recover at intervals >50 ms. Thus, populations of superior colliculus cells are tuned to respond robustly when their PW contacts an object first and other whiskers follow within up to 10 ms, and to remain silent when their PW contacts an object >2 ms after other whiskers. This indicates that superior colliculus cells are tuned to respond to the first set of whiskers that make nearly simultaneous contact with an object, which appears to be an effective detection signal that could drive orienting responses.
State-dependent superior colliculus responses
Under control conditions, when the FP activity recorded in the S1 barrel cortex is stable and no other manipulation has been performed, the responses of superior colliculus cells to controlled whisker stimulation are quite stable. Because we constantly monitor the cortical FP activity, we are able to establish periods during which the cortical activity showed signs of spontaneous forebrain activation, typical of arousal in behaving animals (Castro-Alamancos and Oldford, 2002; Castro-Alamancos, 2004a,b). This allowed us to compare in several superior colliculus cells (n = 8) multiwhisker responses during control (quiescent) states and during forebrain activation states. An example of an animal transitioning between forebrain quiescent and activated states is shown in Figure 10A. During the quiescent state, the cortical FP activity shows low-frequency high-amplitude activity that is suppressed during activation. As we have shown before, barrel cortex responses are suppressed during forebrain activation in both anesthetized and behaving animals (Castro-Alamancos and Oldford, 2002; Castro-Alamancos, 2004a). Interestingly, in the superior colliculus, the peak2 response was also suppressed, whereas the peak1 response was less affected during forebrain activation. Figure 10, B–D, shows population data comparing periods of forebrain quiescence to periods of activation in the same cells. Forebrain activation was accompanied by a significant suppression of low-frequency fast Fourier transform (FFT) power (0.5–10 Hz; p < 0.01; n = 8) (Fig. 10B) and FP responses in barrel cortex (peak amplitude; p < 0.01; n = 8) (Fig. 10B). We first measured the effect of forebrain activation on the spontaneous firing of superior colliculus cells. Four of the eight cells showed no change or a slight reduction in spontaneous firing during forebrain activation, whereas the other four cells showed a significant increase in spontaneous firing. We also measured the effect of forebrain activation on peak1 and peak2 responses evoked by multiwhisker stimulation. In all the cells, peak1 responses were only slightly affected, whereas peak2 responses were significantly reduced by forebrain activation (p < 0.01; n = 8) (Fig. 10C,D). Thus, forebrain activation suppresses cortical feedback to superior colliculus, which reduces the output of superior colliculus cells and their potential impact on target structures.
Figure 10.
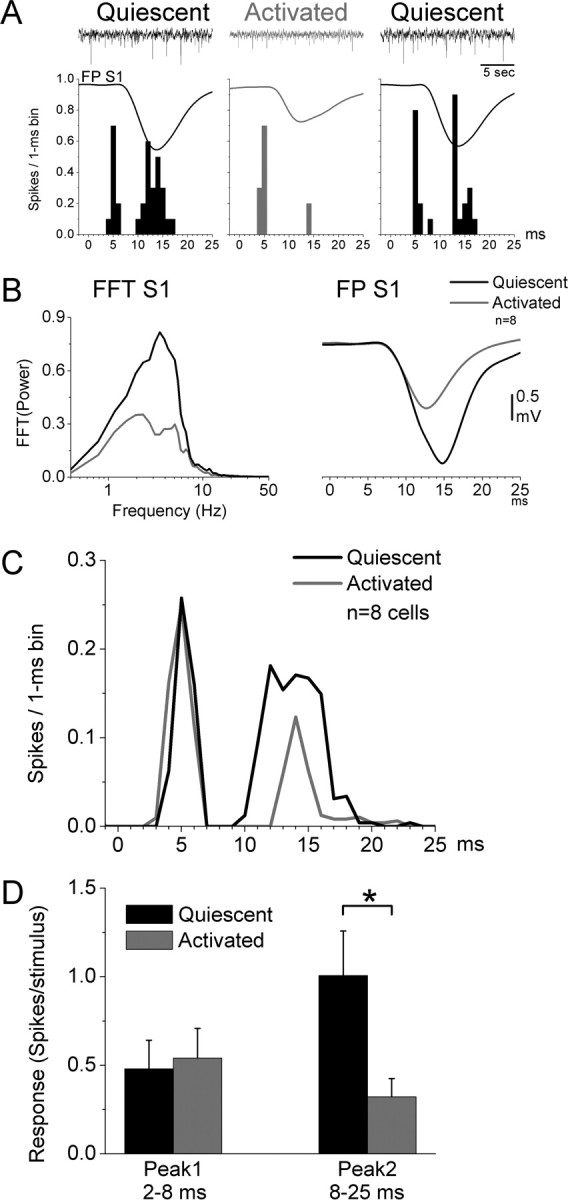
Effect of forebrain activation on superior colliculus multiwhisker responses. A, Example of the effect of a spontaneous transition between forebrain quiescent and activated states on the responses of a single unit in superior colliculus to multiwhisker stimulation. The FP activity recorded in the barrel cortex shows a typical sign of quiescence consisting of large amplitude slow oscillatory activity (black). This state is later interrupted by a period of activation (gray) that subsequently returns to quiescence (black). Shown below are the PSTHs obtained from a single unit in the superior colliculus in the three periods, and overlaid are also the FP responses simultaneously recorded from the barrel cortex. Note the suppression of the cortical response and of peak2 in the superior colliculus. B–D, Population data of cells that transitioned between quiescent and activated states. The FFT power spectrum and evoked FP responses in the barrel cortex for both states are shown in B. Population PSTHs of single-unit multiwhisker responses in the superior colliculus are shown in C. Population responses measured for the peak1 and peak2 time windows are shown in D. *p < 0.01. Error bars indicate SEM.
Discussion
Here, we show that although superior colliculus cells respond to single whiskers, including the PW and several AWs, the cells respond much more robustly to simultaneous, or nearly simultaneous, multiwhisker stimuli. The enhanced multiwhisker response is temporally stereotyped, consisting of two short-latency peaks separated by ∼10 ms. The spikes evoked during peak1 show very little jitter and are driven by direct trigeminotectal EPSPs from different single whiskers that sum to produce a robust multiwhisker response. The spikes evoked during peak2 are much more dispersed and are driven by feedback EPSPs returning to the superior colliculus from the barrel cortex that ride on top of an evoked IPSP. Consistent with their cortical origin, peak2 responses are highly dependent on the level of forebrain activation. These properties make superior colliculus cells highly sensitive to the order and temporal dispersion of multiwhisker stimulation. Cells are most responsive when the PW is stimulated first and AWs follow at short intervals between 0 and 10 ms. However, when the AWs are stimulated first and with an interval >2 ms, the cells do not respond at all to the PW and this suppression starts to recover at intervals >50 ms. Thus, populations of superior colliculus cells are tuned to respond robustly when their PW contacts an object first and other whiskers follow within <10 ms, and to remain silent when their PW contacts an object >2 ms after other whiskers. These response characteristics are likely useful to signal contact with an object as rats navigate the environment because a selective population of superior colliculus cells representing the first contacted whiskers will discharge. This may well serve as a signal to orient toward that contact location, which is a putative function of the superior colliculus. Moreover, the strength of the superior colliculus discharge will be stronger in quiescent animals because of the dependency of peak2 on the level of cortical activation, and this may be useful as a powerful alerting signal that is gated by the state of forebrain activation.
Peak1 is caused by convergent synaptic inputs from trigeminal complex cells driven by the single stimulated whiskers that sum to produce a stronger response. Peak1 responses are so short latency that there is little opportunity for integration of inputs other than from the trigeminal complex. Our results show that cells in the trigeminal complex do not enhance their responses during multiwhisker stimulation. Therefore, multiwhisker enhancement is not generated in the trigeminal complex and then relayed to the midbrain. Instead, intracellular and FP recordings showed that convergent synaptic inputs from different whiskers (barrelettes) sum to produce a much stronger synaptic response during multiwhisker stimulation. This indicates that superior colliculus cells are more sensitive to wide-field stimuli than to single whiskers.
Peak2 is caused by EPSPs returning from the barrel cortex that drive dispersed spikes. The jitter in the peak2 spikes may be caused by the fact that the peak2 EPSP rides on top of an IPSP. In cats, corticotectal inputs are very significant and have been extensively studied (Ogasawara et al., 1984; Norita et al., 1991; McHaffie et al., 1993; Niida et al., 1997). For example, inactivating the cortex affects the responses of superior colliculus cells to visual stimulation (McHaffie et al., 1993), and supralinear integration of responses from different sensory modalities in the superior colliculus is dependent on corticotectal pathways (Wallace and Stein, 1994; Wilkinson et al., 1996; Jiang et al., 2001). In rats, layer 5 cells of both the vibrissa motor and barrel cortex project to the superior colliculus (Wise and Jones, 1977; Miyashita et al., 1994). The direct pathway from the barrel cortex is the most likely source for peak2 in rats because multiwhisker responses are much stronger in barrel cortex than in motor cortex (our unpublished observations). Moreover, our results indicate that, whereas the vast majority of spikes evoked by multiwhisker stimulation during peak2 originate from cortical inputs, ∼30% of the spikes evoked by single-whisker stimulation during the peak2 time window originate from cortical inputs. Thus, during single-whisker stimulation, the superior colliculus is less influenced by the cortical feedback.
Because peak2 is caused by cortical feedback during multiwhisker stimulation, we measured the effects of multiwhisker enhancement in layer 5 cells. Similar to what we recently reported for upper layer cells (Hirata and Castro-Alamancos, 2008), layer 5 cells show multiwhisker enhancement that consists of a 1 ms shortening of spike latency. Interestingly, this same shift in EPSP onset was found for peak2 EPSPs in superior colliculus, indicating that part or most of the enhancement of peak2 (which is much less than the enhancement of peak1) is being reflected from the cortex. However, we emphasize that our results do not exclude the possibility that layer 5 cells also converge from different cortical barrel columns to enhance the spike probability of peak2 responses.
Functional roles
The traditional view is that the functional role of the superior colliculus is to determine the spatial localization of a stimulus, as opposed to determining what the stimulus is (Schneider, 1969). In agreement with this view, visual superior colliculus cells in the superficial layers are very sensitive to spatially localized changes in luminescence that signify appearance, disappearance, or movement in the visual field (Wurtz and Albano, 1980; Sparks, 1986; Stein and Meredith, 1993), but these cells are also mostly insensitive to static contrast, velocity wavelength, and stimulus configuration. Thus, the superior colliculus is well known to be involved in orienting responses to stimuli from a wide range of modalities, including somatosensory, auditory, and visual (Sprague and Meikle, 1965; Meredith and Stein, 1985; Dean et al., 1989; Stein, 1998). This is particularly relevant in light of the existence of overlapping multisensory maps in the deeper layers (Stein and Meredith, 1993). Orienting motor behaviors elicited by the superior colliculus occur via the crossed descending projections from the deeper layers (Dean et al., 1988, 1989; Westby et al., 1990; Redgrave et al., 1993). Moreover, the ability of the superior colliculus to control the direction and speed of eye (McHaffie and Stein, 1982) and head (Dean et al., 1986) movements is particularly germane in this orienting role. Stimulation of the superior colliculus also produces defensive behaviors, such as escape responses (Bandler et al., 1985; Dean et al., 1988, 1989; Brandao et al., 2003). Interestingly, superior colliculus cells in deeper layers also respond to noxious stimuli (Stein and Dixon, 1979; McHaffie et al., 1989; Redgrave et al., 1996a,b,c), and certain nocifensive reactions depend on the integrity of the superior colliculus (Redgrave et al., 1996b; Wang and Redgrave, 1997; McHaffie et al., 2002). In fact, it has been proposed that low-threshold whisker and nociceptive face inputs converge in the superior colliculus to control face orientation and withdrawal responses during active whisking exploration (McHaffie et al., 1989), which is so critical for navigation in rodents. In conclusion, the main role of the superior colliculus may be to detect novel or salient sensory stimuli and to elicit an appropriate response to approach, ignore, or escape from it. Our results are highly consistent with this functional backdrop.
We propose that a main functional role of the whisker-sensitive cells in the intermediate layers of the superior colliculus is to detect initial contact with a salient stimulus and to gate the induction of appropriate orienting responses depending on the level of alertness of the animal. If the animal is already alert, an initial contact does not need to elicit a strong orienting response. However, if the animal is quiescent or inattentive, an initial contact with a salient stimulus would robustly drive the output of whisker-sensitive cells in the intermediate layers, and this could well serve to trigger orienting responses from target nuclei. Accordingly, there are two major factors that regulate the output (impact) of whisker-sensitive cells in the intermediate layers. The first factor is the characteristics of the whisker contact. Cells will respond most effectively to multiwhisker stimuli when the PW is stimulated first and other whiskers follow shortly within 10 ms. This means that only the cells representing the first stimulated whiskers will fire and the cells representing the succeeding whiskers will be inhibited. Such an arrangement suggests a population code signaling the whiskers that first made contact. Therefore, superior colliculus cells would signal initial contact but not what the object is. This appears very useful during navigation and exploration to detect the presence of objects.
The second factor is the occurrence of peak1 and 2 in close succession. The occurrence of two successive spikes separated by short intervals has strong impact on the target neurons because of temporal synaptic summation. This is typically appreciated in bursting cells, but unlike an intrinsic burst, the interesting aspect of the superior colliculus response is that the first and second spikes are independently regulated. In particular, peak2 depends on cortical feedback, which is strongly regulated by behavioral state (Castro-Alamancos, 2004a,b). Thus, the strongest output of whisker-sensitive cells in the intermediate layers of the superior colliculus will occur for nearly simultaneous multiwhisker contacts during quiescent states. This appears useful as a powerful alerting stimulus in an animal that is sleeping, drowsy, or unattentive, and an unknown moving object or animal makes contact with its whiskers. Because the target of these cells in deeper layers and in the brainstem drive orienting responses (Redgrave et al., 1987b; Dean et al., 1989; Westby et al., 1990), such a powerful alerting output makes good functional sense. The more powerful output gated by the cortex could also serve to trigger forebrain activation in quiescent animals by impacting on neuromodulatory systems in the midbrain and brainstem that cause cortical activation (Castro-Alamancos, 2004b; Hirata et al., 2006). These neuromodulatory nuclei are well known targets of superior colliculus cells (Redgrave et al., 1987a, 1993; Dean et al., 1989). An important consideration is that our results reflect the activity of superior colliculus cells during passive whisker stimulation, typical of quiescent animals. It will be interesting to determine how these responses are affected by active (self-initiated) whisking.
In essence, these findings indicate that whisker-sensitive cells in the intermediate layers are excellent detectors of initial whisker contact, and their output (i.e., the ability to drive their target cells) is independently regulated by converging trigeminal synaptic inputs and cortical feedback. Because spikes driven by cortical feedback are gated by behavioral state, they provide a powerful mechanism for driving target cells depending on the level of arousal. This mechanism may serve to gate orienting responses and forebrain activation in quiescent animals.
Footnotes
This work was supported by the National Institutes of Health.
References
- Aguilar JR, Castro-Alamancos MA. Spatiotemporal gating of sensory inputs in thalamus during quiescent and activated states. J Neurosci. 2005;25:10990–11002. doi: 10.1523/JNEUROSCI.3229-05.2005. [DOI] [PMC free article] [PubMed] [Google Scholar]
- Bandler R, Depaulis A, Vergnes M. Identification of midbrain neurones mediating defensive behaviour in the rat by microinjections of excitatory amino acids. Behav Brain Res. 1985;15:107–119. doi: 10.1016/0166-4328(85)90058-0. [DOI] [PubMed] [Google Scholar]
- Brandao ML, Troncoso AC, Souza Silva MA, Huston JP. The relevance of neuronal substrates of defense in the midbrain tectum to anxiety and stress: empirical and conceptual considerations. Eur J Pharmacol. 2003;463:225–233. doi: 10.1016/s0014-2999(03)01284-6. [DOI] [PubMed] [Google Scholar]
- Bruce LL, McHaffie JG, Stein BE. The organization of trigeminotectal and trigeminothalamic neurons in rodents: a double-labeling study with fluorescent dyes. J Comp Neurol. 1987;262:315–330. doi: 10.1002/cne.902620302. [DOI] [PubMed] [Google Scholar]
- Castro-Alamancos MA. Absence of rapid sensory adaptation in neocortex during information processing states. Neuron. 2004a;41:455–464. doi: 10.1016/s0896-6273(03)00853-5. [DOI] [PubMed] [Google Scholar]
- Castro-Alamancos MA. Dynamics of sensory thalamocortical synaptic networks during information processing states. Prog Neurobiol. 2004b;74:213–247. doi: 10.1016/j.pneurobio.2004.09.002. [DOI] [PubMed] [Google Scholar]
- Castro-Alamancos MA, Oldford E. Cortical sensory suppression during arousal is due to the activity-dependent depression of thalamocortical synapses. J Physiol. 2002;541:319–331. doi: 10.1113/jphysiol.2002.016857. [DOI] [PMC free article] [PubMed] [Google Scholar]
- Cohen JD, Castro-Alamancos MA. Early sensory pathways for detection of fearful conditioned stimuli: tectal and thalamic relays. J Neurosci. 2007;27:7762–7776. doi: 10.1523/JNEUROSCI.1124-07.2007. [DOI] [PMC free article] [PubMed] [Google Scholar]
- Dean P, Redgrave P, Sahibzada N, Tsuji K. Head and body movements produced by electrical stimulation of superior colliculus in rats: effects of interruption of crossed tectoreticulospinal pathway. Neuroscience. 1986;19:367–380. doi: 10.1016/0306-4522(86)90267-8. [DOI] [PubMed] [Google Scholar]
- Dean P, Mitchell IJ, Redgrave P. Responses resembling defensive behaviour produced by microinjection of glutamate into superior colliculus of rats. Neuroscience. 1988;24:501–510. doi: 10.1016/0306-4522(88)90345-4. [DOI] [PubMed] [Google Scholar]
- Dean P, Redgrave P, Westby GW. Event or emergency? Two response systems in the mammalian superior colliculus. Trends Neurosci. 1989;12:137–147. doi: 10.1016/0166-2236(89)90052-0. [DOI] [PubMed] [Google Scholar]
- Fujikado T, Fukuda Y, Iwama K. Two pathways from the facial skin to the superior colliculus in the rat. Brain Res. 1981;212:131–135. doi: 10.1016/0006-8993(81)90039-1. [DOI] [PubMed] [Google Scholar]
- Grunwerg BS, Krauthamer GM. Vibrissa-responsive neurons of the superior colliculus that project to the intralaminar thalamus of the rat. Neurosci Lett. 1990;111:23–27. doi: 10.1016/0304-3940(90)90338-a. [DOI] [PubMed] [Google Scholar]
- Hemelt ME, Keller A. Superior sensation: superior colliculus participation in rat vibrissa system. BMC Neurosci. 2007;8:12. doi: 10.1186/1471-2202-8-12. [DOI] [PMC free article] [PubMed] [Google Scholar]
- Hirata A, Castro-Alamancos MA. Cortical transformation of wide-field (multi-whisker) sensory responses. J Neurophysiol. 2008;100:358–370. doi: 10.1152/jn.90538.2008. [DOI] [PMC free article] [PubMed] [Google Scholar]
- Hirata A, Aguilar J, Castro-Alamancos MA. Noradrenergic activation amplifies bottom-up and top-down signal-to-noise ratios in sensory thalamus. J Neurosci. 2006;26:4426–4436. doi: 10.1523/JNEUROSCI.5298-05.2006. [DOI] [PMC free article] [PubMed] [Google Scholar]
- Huerta MF, Frankfurter A, Harting JK. Studies of the principal sensory and spinal trigeminal nuclei of the rat: projections to the superior colliculus, inferior olive, and cerebellum. J Comp Neurol. 1983;220:147–167. doi: 10.1002/cne.902200204. [DOI] [PubMed] [Google Scholar]
- Jiang W, Wallace MT, Jiang H, Vaughan JW, Stein BE. Two cortical areas mediate multisensory integration in superior colliculus neurons. J Neurophysiol. 2001;85:506–522. doi: 10.1152/jn.2001.85.2.506. [DOI] [PubMed] [Google Scholar]
- Killackey HP, Erzurumlu RS. Trigeminal projections to the superior colliculus of the rat. J Comp Neurol. 1981;201:221–242. doi: 10.1002/cne.902010207. [DOI] [PubMed] [Google Scholar]
- McHaffie JG, Stein BE. Eye movements evoked by electrical stimulation in the superior colliculus of rats and hamsters. Brain Res. 1982;247:243–253. doi: 10.1016/0006-8993(82)91249-5. [DOI] [PubMed] [Google Scholar]
- McHaffie JG, Kao CQ, Stein BE. Nociceptive neurons in rat superior colliculus: response properties, topography, and functional implications. J Neurophysiol. 1989;62:510–525. doi: 10.1152/jn.1989.62.2.510. [DOI] [PubMed] [Google Scholar]
- McHaffie JG, Norita M, Dunning DD, Stein BE. Corticotectal relationships: direct and “indirect” corticotectal pathways. Prog Brain Res. 1993;95:139–150. [PubMed] [Google Scholar]
- McHaffie JG, Wang S, Walton N, Stein BE, Redgrave P. Covariant maturation of nocifensive oral behaviour and c-fos expression in rat superior colliculus. Neuroscience. 2002;109:597–607. doi: 10.1016/s0306-4522(01)00499-7. [DOI] [PubMed] [Google Scholar]
- McHaffie JG, Stanford TR, Stein BE, Coizet V, Redgrave P. Subcortical loops through the basal ganglia. Trends Neurosci. 2005;28:401–407. doi: 10.1016/j.tins.2005.06.006. [DOI] [PubMed] [Google Scholar]
- Meredith MA, Stein BE. Descending efferents from the superior colliculus relay integrated multisensory information. Science. 1985;227:657–659. doi: 10.1126/science.3969558. [DOI] [PubMed] [Google Scholar]
- Miyashita E, Keller A, Asanuma H. Input-output organization of the rat vibrissal motor cortex. Exp Brain Res. 1994;99:223–232. doi: 10.1007/BF00239589. [DOI] [PubMed] [Google Scholar]
- Niida T, Stein BE, McHaffie JG. Response properties of corticotectal and corticostriatal neurons in the posterior lateral suprasylvian cortex of the cat. J Neurosci. 1997;17:8550–8565. doi: 10.1523/JNEUROSCI.17-21-08550.1997. [DOI] [PMC free article] [PubMed] [Google Scholar]
- Norita M, McHaffie JG, Shimizu H, Stein BE. The corticostriatal and corticotectal projections of the feline lateral suprasylvian cortex demonstrated with anterograde biocytin and retrograde fluorescent techniques. Neurosci Res. 1991;10:149–155. doi: 10.1016/0168-0102(91)90037-y. [DOI] [PubMed] [Google Scholar]
- Ogasawara K, McHaffie JG, Stein BE. Two visual corticotectal systems in cat. J Neurophysiol. 1984;52:1226–1245. doi: 10.1152/jn.1984.52.6.1226. [DOI] [PubMed] [Google Scholar]
- Redgrave P, Gurney K. The short-latency dopamine signal: a role in discovering novel actions? Nat Rev Neurosci. 2006;7:967–975. doi: 10.1038/nrn2022. [DOI] [PubMed] [Google Scholar]
- Redgrave P, Mitchell IJ, Dean P. Descending projections from the superior colliculus in rat: a study using orthograde transport of wheatgerm-agglutinin conjugated horseradish peroxidase. Exp Brain Res. 1987a;68:147–167. doi: 10.1007/BF00255241. [DOI] [PubMed] [Google Scholar]
- Redgrave P, Mitchell IJ, Dean P. Further evidence for segregated output channels from superior colliculus in rat: ipsilateral tecto-pontine and tecto-cuneiform projections have different cells of origin. Brain Res. 1987b;413:170–174. doi: 10.1016/0006-8993(87)90165-x. [DOI] [PubMed] [Google Scholar]
- Redgrave P, Westby GW, Dean P. Functional architecture of rodent superior colliculus: relevance of multiple output channels. Prog Brain Res. 1993;95:69–77. doi: 10.1016/s0079-6123(08)60358-1. [DOI] [PubMed] [Google Scholar]
- Redgrave P, McHaffie JG, Stein BE. Nociceptive neurones in rat superior colliculus. I. Antidromic activation from the contralateral predorsal bundle. Exp Brain Res. 1996a;109:185–196. doi: 10.1007/BF00231780. [DOI] [PubMed] [Google Scholar]
- Redgrave P, Simkins M, McHaffie JG, Stein BE. Nociceptive neurones in rat superior colliculus. II. Effects of lesions to the contralateral descending output pathway on nocifensive behaviours. Exp Brain Res. 1996b;109:197–208. doi: 10.1007/BF00231781. [DOI] [PubMed] [Google Scholar]
- Redgrave P, Telford S, Wang S, McHaffie JG, Stein BE. Functional anatomy of nociceptive neurones in rat superior colliculus. Prog Brain Res. 1996c;107:403–415. doi: 10.1016/s0079-6123(08)61878-6. [DOI] [PubMed] [Google Scholar]
- Rhoades RW, Mooney RD, Jacquin MF. Complex somatosensory receptive fields of cells in the deep laminae of the hamster's superior colliculus. J Neurosci. 1983;3:1342–1354. doi: 10.1523/JNEUROSCI.03-07-01342.1983. [DOI] [PMC free article] [PubMed] [Google Scholar]
- Rhoades RW, Mooney RD, Klein BG, Jacquin MF, Szczepanik AM, Chiaia NL. The structural and functional characteristics of tectospinal neurons in the golden hamster. J Comp Neurol. 1987;255:451–465. doi: 10.1002/cne.902550311. [DOI] [PubMed] [Google Scholar]
- Rhoades RW, Fish SE, Chiaia NL, Bennett-Clarke C, Mooney RD. Organization of the projections from the trigeminal brainstem complex to the superior colliculus in the rat and hamster: anterograde tracing with Phaseolus vulgaris leucoagglutinin and intra-axonal injection. J Comp Neurol. 1989;289:641–656. doi: 10.1002/cne.902890409. [DOI] [PubMed] [Google Scholar]
- Saito Y, Isa T. Electrophysiological and morphological properties of neurons in the rat superior colliculus. I. Neurons in the intermediate layer. J Neurophysiol. 1999;82:754–767. doi: 10.1152/jn.1999.82.2.754. [DOI] [PubMed] [Google Scholar]
- Schneider GE. Two visual systems. Science. 1969;163:895–902. doi: 10.1126/science.163.3870.895. [DOI] [PubMed] [Google Scholar]
- Sparks DL. Translation of sensory signals into commands for control of saccadic eye movements: role of primate superior colliculus. Physiol Rev. 1986;66:118–171. doi: 10.1152/physrev.1986.66.1.118. [DOI] [PubMed] [Google Scholar]
- Sprague JM, Meikle TH., Jr The role of the superior colliculus in visually guided behavior. Exp Neurol. 1965;11:115–146. doi: 10.1016/0014-4886(65)90026-9. [DOI] [PubMed] [Google Scholar]
- Stein BE. Neural mechanisms for synthesizing sensory information and producing adaptive behaviors. Exp Brain Res. 1998;123:124–135. doi: 10.1007/s002210050553. [DOI] [PubMed] [Google Scholar]
- Stein BE, Dixon JP. Properties of superior colliculus neurons in the golden hamster. J Comp Neurol. 1979;183:269–284. doi: 10.1002/cne.901830205. [DOI] [PubMed] [Google Scholar]
- Stein BE, Meredith MA. The merging of the senses. Cambridge, MA: MIT; 1993. [Google Scholar]
- Veazey RB, Severin CM. Afferent projections to the deep mesencephalic nucleus in the rat. J Comp Neurol. 1982;204:134–150. doi: 10.1002/cne.902040204. [DOI] [PubMed] [Google Scholar]
- Veinante P, Deschênes M. Single- and multi-whisker channels in the ascending projections from the principal trigeminal nucleus in the rat. J Neurosci. 1999;19:5085–5095. doi: 10.1523/JNEUROSCI.19-12-05085.1999. [DOI] [PMC free article] [PubMed] [Google Scholar]
- Veinante P, Jacquin MF, Deschênes M. Thalamic projections from the whisker-sensitive regions of the spinal trigeminal complex in the rat. J Comp Neurol. 2000;420:233–243. doi: 10.1002/(sici)1096-9861(20000501)420:2<233::aid-cne6>3.0.co;2-t. [DOI] [PubMed] [Google Scholar]
- Wallace MT, Stein BE. Cross-modal synthesis in the midbrain depends on input from cortex. J Neurophysiol. 1994;71:429–432. doi: 10.1152/jn.1994.71.1.429. [DOI] [PubMed] [Google Scholar]
- Wang S, Redgrave P. Microinjections of muscimol into lateral superior colliculus disrupt orienting and oral movements in the formalin model of pain. Neuroscience. 1997;81:967–988. doi: 10.1016/s0306-4522(97)00191-7. [DOI] [PubMed] [Google Scholar]
- Westby GW, Keay KA, Redgrave P, Dean P, Bannister M. Output pathways from the rat superior colliculus mediating approach and avoidance have different sensory properties. Exp Brain Res. 1990;81:626–638. doi: 10.1007/BF02423513. [DOI] [PubMed] [Google Scholar]
- Wilkinson LK, Meredith MA, Stein BE. The role of anterior ectosylvian cortex in cross-modality orientation and approach behavior. Exp Brain Res. 1996;112:1–10. doi: 10.1007/BF00227172. [DOI] [PubMed] [Google Scholar]
- Wise SP, Jones EG. Somatotopic and columnar organization in the corticotectal projection of the rat somatic sensory cortex. Brain Res. 1977;133:223–235. doi: 10.1016/0006-8993(77)90760-0. [DOI] [PubMed] [Google Scholar]
- Wurtz RH, Albano JE. Visual-motor function of the primate superior colliculus. Annu Rev Neurosci. 1980;3:189–226. doi: 10.1146/annurev.ne.03.030180.001201. [DOI] [PubMed] [Google Scholar]