Abstract
Fibroblast growth factor 23 (FGF23) is a phosphaturic factor that suppresses both sodium-dependent phosphate transport and production of 1,25-dihydroxyvitamin D [1,25(OH)2D] in the proximal tubule. In vitro studies suggest that FGFR3 is the physiologically relevant receptor for FGF23 in the kidney, but this has not been established in vivo. Here, immunohistochemical analysis of the mouse kidney revealed that the proximal tubule expresses FGF receptor 3 (FGFR3) but not FGFR1, FGFR2, or FGFR4. Compared with wild-type mice, Hyp mice, which have elevated circulating levels of FGF23, exhibited low levels of serum phosphate and 1,25(OH)2D, reduced expression of the sodium-dependent phosphate transporter NPT2a in the proximal tubules, and low bone mineral density as a result of osteomalacia. In contrast, neither the serum phosphate nor 1,25(OH)2D levels were altered in FGFR3-null mice. For examination of the role of FGFR3 in mediating the effects of FGF23, Hyp mice were crossed with FGFR3-null mice; interestingly, this failed to correct the aforementioned metabolic abnormalities of Hyp mice. Ablation of FGFR4 also failed to correct hypophosphatemia in Hyp mice. Because the ablation of neither FGFR3 nor FGFR4 inhibited the renal effects of excess FGF23, the kidney localization of FGFR1 was investigated. FGFR1 co-localized with Klotho, the co-factor required for FGF23-dependent FGFR activation, in the distal tubule. In summary, neither FGFR3 nor FGFR4 is the principal mediator of FGF23 effects in the proximal tubule, and co-localization of FGFR1 and Klotho suggests that the distal tubule may be an effector site of FGF23.
Fibroblast growth factor 23 (FGF23), a phosphaturic factor predominantly produced by osteocytes in bone,1 causes hypophosphatemia, suppression of 1,25-dihydroxyvitamin D [1,25(OH)2D] production, and rickets/osteomalacia.1–4 Excess FGF23 mediates renal phosphate wasting in hereditary human hypophosphatemic disorders, including autosomal dominant hypophosphatemic rickets,5,6 X-linked hypophosphatemia,7,8 and autosomal recessive hypophosphatemic rickets.9,10 Elevated FGF23 also mediates hypophosphatemia in several acquired disorders, including tumor-induced osteomalacia,11 McCune-Albright syndrome, and polyostotic fibrous dysplasia.12
FGF23 inhibits the sodium-dependent phosphate transporter and CYP27B1 activity in the proximal tubule of the kidney, leading to phosphaturia and reduced production of 1,25(OH)2D.2,11,13,14 FGF23 binds to and activates FGF receptors (FGFR) 1c, 3c, and 4 in cell lines that coexpress Klotho, a transmembrane protein co-factor that determines the tissue specificity of FGF23.15,16 FGF23 has been shown to inhibit directly phosphate transport and to suppress 1α-hydroxylase gene expression in isolated proximal tubules and/or proximal tubule–derived cell lines in vitro,14,17–19 which were recently shown to express Klotho transcripts by reverse transcription–PCR (RT-PCR).14 Of the four members of the FGFR family, all of which are expressed in the kidney at specific locations,20 FGFR3 is the likely physiologically relevant FGF23 receptor, because it binds FGF23 in vitro and is the major FGFR expressed in the proximal tubule,20 but the role of FGFR3 in mediating FGF23 actions has not been directly tested in vivo. To determine whether FGFR3 is the physiologically relevant FGF23 receptor in the kidney, we examined sites of FGFR3 and Klotho expression in the kidney and used mouse genetic approaches to ablate FGFR3 in Hyp mice, a model of FGF23 excess characterized by hypophosphatemia and aberrant production of 1,25(OH)2D.21–23
RESULTS
Localization of FGFR and Klotho in the Kidney
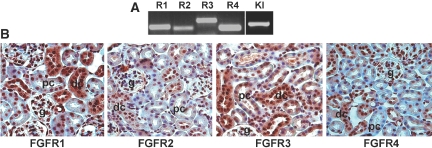
There are four known FGF receptors.24,25 RT-PCR analysis identified all four FGFR and Klotho transcripts in the adult mouse kidney (Figure 1A). By immunostaining, we observed that FGFR3 is expressed in both in the proximal tubule and the distal tubule with higher expression in the distal tubule (Figure 1B). In contrast, FGFR1, 2, and 4 were not present in the proximal tubule. Rather, FGFR1 and FGFR4 were expressed in the distal tubules (Figure 1B), whereas FGFR2 was expressed mainly in the macula densa (Figure 1B).
Figure 1.
Expression of FGFR and Klotho in the kidney. (A) RT-PCR analysis identifies all four FGFR (R1 through 4) and Klotho are expressed in kidney. RT-PCR products from total RNA isolated from kidney of 6-wk-old WT mice were separated and visualized in 2% agarose gel containing ethidium bromide. (B) Immunohistologic analysis of FGFR expression in the kidney. FGFR3 is expressed in the proximal and distal tubules, whereas FGFR1 and 4 are expressed in the distal tubule. FGFR2 is expressed in the macula densa. g, glomerulus; pc, proximal convoluted tubule; dc, distal convoluted tubule. The identity of the tubular segments was confirmed by immunohistochemistry with antibodies to proximal and distal markers (see Figure 7). Magnification, ×200.
Effects of FGFR3 Deletion on Gross Appearance, Hypophosphatemia, and Aberrant 1,25(OH)2D Regulation in Hyp Mice
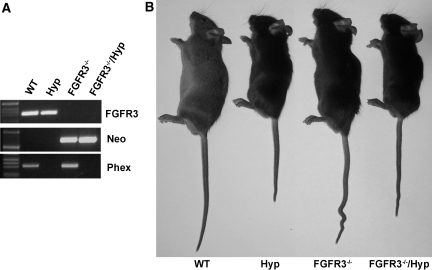
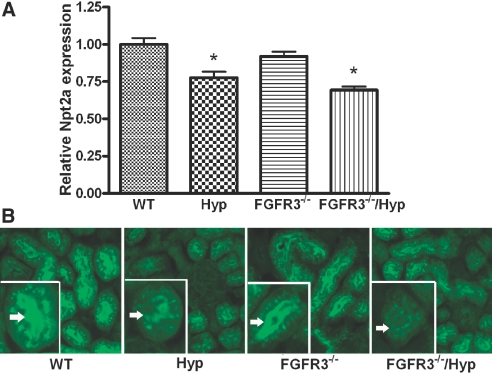
To investigate the role of FGFR3 in mediating FGF23 effects, we transferred FGFR3 deficiency onto the Hyp mouse background. Mice were genotyped by PCR (Figure 2). Mice were born at the expected Mendelian frequency, and mutant mice had survival rates identical to wild-type (WT) mice. At 6 wk of age, Hyp mice displayed growth retardation, whereas FGFR3−/− mice showed kyphosis and wavy, elongated tails, as previously reported.26 Superimposing FGFR3 deficiency on Hyp mice resulted in both growth retardation and kyphosis and tail distortion in combined FGFR3−/−/Hyp mice (Figure 2). Consistent with our previous findings,27 we found increased circulating FGF23 levels, hypophosphatemia, and inappropriately normal 1,25(OH)2D levels for the degree of hypophosphatemia in Hyp mice (Table 1) .In contrast, the serum phosphorus, 1,25(OH)2D, and FGF23 levels did not differ between FGFR3-null and WT mice (Table 1). More important, in combined FGFR3−/−/Hyp mice, the absence of FGFR3 failed to correct the hypophosphatemia or aberrant 1,25(OH)2D levels in Hyp mice (Table 1). The expression of the sodium-dependent phosphate transporter (NPT2a) transcripts and protein were decreased in the proximal tubule of both Hyp and combined FGFR3−/−/Hyp mice (Figure 3), consistent with the failure of FGFR3 ablation to rescue the hypophosphatemia. In contrast, the relative mRNA expression levels of Cyp27b1 was slightly increased but not significantly different between WT and mutant mice (mean ± SEM 1.0 ± 0.1 in WT, 1.5 ± 0.4 in Hyp, 1.2 ± 0.2 in FGFR3−/−, and 1.5 ± 0.4 in combined FGFR3−/−/Hyp mice; n ≥ 5), consistent with the previously reported posttranscriptional defect that underlies the abnormal vitamin D metabolism in Hyp mice.28
Figure 2.
Generation of combined Phex- and FGFR3-deficient mice. (A) Genotyping of mice by PCR. Representative PCR analysis of genomic DNA for the FGFR3 gene (top), neomycin cassette (middle), and Phex gene (bottom) in WT, Hyp, FGFR3−/−, and combined FGFR3−/−/Hyp mice. (B) Gross appearance of WT, Hyp, FGFR3−/−, and combined FGFR3−/−/Hyp mice at 6 wk of age.
Table 1.
Serum biochemistry of WT, Hyp, FGFR3−/−, and FGFR3−/−/Hypa
| Serum Markers | WT | Hyp | FGFR3−/− | FGFR3−/−/Hyp |
|---|---|---|---|---|
| Phosphorus (mg/dl) | 9.5 ± 0.2 | 5.7 ± 0.3b | 9.6 ± 0.2 | 6.1 ± 0.4b |
| Calcium (mg/dl) | 8.6 ± 0.1 | 8.6 ± 0.2 | 8.6 ± 0.2 | 8.6 ± 0.2 |
| 1,25(OH)2D (pM) | 156 ± 9 | 134 ± 11 | 149 ± 17 | 155 ± 15 |
| PTH (pg/ml) | 73 ± 4 | 88 ± 6 | 68 ± 6 | 70 ± 5 |
| FGF23 (pg/ml) | 92 ± 10 | 1200 ± 97b | 96 ± 6 | 2324 ± 308b,c |
Data are means ± SEM from at least seven mice at 6 wk of age. One-way ANOVA was used for statistic analysis. PTH, parathyroid hormone.
Significantly different compared with WT (P < 0.05).
Significantly different compared with Hyp mice (P < 0.05).
Figure 3.
Expression of NPT2a in kidneys from WT, Hyp, FGFR3−/−, and FGFR3−/−/Hyp mutant mice at 6 wk of age. (A) The levels of NPT2a mRNA in the kidneys from WT and mutant mice were measured by real-time RT-PCR. The values shown are means ± SEM from four samples in each group. *P < 0.05 versus WT by one-way ANOVA. (B) Immunohistologic analysis with NPT2a-specific antibody shows the expression of NPT2a in the brush border membranes of proximal tubules in kidneys from WT, Hyp, FGFR3−/−, and FGFR3−/−/Hyp mutant mice. (Insets) Higher magnification views of a single proximal tubule showing the expression of NPT2a in the brush border membranes (arrows). Hyp proximal tubules displayed a narrow band and diminished intensity of brush border membrane staining for NPT2, consistent with persistent hypophosphatemia. Magnification, ×200.
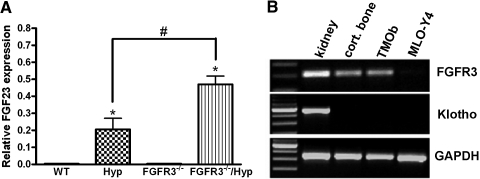
Unexpected, we observed an approximately two-fold increase in both circulating FGF23 level and FGF23 message level in bone of combined FGFR3−/−/Hyp mice above the already elevated levels in Hyp mice (Table 1, Figure 4A). The FGFR3-dependent regulation of FGF23 levels was observed only in the Hyp mouse background, and loss of FGFR3 had no effect on FGF23 levels in mice lacking the Phex mutation. FGF23 is predominately expressed in osteocytes in cortical bone in Hyp mice.27 To explore the possibility that FGF23 may negatively regulate its own expression in bone through FGFR3, we examined whether the FGFR co-factor Klotho is coexpressed with FGFR3 in bone and osteoblast/osteocyte cultures. We found that whereas FGFR3 was expressed in long bone, cultured osteoblasts, and, to a lesser extent, MLO-Y4 osteocytes, Klotho was not found to be expressed in bone, osteoblasts, or osteocytes (Figure 4B).
Figure 4.
Effect of FGF23 expression in bone by superimposed FGFR3 deficiency on Hyp mice and the expression of FGFR3 and Klotho in bone. (A) Quantitative real-time RT-PCR analysis demonstrates the relative expression of FGF23 in long bones of WT and mutant mice. Data are means ± SEM from at least three samples in each group. *P < 0.05 versus WT by one-way ANOVA; #P < 0.05 versus Hyp mice. (B) RT-PCR products revealed by ethidium bromide demonstrate the expression of FGFR3, Klotho, and glyceraldehyde-3-phosphate dehydrogenase (GAPDH) in kidney and cortical bone from WT mice at 6 wk of age, TMOb osteoblasts, and MLO-Y4 osteocytes.
FGFR3 Effects on Bone Abnormalities in Hyp Mice
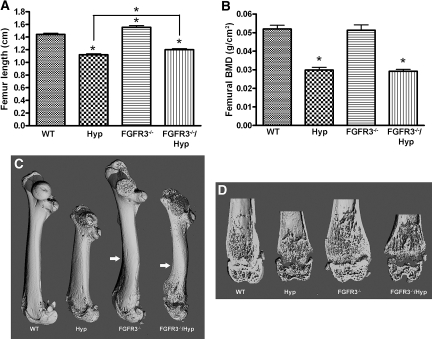
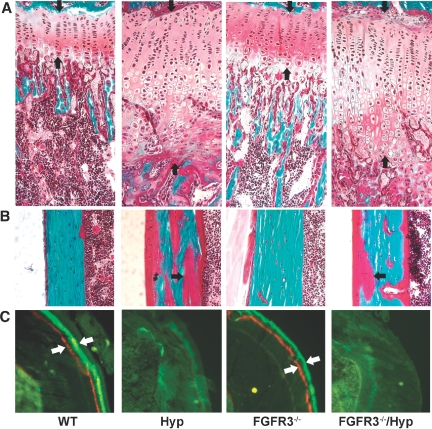
Hyp mice exhibited radiographic and histologic evidence of rickets and osteomalacia. Radiographic analysis revealed reduced bone length and bone density, widening of the growth plate, and decreased mineralized trabecular bone in Hyp mice (Figure 5, Table 2). Bone histologic analysis showed widened growth plate, excessive osteoid surfaces, and impaired mineralization as evidenced by diminished and indistinct fluorescence labeling of bone in Hyp mice (Figure 6). Consistent with previous reports,26,29 we found that FGFR3−/− mice exhibited bone dysplasia characterized by increased bone length, curvature of the femur, and crooked tails (Figures 2 and 5, A and C). Although the bone mineral density was similar between FGFR3−/− and WT mice (Figure 5B), microcomputed tomography (μCT) analysis revealed widening of the metaphyseal/epiphyseal region without changes in trabecular bone volume (Figure 5D, Table 2). Histologically, FGFR3−/− mice showed increased thickness of the hypertrophic zone, but the amount of osteoid and bone formation as assessed by fluorescence labeling was similar in FGFR3−/− and WT mice (Figure 6). Combined FGFR3−/− and Hyp mice had features of both mutations. In combined FGFR3−/− and Hyp mice, the overgrowth and bending of long bone observed in FGFR3−/− mice were superimposed on the rickets and osteomalacia of Hyp mice, and the bone mineralization defect in Hyp mice was sustained in the combined FGFR3−/−/Hyp mice (Figures 5 and 6, Table 2).
Figure 5.
Length and radiologic analysis of femurs from WT, Hyp, FGFR3−/−, and FGFR3−/−/Hyp mutant mice at 6 wk of age. (A) Femur length of WT and mutant mice. (B) Bone mineral density (BMD) of femurs in WT and mutant mice. (C) Three-dimensional μCT images of femurs from WT and mutant mice. Arrows indicate the curve site of femurs. (D) Three-dimensional μCT images of a longitudinal section of the distal femurs from WT and mutant mice. Data are means ± SEM from at least six samples in each group. *P < 0.05 versus WT or indicated group by one-way ANOVA.
Table 2.
μ CT analysis of femurs in WT and mutant micea
| Parameter | WT | Hyp | FGFR3−/− | FGFR3−/−/Hyp |
|---|---|---|---|---|
| BV/TV (%) | 26.1 ± 2.3 | 8.6 ± 3.9b | 28.0 ± 1.7 | 11.1 ± 1.5b |
| Tb.N (/mm) | 7.01 ± 0.26 | 3.89 ± 0.31b | 7.37 ± 0.31 | 4.38 ± 0.34b |
| Tb.Th (mm) | 0.054 ± 0.004 | 0.050 ± 0.003 | 0.054 ± 0.002 | 0.048 ± 0.001 |
| Tb.Sp (mm) | 0.135 ± 0.006 | 0.268 ± 0.016b | 0.129 ± 0.006 | 0.244 ± 0.022b |
| Tb density/TV (mg HA/ccm) | 261.2 ± 18.3 | 98.0 ± 15.2b | 273.6 ± 12.0 | 116.5 ± 12.5b |
| Tb density/BV (mg HA/ccm) | 852.9 ± 13.6 | 746.5 ± 8.9b | 824.1 ± 18.6 | 693.6 ± 3.6b,c |
| Ct.Th (mm) | 0.153 ± 0.004 | 0.107 ± 0.003b | 0.155 ± 0.002 | 0.099 ± 0.005b |
| Ct density/TV (mg HA/ccm) | 1126 ± 14 | 824 ± 14b | 1101 ± 13 | 800 ± 34b |
| Ct density/BV (mg HA/ccm) | 1306 ± 13 | 990 ± 12b | 1258 ± 13 | 989 ± 29b |
Data are means ± SEM from at least eight mice at 6 wk of age. One-way ANOVA was used for statistic analysis. BV, bone volume; Ct.Th, cortical thickness; HA/ccm, hydroxyapitite/cubic centimeter; Tb.N, trabecular number; Tb.Sp, trabecular separation; Tb.Th, trabecular thickness; TV, total volume.
Significantly different compared with WT (P < 0.05).
Significantly different compared with Hyp mice (P < 0.05).
Figure 6.
Effects of superimposed FGFR3 deficiency on cartilage and bone histology. (A) Growth plate of proximal tibia of a 6-wk-old mouse (Goldner's stain). Hyp mice have a thicker growth plate as a result of increased proliferating and hypertrophic zones. FGFR3−/− mice also show an increased hypertrophic zone in the growth plate compared with WT mice but to a lesser degree than Hyp mice. The growth plate in combined homozygous FGFR3−/−/Hyp mice resembles Hyp. (B) Cortical bone of tibia of a 6-wk-old mouse (Goldner's stain). Hyp mice demonstrate impaired mineralization as evidenced by the excess osteoid in bone (red stain indicated by arrow). FGFR3−/− mice do not have notable unmineralized osteoid in cortical bone. Combined FGFR3−/−/Hyp mice retain the characteristic of mineralization defect of Hyp bone. (C) Unstained cross-section of tibias of 6-wk-old mice viewed under fluorescence light. Both WT and FGFR3−/− bones show distinct alizarin red and calcein green double labels (white arrows). Hyp bone shows diffuse and indistinct fluorescence labeling. Combined FGFR3−/−/Hyp bone is not different from Hyp bone. Magnification, ×200.
Effects of FGFR3 Deletion on Hypophosphatemia, Aberrant 1,25(OH)2D Levels, and Bone Abnormalities in Hyp Mice
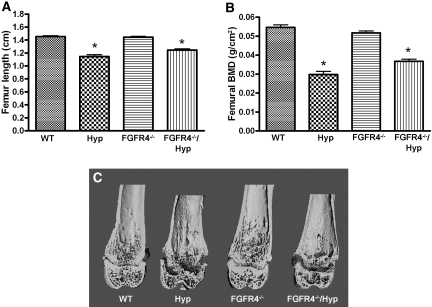
Because FGF23 can also bind to and activate FGFR4:Klotho complex16,18 and FGFR4 and Klotho are coexpressed in the distal tubule30,31 (Figure 1), we next examined the possible role of FGFR4 in mediating the renal effects of FGF23. This was accomplished by the transfer of FGFR4 deficiency onto the Hyp mouse background. Similar to our results from FGFR3 ablation study, we found that the loss of FGFR4 had no effect on serum phosphorus or 1,25(OH)2D levels and did not rescue the hypophosphatemia or aberrant 1,25(OH)2D levels in Hyp mice (Table 3). Similar to FGFR3 ablation, however, loss of FGFR4 in Hyp mice resulted in further increases in serum FGF23 levels. FGFR4-null mice displayed no bone abnormalities by dual x-ray absorptiometry or μCT analysis (Figure 7). In addition, ablation of FGFR4 in Hyp mice (i.e., combined FGFR4−/− and Hyp mice) failed to correct the impaired bone mineralization defect and rickets characteristic of Hyp mice (Figure 7).
Table 3.
Serum biochemistry of WT, Hyp, FGFR4−/−, and FGFR4−/−/Hypa
| Serum Markers | WT | Hyp | FGFR4−/− | FGFR4−/−/Hyp |
|---|---|---|---|---|
| Phosphorus (mg/dl) | 8.9 ± 0.2 | 5.3 ± 0.2b | 8.9 ± 0.2 | 5.9 ± 0.2b |
| Calcium (mg/dl) | 8.7 ± 0.2 | 8.8 ± 0.2 | 8.8 ± 0.2 | 8.5 ± 0.2 |
| 1,25(OH)2D (pM) | 173 ± 9 | 179 ± 19 | 154 ± 16 | 161 ± 19 |
| PTH (pg/ml) | 40 ± 11 | 63 ± 28 | 70 ± 12 | 90 ± 19 |
| FGF23 (pg/ml) | 105 ± 7 | 1258 ± 98b | 154 ± 12 | 2904 ± 229b,c |
Data are means ± SEM from at least 10 mice at 6 wk of age. One-way ANOVA was used for statistic analysis.
Significantly different compared with WT (P < 0.05).
Significantly different compared with Hyp mice (P < 0.05).
Figure 7.
Length and radiologic analysis of femurs from WT, Hyp, FGFR4−/−, and FGFR4−/−/Hyp mutant mice at 6 wk of age. (A) Femur length of WT and mutant mice. (B) BMD of femurs in WT and mutant mice. (C) Three-dimensional μCT images of a longitudinal section of the distal femurs from WT and mutant mice. Data are means ± SEM from at least 6 samples in each group. *P < 0.05 versus WT mice by one-way ANOVA.
Klotho and FGFR1 Are Co-localized in Distal Tubules
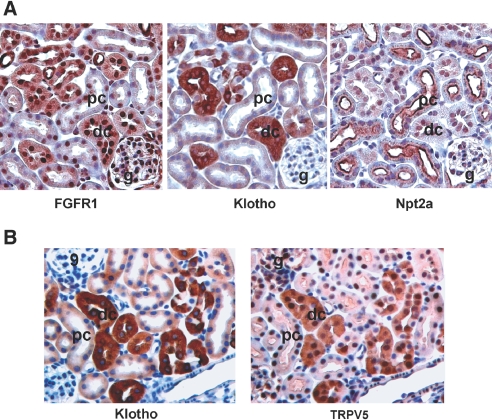
Because the ablation of neither FGFR3 nor FGFR4 in Hyp mice inhibits the renal effects of excess FGF23, we explored the location in the kidney of FGFR1, the remaining FGFR family member capable of forming a complex with Klotho and FGF23. To accomplish this, we performed immunohistologic analysis of serial kidney sections with specific antibodies to FGFR1, the proximal tubular marker NPT2a, and the distal tubular markers Klotho and transient receptor potential cation channel 5 (TRPV5)32,33 (Figure 8). We found that FGFR1 was co-localized in the distal tubule (Figure 8A) with Klotho and TRPV5, which where present only in the distal convoluted tubules (Figure 8). We were unable to detect either FGFR1 or Klotho in the proximal tubule cells, identified by their expression of NPT2a (Figure 8A).
Figure 8.
Expression and co-localization of FGFR1 and Klotho in the distal tubule. (A) Immunohistologic analysis of FGFR1, Klotho, and NPT2a expression in serial sections of the kidney. FGFR1 co-localizes the Klotho in the distal tubule but not NPT2a, which is expressed in the proximal tubule. (B) Immunohistologic analysis of Klotho and TRPV5 in serial sections of the kidney. Klotho co-localizes with the distal tubular marker TRPV5. Corresponding tubule segments in the serial sections are marked.
DISCUSSION
In these studies, we transferred the Hyp mouse, a model of increased FGF23 production, onto the FGFR3-null background to evaluate the role of FGFR3 in mediating the effects of elevated FGF23 in vivo. Previous studies showed that FGF23 binds to and activates FGFR1c, FGFR3c, and FGFR4, but not FGFR2.15,16 We found that ablation of FGFR3 did not alter serum phosphorus or 1,25(OH)2D levels or the expression of NPT2a in the proximal tubules in WT mice, indicating that the receptor had no demonstrable function on systemic phosphate homeostasis or vitamin D metabolism. More important, the absence of FGFR3 in Hyp mice failed to rescue the hypophosphatemia, aberrant 1,25(OH)2D production, or decreased proximal tubular expression of NPT2a caused by increased circulating levels of FGF23 (Table 1, Figure 2).
Of the remaining FGF receptors, neither FGFR4 nor FGFR2 seem to account for the effects of FGF23 on the proximal tubule. In this regard, ablation of FGFR4, located in the distal tubule, failed to rescue the hypophosphatemia in Hyp mice (Table 3). FGFR2 is not a likely candidate for mediating FGF23 effects in the kidney, because it does not bind to FGF23,16 and its expression is restricted to the macula densa. Of the remaining FGFR that are known to bind to FGF23 in the presence of Klotho, FGFR1 is the only remaining candidate. We found that FGFR1 and its co-factor, Klotho, however, are co-localized to the distal tubule of the mouse kidney (Figure 1),30,31 raising the question of which tubular segment is the biologically relevant target of FGF23. Use of mouse genetic approaches to evaluate the role of FGFR1 is more difficult, because deletion of FGFR1 results in embryonic lethality.34,35 Thus, assessing the role of FGFR1 in mediating FGF23 effects will require conditional deletion of FGFR1 from the kidney.
Although we did not rescue the hypophosphatemia by deletion of FGFR 3 and/or 4, it remains possible that these receptors still could participate, along with FGFR1, as redundant targets for FGF23 in the kidney. In support of this possibility, the observed increase in FGF23 levels in Hyp mice lacking FGFR3 and FGFR4 (Tables 1 and 3) might represent a compensatory increase in FGF23 production by bone as a result of end-organ resistance from the loss of FGFR3 and FGFR4. Alternatively, the increment in FGF23 might represent a loss of feedback suppression by FGF23 as a result of loss of FGFR3 or FGFR4. Although, we failed to identify Klotho expression in bone, recent studies identified FGF23 effects on bone that are independent of its effects on systemic phosphate homeostasis.36 Conversely, in combined FGFR3−/− and Hyp mice, the overgrowth and curvature of long bone observed in FGFR3 knockout mice were superimposed on the rickets and osteomalacia of Hyp mice (Figures 5 and 6), consistent with separate roles of FGFR3 and Phex mutations in bone. Further studies will be needed to investigate fully the mechanisms underlying the increased expression of FGF23 in bone of combined Hyp and FGFR3 and FGFR4-null mice.
Another interesting question raised by our studies is whether the proximal or distal tubule is the primary target for FGF23. Although we cannot exclude the possibility of low-level expression of Klotho in the proximal tubule, this essential co-factor for FGF23 activation of FGFR is predominately present in the distal tubule, where it co-localizes with FGFR1, FGFR3, and FGFR4 (Figure 1). As an explanation for the mismatch between distal Klotho expression and proximal tubule function of FGF23, it has been proposed that a secreted form of Klotho may function in a paracrine/endocrine manner to mediate the actions of FGF23 on phosphate transport and 1,25(OH)2D production in this segment of the nephron.37 Alternatively, FGFR1:Klotho complex present in the distal tubule might stimulate a distinct paracrine factor that communicates with the proximal tubule to regulate phosphate transport and 1,25(OH)2D production. Evidence for this novel distal-to-proximal feedback mechanism includes the anatomic proximity of the distal and proximal tubule in the cortex and the observation that indomethacin, which mainly inhibits prostaglandin synthesis in tubular segments other than the proximal tubule,38 can correct hypophosphatemia in Hyp mice.39 Whether FGFR:Klotho complex can regulate the distal tubular production of prostaglandins or other paracrine factors remains to be determined. Regardless, additional studies are needed to define the biologically relevant molecular targets for FGF23 in the kidney and how FGF23 regulates proximal tubular epithelial cell functions.
Finally, in contrast to the kidney, whether FGF23 has direct effect on bone is not clear. Recent in vitro studies of culture osteoblasts demonstrated an effect exogenously of FGF23 to regulate osteoblast differentiation.36 In contrast, we failed to identify Klotho expression in bone. Moreover, we did not identify any attenuation of the Hyp bone phenotype associated with excessive FGF23 levels in the combined Hyp-FGFR3 and Hyp-FGFR4–null mice.
In conclusion, neither FGFR3 nor FGFR4 by itself accounts for FGF23 actions on the kidney. Further studies that selectively delete FGFR1, as well as creation of compound deletions of all three FGFR, from the kidney may be needed to define the physiologically relevant FGF23 receptors. Additional studies are needed to resolve the paradoxic finding of expression of FGFR:Klotho complex in the distal tubule and the proximal actions of FGF23. Knowledge of the receptor and tubular segment that is the target for FGF23 is important in understanding the actions of FGF23 on the kidney and in developing therapeutic approaches to treat diseases caused by excess FGF23.
CONCISE METHODS
Transferring FGFR3 and FGFR4 Deficiency onto Phex-Deficient Hyp Background and Mouse Genotyping
FGFR3 and FGFR4 knockout mice were generated as previously reported and provided by Dr. Weinstein (Ohio State University, Columbus, OH).40 FGFR3 and FGFR4 knockout mice are in a mixed genetic background consisting of 129 Sv and C57BL/B6, whereas Hyp mice are in C57BL/6 genetic background. We crossed male FGFR3-null mice with female Hyp mice to obtain male mice heterozygous for FGFR3 (FGFR3+/−/XY) and female Hyp mice heterozygous for FGFR3 (FGFR3+/−/XHypX). We then bred the heterozygous FGFR3 males to heterozygous FGFR3/Hyp females. The mice were genotyped by PCR (see below). Because we cannot distinguish WT and Hyp female mice by PCR, we collected data only from male WT, Hyp, FGFR3−/− and combined FGFR3−/−/Hyp littermates in our study. We used a similar strategy to cross male FGFR4-null mice to female Hyp mice. All mice were maintained and used in accordance with the recommendations in the “Guide for Care and Use of Laboratory Animals,” prepared by the Institute on Laboratory Animal Resources, National Research Council (Department of Health and Human Services Publication NIH 86-23, National Academies Press, 1996) and the guidelines established by the University of Kansas Medical Center Institutional Animal Care and Use Committee. Mice were maintained under standard diet purchased from Harlan Talked (Madison, WI), which contains 0.6% Ca, 0.54% phosphate, and 2200 IU of vitamin D. Genomic DNA was extracted from tail tissue of each mouse using Sigma REDExtract-N-Amp Tissue PCR Kit (Sigma-Aldrich, St. Louis, MO). FGFR3- and FGFR4-null mice and Hyp mice were genotyped using PCR methods as described previously.27,40
Serum Biochemistries
Serum calcium was measured using a Calcium CPC Liquicolor Kit (Stanbio Laboratories, Boerne, TX), and serum phosphorus was measured using the phosphomolybdylate-ascorbic acid method, as described previously.27 Serum parathyroid hormone levels were measured using a Mouse Intact PTH ELISA kit (Immutopics, Carlsbad, CA). Serum 1,25(OH)2D levels were measured using a 1,25 Dihydroxy Vitamin D EIA Kit (Immunodiagnostic Systems, Fountain Hills, AZ). Serum FGF23 levels were measured using an FGF23 ELISA kit (Kainos Laboratories, Tokyo, Japan).
High-Resolution Radiography of Femurs, Bone Densitometry, and Three-Dimensional Analysis of the Femurs by μCT
The femurs from 6-wk-old mice were collected and fixed in 70% ethanol. Bone mineral densities of femurs were measured using a PIXIMUS bone densitometer (Lunar Corp., Madison, WI). High-resolution μCT40 (Scanco Medical, Basserdorf, Switzerland) was used to scan and evaluate bone volume fraction and microarchitecture of the metaphyseal region of the distal femurs.23 In addition, cortical thickness data were obtained at the midshaft. The μCT40 unit was calibrated weekly with a phantom standard provided by Scanco. The entire femurs were scanned in a sample holder with 12.3-mm diameter at medium resolution, energy level of 55 kV, and intensity of 145 μA. The three-dimensional structure was constructed and three-dimensional morphometric analysis conducted with the built-in software of the μCT system. Trabecular bones from 50 cross-section slices (0.6 mm) underneath the growth plate and cortical bones from 20 cross-section slices at the midpoint of the femurs were analyzed using a threshold of 250.
Cell Culture
TMOb-Nl immortalized cells derived from normal murine calvaria were grown in α-minimum essential medium (Invitrogen, Carlsbad, CA) containing 10% FBS.41 The MLO-Y4, an osteocyte cell line, was provided by Dr. Lynda F. Bonewald (University of Missouri at Kansas City, Kansas City, MO). MLO-Y4 cells were maintained in α-minimum essential medium containing 5% FBS and 5% calf serum in plates coated with rat tail type I collagen as previously reported.42
RNA Isolation, RT-PCR, and Quantitative RT-PCR
Total RNA were extracted from homogenized kidney, bone, and cell lines using TRI Reagent (Molecular Research Center, Cincinnati, OH) and then treated with RNase-free DNase (Qiagen, Valencia, CA). First-strand cDNA was synthesized using iScript cDNA Synthesis Kit (Bio-Rad, Hercules, CA). Total RNA (1 μg) was used in each 20-μl reverse transcriptase reaction. For RT-PCR, 1 μg of RNA was used in each PCR reaction. The RT-PCR products were separated and visualized in 2% agarose gel containing ethidium bromide. For real-time RT-PCR, 200 ng of total RNA was used in each PCR reaction. The iCycler iQ Real-Time PCR Detection System and iQ SYBR Green Supermix (Bio-Rad) were used for real-time quantitative PCR analysis. The relative gene expression was expressed as described previously using cycle threshold (Ct) values of the gene of interest normalized with cyclophilin A in the same sample.27 Sequences of primers used for regular and real-time quantitative RT-PCR are listed in Table 4.
Table 4.
Primers used for RT- PCR
| Gene | Forward Primer | Reverse Primer |
|---|---|---|
| FGFR1 | AACCTCTAACCGCAGAAC | GAGACTCCACTTCCACAG |
| FGFR2 | ATCATCGCCTGCTCCATC | GCTGTTGTTACTGCTGTTCC |
| FGFR3 | CTTCAGTGTGCGTGTAAC | TTCTTTGCCATTCTTCAGC |
| FGFR4 | ATGACCGTCGTACACAATCTTAC | TGTCCAGTAGGGTGCTTGC |
| Klotho | AGCGATAGTTACAACAAC | GCATTCTCTGATATTATAGTC |
| NPT2 | ATGCTGGCTTTCCTTTAC | CCACAATGTTCATGCCTTCT |
| Cyp27b1 | ACACTTCGCACAGTTTACG | TTAGCAATCCGCAAGCAC |
| Cyclophilin A | CTGCACTGCAAGACTGAAT | TCCACCACCCTGTTGCTGTA |
Immunohistochemistry and Immunohistofluorescence
Kidneys collected from WT and mutant mice were fixed in 4% paraformaldehyde in PBS (pH 7.4) and then embedded either in paraffin or in frozen embedding medium (Thermo Shandon, Waltham, MA). Five-micrometer paraffin sections were used for immunohistochemistry. Briefly, sections were dewaxed, rehydrated, and incubated with Target Retrieval Solution (Dako Corp., Carpinteria, CA) at 95°C for 30 min. The sections were then treated with 3% H2O2 in methanol and blocked with the Avidin and Biotin Block Solution (Vector Laboratories, Burlingame, CA) and with diluted blocking serum from the species in which the secondary antibody was made. Then, primary antibodies were incubated on the section at 4°C overnight and detected by diluted biotinylated secondary antibodies followed by incubation with the Vector ABC Reagent (Vector Laboratories). Finally, the slides were developed with diaminobenzidine substrate (Vector Laboratories) and counterstained with Mayer's hematoxylin. For immunofluorescence, 5-μm cryosections were used. Briefly, sections were rinsed with TBS and blocked with TBS containing 10% normal serum from same species and 1% BSA for 1 h at room temperature. Then sections were incubated with primary antibodies overnight at 4°C and detected by diluted Alexa Fluor dye-labeled secondary antibodies. Finally, the sections were washed with TBS and mounted with mounting solution. Rabbit-raised anti-human FGFR1 through 4 antibodies and TRPV5 antibody were purchased from Santa Cruz Biotechnology (Santa Cruz, CA). The negative control sections in this study were incubated with nonimmunized serum or 5 μg/ml blocking peptides (Santa Cruz Biotechnology). Rabbit-raised anti-NPT2a antibody was a gift from Dr. Moshe Levi (University of Colorado Health Sciences Center, Denver, CO). The monoclonal rat anti-Klotho antibody (KM2076) was provided by Kyowa Hakko Kogyo Co. Ltd.30 The Alexa Fluor 488–labeled secondary antibody (Invitrogen) was used in the immunohistofluorescence staining.
Histologic Analysis of Nondecalcified Bone
Mice were prelabeled at 6 and 1 d before they were killed for tissue collection with alizarin complexone (Acros Organics, Fair Lawn, NJ) and calcein (Sigma-Aldrich), respectively, by intraperitoneal injection. Bones were fixed in 70% ethanol and embedded in methyl methacrylate. Five-micrometer sections were stained with Goldner's stain and analyzed under transmitted light, and 10-μm unstained sections were evaluated under fluorescence light.27
Statistical Analysis
We evaluated differences between groups by one-way ANOVA for multiple-group comparison and t test for two-group comparison. All values are expressed as means ± SEM. P < 0.05 was considered statistically significant. All computations were performed using the GraphPad Prism 4 software (GraphPad Software, San Diego, CA).
DISCLOSURES
None.
Acknowledgments
This project was supported by National Institutes of Health grant RO1-AR45955 from the National Institute of Arthritis and Musculoskeletal and Skin Diseases.
We thank Dr. Michael Weinstein (Ohio State University), Dr. Moshe Levi (University of Colorado Health Sciences Center), Dr. Lynda F. Bonewald (University of Missouri at Kansas City), and Kyowa Hakko Kogyo Co. Ltd. for kindly providing the FGFR3 knockout mice, NPT2a polyclonal antibody, MLO-Y4 cell line, and Klotho antibody, respectively.
Published online ahead of print. Publication date available at www.jasn.org.
REFERENCES
- 1.Liu S, Quarles LD: How fibroblast growth factor 23 works. J Am Soc Nephrol 18: 1637–1647, 2007 [DOI] [PubMed] [Google Scholar]
- 2.Bai X, Miao D, Li J, Goltzman D, Karaplis AC: Transgenic mice overexpressing human fibroblast growth factor 23 (R176Q) delineate a putative role for parathyroid hormone in renal phosphate wasting disorders. Endocrinology 145: 5269–5279, 2004 [DOI] [PubMed] [Google Scholar]
- 3.Larsson T, Marsell R, Schipani E, Ohlsson C, Ljunggren O, Tenenhouse HS, Juppner H, Jonsson KB: Transgenic mice expressing fibroblast growth factor 23 under the control of the alpha1(I) collagen promoter exhibit growth retardation, osteomalacia, and disturbed phosphate homeostasis. Endocrinology 145: 3087–3094, 2004 [DOI] [PubMed] [Google Scholar]
- 4.Shimada T, Urakawa I, Yamazaki Y, Hasegawa H, Hino R, Yoneya T, Takeuchi Y, Fujita T, Fukumoto S, Yamashita T: FGF-23 transgenic mice demonstrate hypophosphatemic rickets with reduced expression of sodium phosphate cotransporter type IIa. Biochem Biophys Res Commun 314: 409–414, 2004 [DOI] [PubMed] [Google Scholar]
- 5.The ADHR Consortium: Autosomal dominant hypophosphataemic rickets is associated with mutations in FGF23. Nat Genet 26: 345–348, 2000 [DOI] [PubMed] [Google Scholar]
- 6.White KE, Carn G, Lorenz-Depiereux B, Benet-Pages A, Strom TM, Econs MJ: Autosomal-dominant hypophosphatemic rickets (ADHR) mutations stabilize FGF-23. Kidney Int 60: 2079–2086, 2001 [DOI] [PubMed] [Google Scholar]
- 7.Weber TJ, Liu S, Indridason OS, Quarles LD: Serum FGF23 levels in normal and disordered phosphorus homeostasis. J Bone Miner Res 18: 1227–1234, 2003 [DOI] [PubMed] [Google Scholar]
- 8.Yamazaki Y, Okazaki R, Shibata M, Hasegawa Y, Satoh K, Tajima T, Takeuchi Y, Fujita T, Nakahara K, Yamashita T, Fukumoto S: Increased circulatory level of biologically active full-length FGF-23 in patients with hypophosphatemic rickets/osteomalacia. J Clin Endocrinol Metab 87: 4957–4960, 2002 [DOI] [PubMed] [Google Scholar]
- 9.Feng JQ, Ward LM, Liu S, Lu Y, Xie Y, Yuan B, Yu X, Rauch F, Davis SI, Zhang S, Rios H, Drezner MK, Quarles LD, Bonewald LF, White KE: Loss of DMP1 causes rickets and osteomalacia and identifies a role for osteocytes in mineral metabolism. Nat Genet 38: 1310–1315, 2006 [DOI] [PMC free article] [PubMed] [Google Scholar]
- 10.Lorenz-Depiereux B, Bastepe M, Benet-Pages A, Amyere M, Wagenstaller J, Muller-Barth U, Badenhoop K, Kaiser SM, Rittmaster RS, Shlossberg AH, Olivares JL, Loris C, Ramos FJ, Glorieux F, Vikkula M, Juppner H, Strom TM: DMP1 mutations in autosomal recessive hypophosphatemia implicate a bone matrix protein in the regulation of phosphate homeostasis. Nat Genet 38: 1248–1250, 2006 [DOI] [PMC free article] [PubMed] [Google Scholar]
- 11.Shimada T, Mizutani S, Muto T, Yoneya T, Hino R, Takeda S, Takeuchi Y, Fujita T, Fukumoto S, Yamashita T: Cloning and characterization of FGF23 as a causative factor of tumor-induced osteomalacia. Proc Natl Acad Sci U S A 98: 6500–6505, 2001 [DOI] [PMC free article] [PubMed] [Google Scholar]
- 12.Riminucci M, Collins MT, Fedarko NS, Cherman N, Corsi A, White KE, Waguespack S, Gupta A, Hannon T, Econs MJ, Bianco P, Gehron Robey P: FGF-23 in fibrous dysplasia of bone and its relationship to renal phosphate wasting. J Clin Invest 112: 683–692, 2003 [DOI] [PMC free article] [PubMed] [Google Scholar]
- 13.Bai XY, Miao D, Goltzman D, Karaplis AC: The autosomal dominant hypophosphatemic rickets R176Q mutation in fibroblast growth factor 23 resists proteolytic cleavage and enhances in vivo biological potency. J Biol Chem 278: 9843–9849, 2003 [DOI] [PubMed] [Google Scholar]
- 14.Perwad F, Zhang MY, Tenenhouse HS, Portale AA: Fibroblast growth factor 23 impairs phosphorus and vitamin D metabolism in vivo and suppresses 25-hydroxyvitamin D-1alpha-hydroxylase expression in vitro. Am J Physiol Renal Physiol 293: F1577–F1583, 2007 [DOI] [PubMed] [Google Scholar]
- 15.Urakawa I, Yamazaki Y, Shimada T, Iijima K, Hasegawa H, Okawa K, Fujita T, Fukumoto S, Yamashita T: Klotho converts canonical FGF receptor into a specific receptor for FGF23. Nature 444: 770–774, 2006 [DOI] [PubMed] [Google Scholar]
- 16.Kurosu H, Ogawa Y, Miyoshi M, Yamamoto M, Nandi A, Rosenblatt KP, Baum MG, Schiavi S, Hu MC, Moe OW, Kuro-o M: Regulation of fibroblast growth factor-23 signaling by klotho. J Biol Chem 281: 6120–6123, 2006 [DOI] [PMC free article] [PubMed] [Google Scholar]
- 17.Bowe AE, Finnegan R, Jan de Beur SM, Cho J, Levine MA, Kumar R, Schiavi SC: FGF-23 inhibits renal tubular phosphate transport and is a PHEX substrate. Biochem Biophys Res Commun 284: 977–981, 2001 [DOI] [PubMed] [Google Scholar]
- 18.Yu X, Ibrahimi OA, Goetz R, Zhang F, Davis SI, Garringer HJ, Linhardt RJ, Ornitz DM, Mohammadi M, White KE: Analysis of the biochemical mechanisms for the endocrine actions of fibroblast growth factor-23. Endocrinology 146: 4647–4656, 2005 [DOI] [PMC free article] [PubMed] [Google Scholar]
- 19.Baum M, Schiavi S, Dwarakanath V, Quigley R: Effect of fibroblast growth factor-23 on phosphate transport in proximal tubules. Kidney Int 68: 1148–1153, 2005 [DOI] [PubMed] [Google Scholar]
- 20.Cancilla B, Davies A, Cauchi JA, Risbridger GP, Bertram JF: Fibroblast growth factor receptors and their ligands in the adult rat kidney. Kidney Int 60: 147–155, 2001 [DOI] [PubMed] [Google Scholar]
- 21.Aono Y, Shimada T, Uamazaki Y, Hino R, Takeuchi Y, Fujita T, Fukumoto S, Nagano N, Wada M, Yamashita T: The neutralization of FGF-23 ameliorates hypophosphatemia and rickets in Hyp mice [Abstract]. J Bone Miner Res 18: S16, 2003 [Google Scholar]
- 22.Liu S, Guo R, Simpson LG, Xiao ZS, Burnham CE, Quarles LD: Regulation of fibroblastic growth factor 23 expression but not degradation by PHEX. J Biol Chem 278: 37419–37426, 2003 [DOI] [PubMed] [Google Scholar]
- 23.Liu S, Brown TA, Zhou J, Xiao ZS, Awad H, Guilak F, Quarles LD: Role of matrix extracellular phosphoglycoprotein in the pathogenesis of X-linked hypophosphatemia. J Am Soc Nephrol 16: 1645–1653, 2005 [DOI] [PMC free article] [PubMed] [Google Scholar]
- 24.Johnson DE, Williams LT: Structural and functional diversity in the FGF receptor multigene family. Adv Cancer Res 60: 1–41, 1993 [DOI] [PubMed] [Google Scholar]
- 25.Eswarakumar VP, Lax I, Schlessinger J: Cellular signaling by fibroblast growth factor receptors. Cytokine Growth Factor Rev 16: 139–149, 2005 [DOI] [PubMed] [Google Scholar]
- 26.Deng C, Wynshaw-Boris A, Zhou F, Kuo A, Leder P: Fibroblast growth factor receptor 3 is a negative regulator of bone growth. Cell 84: 911–921, 1996 [DOI] [PubMed] [Google Scholar]
- 27.Liu S, Zhou J, Tang W, Jiang X, Rowe DW, Quarles LD: Pathogenic role of Fgf23 in Hyp mice. Am J Physiol Endocrinol Metab 291: E38–E49, 2006 [DOI] [PubMed] [Google Scholar]
- 28.Yuan B, Xing Y, Horst RL, Drezner MK: Evidence for abnormal translational regulation of renal 25-hydroxyvitamin D-1alpha-hydroxylase activity in the hyp-mouse. Endocrinology 145: 3804–3812, 2004 [DOI] [PubMed] [Google Scholar]
- 29.Colvin JS, Bohne BA, Harding GW, McEwen DG, Ornitz DM: Skeletal overgrowth and deafness in mice lacking fibroblast growth factor receptor 3. Nat Genet 12: 390–397, 1996 [DOI] [PubMed] [Google Scholar]
- 30.Kato Y, Arakawa E, Kinoshita S, Shirai A, Furuya A, Yamano K, Nakamura K, Iida A, Anazawa H, Koh N, Iwano A, Imura A, Fujimori T, Kuro-o M, Hanai N, Takeshige K, Nabeshima Y: Establishment of the anti-Klotho monoclonal antibodies and detection of Klotho protein in kidneys. Biochem Biophys Res Commun 267: 597–602, 2000 [DOI] [PubMed] [Google Scholar]
- 31.Li SA, Watanabe M, Yamada H, Nagai A, Kinuta M, Takei K: Immunohistochemical localization of Klotho protein in brain, kidney, and reproductive organs of mice. Cell Struct Funct 29: 91–99, 2004 [DOI] [PubMed] [Google Scholar]
- 32.Loffing J, Vallon V, Loffing-Cueni D, Aregger F, Richter K, Pietri L, Bloch-Faure M, Hoenderop JG, Shull GE, Meneton P, Kaissling B: Altered renal distal tubule structure and renal Na(+) and Ca(2+) handling in a mouse model for Gitelman's syndrome. J Am Soc Nephrol 15: 2276–2288, 2004 [DOI] [PubMed] [Google Scholar]
- 33.Chang Q, Hoefs S, van der Kemp AW, Topala CN, Bindels RJ, Hoenderop JG: The beta-glucuronidase klotho hydrolyzes and activates the TRPV5 channel. Science 310: 490–493, 2005 [DOI] [PubMed] [Google Scholar]
- 34.Yamaguchi TP, Harpal K, Henkemeyer M, Rossant J: FGFR-1 is required for embryonic growth and mesodermal patterning during mouse gastrulation. Genes Dev 8: 3032–3044, 1994 [DOI] [PubMed] [Google Scholar]
- 35.Deng CX, Wynshaw-Boris A, Shen MM, Daugherty C, Ornitz DM, Leder P: Murine FGFR-1 is required for early postimplantation growth and axial organization. Genes Dev 8: 3045–3057, 1994 [DOI] [PubMed] [Google Scholar]
- 36.Wang H, Yoshiko Y, Yamamoto R, Minamizaki T, Kozai K, Tanne K, Aubin JE, Maeda N: Overexpression of fibroblast growth factor 23 suppresses osteoblast differentiation and matrix mineralization in vitro. J Bone Miner Res 23: 939–948, 2008 [DOI] [PubMed] [Google Scholar]
- 37.Imura A, Iwano A, Tohyama O, Tsuji Y, Nozaki K, Hashimoto N, Fujimori T, Nabeshima Y: Secreted Klotho protein in sera and CSF: Implication for post-translational cleavage in release of Klotho protein from cell membrane. FEBS Lett 565: 143–147, 2004 [DOI] [PubMed] [Google Scholar]
- 38.Takemoto F, Miyanoshita A, Shimamura K, Sunano S, Endou H: Intranephron PGE2 production in stroke-prone spontaneously hypertensive rats. Am J Physiol 258: H987–H993, 1990 [DOI] [PubMed] [Google Scholar]
- 39.Baum M, Syal A, Quigley R, Seikaly M: Role of prostaglandins in the pathogenesis of X-linked hypophosphatemia. Pediatr Nephrol 21: 1067–1074, 2006 [DOI] [PubMed] [Google Scholar]
- 40.Weinstein M, Xu X, Ohyama K, Deng CX: FGFR-3 and FGFR-4 function cooperatively to direct alveogenesis in the murine lung. Development 125: 3615–3623, 1998 [DOI] [PubMed] [Google Scholar]
- 41.Liu S, Guo R, Tu Q, Quarles LD: Overexpression of Phex in osteoblasts fails to rescue the Hyp mouse phenotype. J Biol Chem 277: 3686–3697, 2002 [DOI] [PubMed] [Google Scholar]
- 42.Zhao S, Zhang YK, Harris S, Ahuja SS, Bonewald LF: MLO-Y4 osteocyte-like cells support osteoclast formation and activation. J Bone Miner Res 17: 2068–2079, 2002 [DOI] [PubMed] [Google Scholar]


