

Abstract
Background
Drinking in the dark (DID) procedures have recently been developed to induce high levels of ethanol drinking in C57BL/6J mice, which result in blood ethanol concentrations reaching levels that have measurable affects on physiology and/or behavior. The present study determined if increased ethanol drinking associated with DID procedures may be motivated by caloric need rather than by the post-ingestive pharmacological effects of ethanol. To this end, food availability was manipulated or mice were given peripheral administration of orexigenic or anorectic agents during DID procedures.
Methods
C57BL/6J had 2-hours of access to the 20% (v/v) ethanol solution beginning 3-hours into the dark cycle on days 1-3, and 4-hours of access to the ethanol bottle on day 4 of DID procedures. In Experiment 1, the effects of food deprivation on ethanol consumption during DID procedures was assessed. In Experiments 2 and 3, mice were given intraperitoneal (i.p.) injection of the orexigenic peptide ghrelin (0, 10 or 30 mg/kg) or the anorectic protein leptin (0 or 20 μg/g), respectively, before access to ethanol on day 4 of DID procedures. In Experiment 4, hourly consumption of food and a 0.05% saccharin solution were assessed over a period of hours that included those used with DID procedures.
Results
Consistent with previous research, mice achieved blood ethanol concentrations (BECs) that ranged between 100 to 150 mg% on day 4 of DID experiments. Neither food deprivation nor administration of orexigenic or anorectic compounds significantly altered ethanol drinking with DID procedures. Interestingly, mice exhibited their highest level of food and saccharin solution consumption during hours that overlapped with DID procedures.
Conclusions
The present observations are inconsistent with the hypothesis that C57BL/6J mice consume large amounts of ethanol during DID procedures in order to satisfy a caloric need.
Keywords: C57BL/6J Mice, Drinking in the Dark, Food, Alcohol, Ghrelin, Leptin, Calories
INTRODUCTION
To assist in identifying the genetic and neurobiological factors that underlie alcoholism, scientists often turn to animal models to address question that cannot be ethically studied in human subjects. However, in many cases rodents do not consume enough alcohol to reach the point of behavioral and/or pharmacological intoxication (Spanagel, 2000). Recently, “drinking in the dark” (DID) procedures have been developed to induce excessive binge-like ethanol drinking in C57BL/6J mice, which result in blood ethanol concentrations (BECs) reaching levels that have measurable effects on physiology and/or behavior (Rhodes et al., 2005; Rhodes et al., 2007). DID procedures involve giving C57BL/6J mice access to a 20% ethanol solution for 2 to 4-hours starting 3-hours into their dark cycle. C57BL/6J can achieve BECs of >100 mg% and exhibit signs of behavioral intoxication as measured by motor deficits on the rotarod and balance beam (Rhodes et al., 2005; Rhodes et al., 2007). Pretreatment with naltrexone or the dopamine re-uptake inhibitor GBR 12909 attenuate increased ethanol consumption associated with DID procedures, suggesting a role for opioid and dopamine receptor signaling (Kamdar et al., 2007). More recently, we have found that pretreatment with the CRF1 receptor antagonist CP-154,526 protected against high levels of ethanol drinking associated with specific DID procedures. Importantly, CRF1 receptor blockade did not alter ethanol drinking in C57BL/6J mice consuming moderate amounts of ethanol, suggesting that CRF1 receptor signaling specifically modulates high ethanol intake (Sparta et al., 2008).
As DID procedures involve providing C57BL/6J mice with access to ethanol towards the beginning of the dark cycle, increased ethanol drinking may be related to the high level of nocturnal ingestive behavior that is characteristic of mice (Ho and Chin, 1988; Tabarin et al., 2007). In fact, the highest levels of food intake in mice were found to occur during the first 4 hours of their 12 hour dark cycle (Tabarin et al., 2007), a window of time in which mice are given access to ethanol using DID procedures (Kamdar et al., 2007; Rhodes et al., 2005; Rhodes et al., 2007). Since ethanol contains calories, this raises the possibility that increased ethanol drinking associated with DID procedures results from presenting ethanol during a time of high caloric need, rather than an increased motivation to drink ethanol for its post-ingestive pharmacological effects.
The experiments described below assessed the possibility that increased ethanol drinking with DID procedures stems from caloric need. In Experiment 1, we reasoned that if ethanol were the only source of calories during DID procedures, ethanol intake would be increased relative to mice with free access to food if the caloric need hypothesis is correct. To further test this caloric need hypothesis, in Experiment 2 mice were given intraperitoneal (i.p.) injection of ghrelin immediately before DID procedures. Ghrelin is an orexigenic gut peptide shown to increase food consumption when given peripherally to C57BL/6J mice (Wang et al., 2002). We predicted that if increased ethanol drinking resulting from DID procedures was related to increased caloric need, an orexigenic peptide such as ghrelin should further augment ethanol intake. In Experiment 3, we determined if the protein leptin would influence ethanol intake when given before DID procedures. Leptin is synthesized in adipose tissue and reduces food intake when administered peripherally (Halaas et al., 1995; Prpic et al., 2003). If increased ethanol intake with DID procedures stems from caloric need, we predicted that the anorectic protein leptin should decrease ethanol intake. In Experiment 4, we examined the normal consummatory behaviors of C57BL/6J mice with a caloric substance (standard rodent chow) and a non-caloric substance (0.05% saccharin solution) over a twelve-hour period, which included the timeframe that mice were given ethanol during DID procedures. Data from the experiments described below are inconsistent with the hypothesis that increased ethanol drinking stemming from DID procedures results from increased caloric need.
METHODS
Animals
Male C57BL/6J mice (Jackson Laboratory, Bar Harbor ME) were used in all experiments. Mice were 6-8 weeks old when they arrived from the vendor and weighed between 25-30 g at the onset of the experiments. Mice were single housed in polypropylene cages with corncob bedding. Standard rodent chow (Teklad, Madison, WI) and water were available at all times except where noted. The vivarium rooms were maintained at an ambient temperature of 22° C with a reverse 12-hour/12-hour light-dark cycle. Lights came on at 9:00 P.M. and went off at 9:00 A.M. Mice were acclimated to the environment for at least 10 days before the start of experiments. All experimental procedures were approved by the University of North Carolina Animal Care and Use Committee (IACUC) and were in compliance with the NIH Guide for Care and Use of Laboratory Animals.
Experiment 1: Effects of Food Availability on Ethanol Intake Associated with DID Procedures
Before the start of the experiment, mice were divided into groups (n = 10/group) based on bodyweight so that the average weight between groups was similar. All mice underwent a modified DID protocol (Rhodes et al., 2005; Sparta et al., 2008). Briefly, all homecage water bottles were replaced with a single bottle of 20% (v/v) ethanol, 3-hours into the start of the dark phase. The 20% ethanol solution remained on the homecage for 2-hours during the training sessions (days 1-3) and for 4-hours on the test day (day 4). For each of the 4-days during DID procedures, one group of mice had ad libitum access to food (no food deprivation), the second group of mice had food removed from their cages 3-hours before the beginning of the dark cycle, the third group of mice had food removed from their cages at the beginning of the dark cycle, and the fourth group of mice had food removed from their cages beginning 3-hours into the dark cycle. For all food deprived groups, food was returned 7-hours into the dark cycle. With this arrangement, mice were food deprived for 0, 6-8, 3-5, or 0-2 hours during DID procedures on days 1-3 and 0, 6-10, 3-7, or 0-4 hours during DID procedures on day 4. Immediately following the 4-hours of ethanol access on day 4, tail blood samples (6 μl) were collected from all mice to determine BECs with an alcohol analyzer (Analox Instruments, Lunenburg, MA). On each day of study, ethanol consumption and body weight measures were recorded and the amount of ethanol consumed was calculated as g of ethanol consumed per kg of body weight (g/kg).
Experiment 2: Effects of Ghrelin Injection on Ethanol Intake Associated with DID Procedures and Basal Food Consumption
The DID procedures were similar to those described above. Because ghrelin is a potent orexigenic agent that stimulates food intake when given peripherally (Chen et al., 2004; Wang et al., 2002), food was removed from all mice cages immediately before ethanol access on each of the 4-days of DID procedures. This was done to avoid the potential confound of altered ethanol drinking secondary to increased food intake. To habituate mice to i.p. injections, all mice received an i.p. injection of 0.9% saline (5 ml/kg) for two days prior to the start of the experiment and immediately before ethanol access on days 1-3. Mice were then distributed into 3-groups (n = 10/group) matched for average ethanol consumption that occurred over the first 3-days of the experiment (that is, the mice were distributed so that the baseline level of ethanol consumption was approximately equal between the groups). On the fourth day, mice were given an i.p. injection of one of three doses (0, 10, or 30 g/kg) of mouse ghrelin (Phoenix Pharmaceuticals, Inc., Burlingame, CA) mixed in 0.9% saline immediately before application of the ethanol bottle. The 30 g/kg dose of ghrelin has been shown to significantly increase 4-hour food intake by mice (Chen et al., 2004). Tail blood (6 μl) was collected from all mice immediately following the 4-hour test session to determine BECs. Ethanol consumption and body weight measures were recorded and the amount of ethanol consumed was calculated as g of ethanol consumed per kg of body weight (g/kg).
To confirm that ghrelin was physiologically active, a naïve group of C57BL/6J mice were used to assess the effects of ghrelin on food intake. Mice were distributed into 2-groups (n = 10/group) based on body weights. The mice received 2-days of habituation injections of 0.9% saline. On the test day, the food in each mouse cage was weighed at 3-hours into the dark cycle. At that time, mice were given an i.p. injection of saline or ghrelin (30 mg/kg). Food was weighed 4-h later and food consumption was calculated as g consumed over the 4-hour test.
Experiment 3: Effects of Leptin Injection on Ethanol Intake Associated with DID Procedures and Basal Food Consumption
The procedures were similar to those in Experiment 2. Because leptin reduces food intake, food was removed from mice cages just before i.p. injections to avoid any confounds associated with altered ethanol drinking secondary to changes in food intake. Just before the beginning of the dark cycle, mice received an i.p. injection of 15mM HCl mixed with 7.5mM NaOH in saline (16 ml/kg, the vehicle used for leptin) for 2-days prior to the start of the experiment and on days 1-3 of the experiment to habituate them to the injection procedures. Mice were then distributed into 2-groups (n = 10/group) matched for average ethanol consumption that occurred over the first 3-days of the experiment. On the fourth day, mice were given an i.p. injection of vehicle or mouse leptin (20 μg/g mixed in 0.9% saline containing 15mM HCl and 7.5mM NaOH; Calbiochem, San Diego, CA) immediately before lights out. We chose to given leptin at the beginning of the dark phase rather than just before ethanol access because the actions of this dose of leptin on food last for up to 24-hours (Prpic et al., 2003). Ethanol bottles were placed on the cages 3-hours into the dark cycle as per the DID schedule. Tail blood sample (6 μl) was collected from all mice immediately following the 4-hour test session to determine BECs. Ethanol consumption and body weight measures were recorded and the amount of ethanol consumed was calculated as g of ethanol consumed per kg of body weight (g/kg).
To confirm that leptin was physiologically active, a naïve group of C57BL/6J mice were used to assess the effects of leptin on food intake. Mice were distributed into 2-groups (n = 10/group) based on body weights. The mice received 2-days of habituation injections (i.p.) of the leptin vehicle at the beginning of the dark cycle. Mice were then given an i.p. injection of vehicle or mouse leptin (20 μg/g) immediately before lights out and food consumption was measured starting 3-hours into the dark cycle and continued for 4-hours. Food consumption was calculated as g/4-hours.
Experiment 4: Hourly Measures of Food Intake and Saccharin Consumption
Naïve C57BL/6J mice (n = 7) were used to assess the consummatory patterns of food (caloric substance) or a 0.05% (w/v) saccharin solution (non-caloric substance). After habituation to the environment (2-weeks), food consumption was measured hourly starting 1-hour before the beginning of the dark cycle and continuing until 11-hours into the dark cycle (thus, 4-hours before and after the normal DID testing period). Food consumption was calculated as g consumed for each hourly measure. After food measures were complete, the same mice were given 4-days of two bottle choice access to water and a 0.05% saccharin solution to habituate them to the novel tastant. Following the habituation period, hourly measures of saccharin solution were assessed beginning 1-hour before the beginning of the dark cycle until 11-hour into the dark cycle. Saccharin consumption was calculated as g consumed per kg of body weight (g/kg) for each hourly measure.
Data Analysis
All data in this report are presented as means ± SEM. One-way analyses of variance (ANOVAs) were used to analyze ethanol consumption and BEC data from Experiments 1 - 3. Repeated measures ANOVAs with post hoc t-tests were used to analyze food and saccharin consumption in Experiment 4. Significance was accepted at p < 0.05 (two-tailed).
RESULTS
Experiment 1: Effects of Food Deprivation on Ethanol Intake Associated with DID Procedures
Ethanol consumption during the 2-hour access on days 1-3 of Experiment 1 are presented in top portion of Table 1. ANOVAs revealed no significant group differences in ethanol consumption during days 1-3. Ethanol consumption and blood ethanol concentration data from the 4-hour test day of Experiment 1 are presented in Figs. 1A and 1B, respectively. One-way ANOVAs performed on these data revealed no significant effect of food deprivation on ethanol consumption [F(3, 36) = 1.77, p = 0.17] or blood ethanol concentrations [F(3, 36) = 1.44, p = 0.25]. There was a significant correlation between the amount of ethanol consumed and blood ethanol levels [R = 0.69, p < 0.001].
Table 1.
Ethanol consumption (g/kg/2-hour) on days 1-3 (mean ± SEM) of Experiments 1-3.
| Day 1 | Day 2 | Day 3 | |
|---|---|---|---|
| Experiment 1 | |||
| 0-h Food Deprivation | 4.13 +/- 0.33 | 3.07 +/- 0.26 | 2.52 +/- 0.30 |
| 4-h Food Deprivation | 4.02 +/- 0.62 | 2.58 +/- 0.27 | 1.68 +/- 0.33 |
| 7-h Food Deprivation | 3.53 +/- 0.27 | 2.45 +/- 0.32 | 1.92 +/- 0.26 |
| 10-h Food Deprivation | 3.36 +/- 0.18 | 2.60 +/- 0.27 | 2.31 +/- 0.45 |
| Experiment 2 | |||
| 0 g/kg Ghrelin | 2.25 +/- 0.40 | 1.97 +/- 0.27 | 2.36 +/- 0.69 |
| 10 g/kg Ghrelin | 1.68 +/- 0.45 | 2.13 +/- 0.28 | 2.12 +/- 0.28 |
| 30 g/kg Ghrelin | 2.35 +/- 0.36 | 1.82 +/- 0.27 | 1.62 +/- 0.27 |
| Experiment 3 | |||
| 0 μg/g Leptin | 1.83 +/- 0.37 | 2.94 +/- 0.45 | 1.94 +/- 0.41 |
| 20 μg/g Leptin | 1.94 +/- 0.28 | 2.16 +/- 0.26 | 2.57 +/- 0.31 |
Fig. 1.
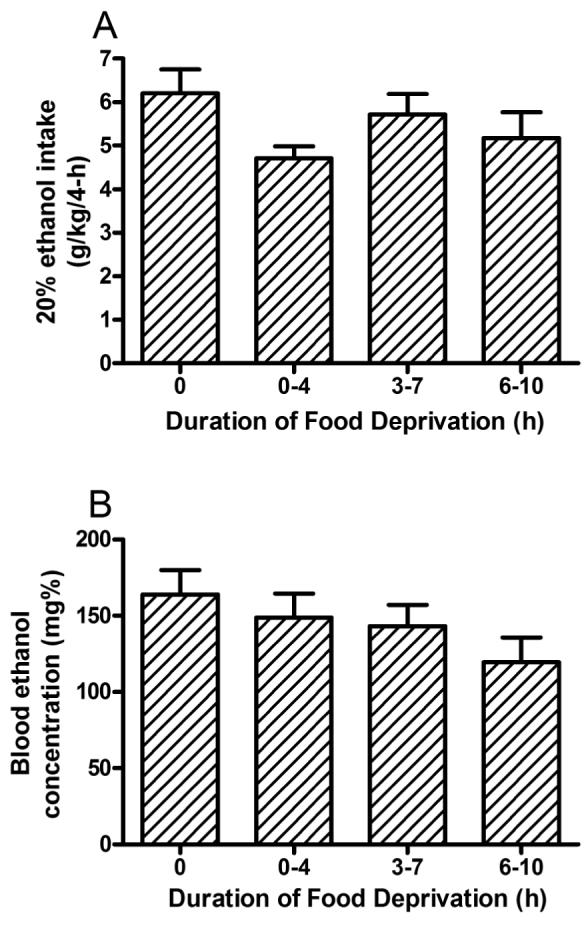
Consumption of 20% (v/v) ethanol by C57BL/6J mice (A) and associated blood ethanol concentrations (B) during the 4-hour test day of Experiment 1. Mice were deprived of food for 0, 0-4, 3-7, or 6-10 hours during DID procedures on day 4, which corresponded to ad libitum access to food, or removing food at the initiation of DID procedures, 3-hours before DID procedures (at the beginning of the dark cycle), or 6-hours before DID procedures (3-hours before the beginning of the dark cycle). Food deprivation did not significantly alter ethanol drinking or associated blood ethanol concentrations. All values are means + SEM.
Experiment 2: Effects of Ghrelin Injection on Ethanol Intake Associated with DID Procedures and Basal Food Consumption
Ethanol consumption during the 2-hour access on days 1-3 of Experiment 2 are presented in middle portion of Table 1. ANOVAs revealed no significant group differences in ethanol consumption during days 1-3. Ethanol consumption and blood ethanol concentration data from the 4-hour test day of Experiment 2 are presented in Figs. 2A and 2B, respectively. One-way ANOVAs performed on these data revealed that neither of the doses of ghrelin examined significantly altered ethanol consumption [F(2, 22) = 1.06, p = 0.36] or blood ethanol levels [F(2, 22) = 1.10, p = 0.35]. There was a significant correlation between the amount of ethanol consumed and blood ethanol concentrations [R = 0.604, p = 0.001]. The effects of ghrelin on food consumption are presented in Fig. 3C. Administration of the 30 mg/kg dose of ghrelin significantly increased 4-h food consumption [F(1, 16) = 21.30, p < 0.001], verifying that this dose of ghrelin was physiologically active in C57BL/6J mice.
Fig. 2.
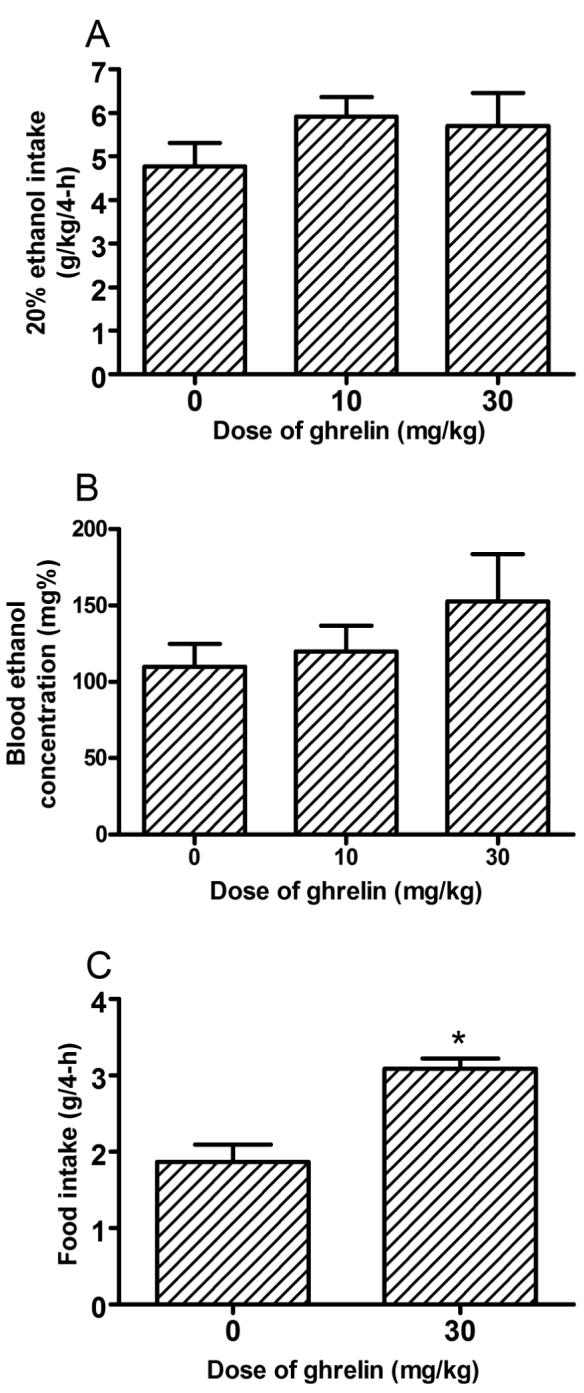
Consumption of 20% (v/v) ethanol by C57BL/6J mice (A) and associated blood ethanol concentrations (B) during the 4-hour test day of Experiment 2. Immediately before ethanol access, food was removed from the cages and mice were given an intraperitoneal (i.p.) injection of mouse ghrelin (0, 10, 30 mg/kg). Ghrelin did not significantly alter ethanol consumption or blood ethanol concentrations. Ghrelin (30 mg/kg) did significantly increase 4-hour food intake by C57BL/6J (C). All values are means + SEM. *p < 0.05.
Fig. 3.
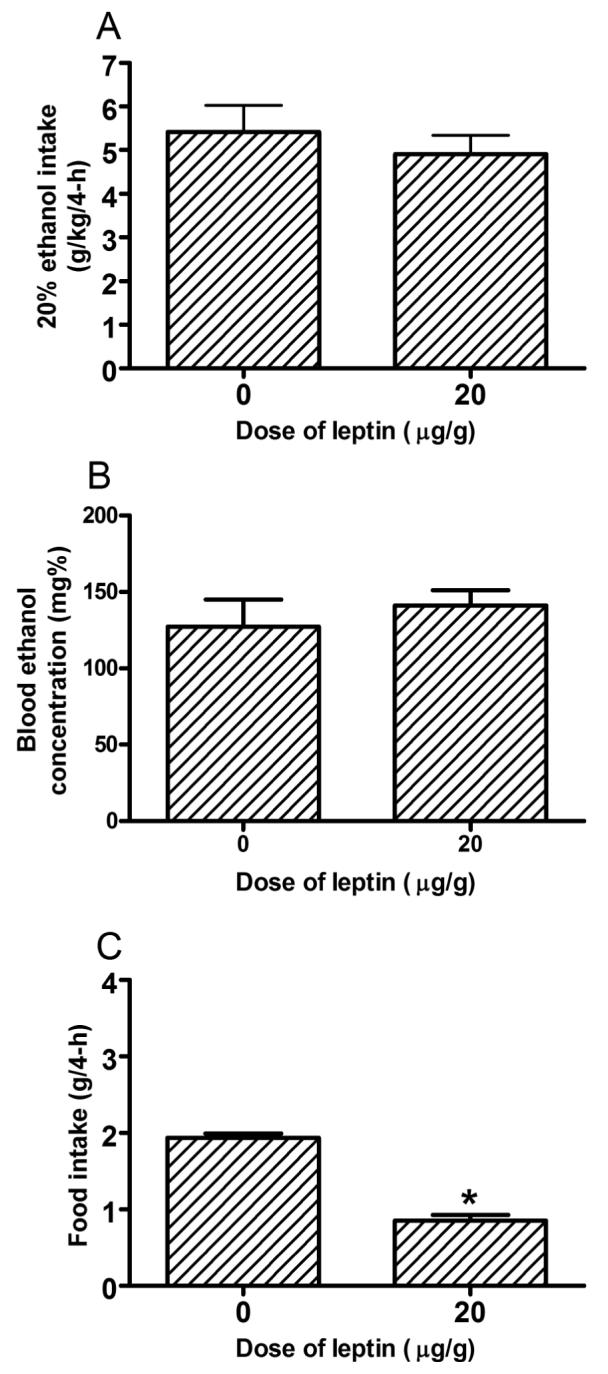
Consumption of 20% (v/v) ethanol by C57BL/6J mice (A) and associated blood ethanol concentrations (B) during the 4-hour test day of Experiment 3. Immediately before lights out, food was removed from the cages and mice were given an i.p. injection of mouse leptin (0, 20 μg/g). Leptin did not alter ethanol consumption or blood ethanol concentrations. A 20 μg/g dose of leptin did significantly reduced 4-h food intake (C). All values are means + SEM. *p < 0.05.
Experiment 3: Effects of Leptin Injection on Ethanol Intake Associated with DID Procedures and Basal Food Consumption
Ethanol consumption during the 2-hour access on days 1-3 of Experiment 3 are presented in bottom portion of Table 1. ANOVAs revealed no significant group differences in ethanol consumption during days 1-3. Ethanol consumption and blood ethanol concentration data from the 4-hour test day of Experiment 3 are presented in Figs. 3A and 3B, respectively. One-way ANOVAs performed on these data revealed that the 20 μg/g dose of leptin did not significantly alter ethanol consumption [F(1, 18) = 0.45, p = 0.51] or blood ethanol levels [F(1, 18) = 0.46, p = 0.50]. There was a significant correlation between the amount of ethanol consumed on day 4 and blood ethanol concentrations [R = 0.55, p = 0.01]. The effects of leptin on food consumption are presented in Fig. 3C. Importantly, administration of 20 μg/g dose of leptin significantly decreased 4-hour food consumption [F(1, 8) = 107.88, p < 0.001], verifying that this dose of leptin was physiologically active in C57BL/6J mice.
Experiment 4: Hourly Measures of Food Intake and Saccharin Consumption
The hourly consumption measures for food and 0.05% saccharin from experiment 4 are presented in Figs. 4A and 4B, respectively. Visual inspection of the data reveal that C57BL/6J mice showed highest levels of food intake during the period of the dark cycle during which ethanol is administered with DID procedures (Fig. 4A). Similarly, 0.05% saccharin solution consumption reached its peak levels during the time period used with DID procedures (Fig. 4B). To analyze these data, we averaged the data into three, 4-hour blocks of time which corresponded to the 4-hour period before the time of DID procedures, the 4-hour period during the time of DID procedures, and the 4-hour period after the time of DID procedures. A repeated measures ANOVA performed on food intake data revealed a significant effect of time block [F(2, 12) = 43.92, p < 0.001]. Post hoc tests showed that food intake was significantly higher during the block of time corresponding to DID manipulations relative to either the 4-hour block of time before or after this period. Similarly, a repeated measures ANOVA performed on 0.05% saccharin solution data revealed a significant effect of time block [F(2, 12) = 53.49, p < 0.001]. Post hoc tests showed that, relative to the 4-hour block of time preceding the period of time used with DID procedures, mice drank significantly more saccharin solution during the two other blocks of time.
Fig. 4.
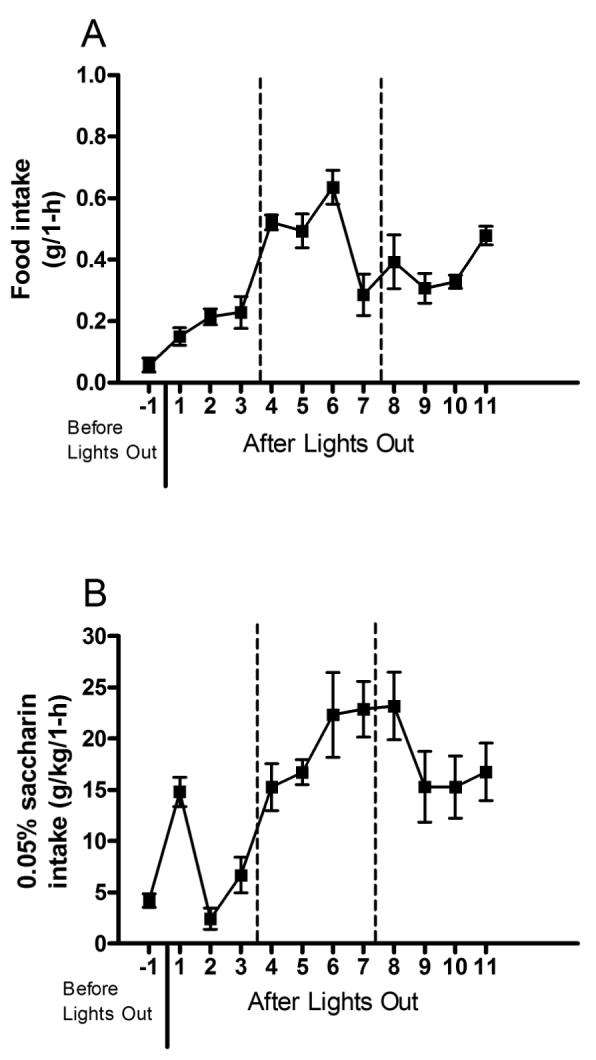
Hourly consumption of food (A) and 0.05% saccharin (B) from Experiment 4. Consumption of food and saccharin solution were measured hourly for a 12-h period from 4-hours before to 4-hours after the 4-hour timeframe that mice received ethanol during DID procedures. to determine normal consummatory patterns with a caloric (food) and non-caloric (saccharin) substance. The dotted lines indicate the 4-hour period of time that 20% ethanol is given to mice on the DID test day. All values are means ± SEM.
DISCUSSION
Because DID procedures involve providing C57BL/6J mice with limited access to ethanol during the time of day in which food intake is at its highest levels, it was possible that the high levels of ethanol drinking that are stimulated by DID procedures result from increased caloric need (that is, mice treat ethanol as another calorie-rich food source). If this caloric need hypothesis is correct, three predictions should be satisfied: 1) Removal of food should further augment ethanol drinking during DID procedures since ethanol becomes the sole source of calories, 2) pretreatment with an orexigenic peptide (i.e., a peptide that stimulates food intake) should further augment ethanol intake during DID procedures, and 3) pretreatment with an anorectic protein (i.e., an agent that reduces feeding) should attenuate ethanol intake during DID procedures. Contrary to the caloric need hypothesis, none of these predictions were confirmed. Thus, varying the amount of food deprivation time did not significantly alter ethanol drinking or blood ethanol levels. Furthermore, i.p. injection of ghrelin, a peptide that stimulates food intake (Chen et al., 2004; Wang et al., 2002), failed to increase ethanol drinking in a dose that increased food intake in C57BL/6J mice. Similarly, i.p. injection of leptin, a protein that attenuates feeding (Halaas et al., 1995; Prpic et al., 2003), failed to decrease ethanol intake in a dose that reduced feeding in C57BL/6J mice. Taken together, these observations suggest that the high levels of ethanol drinking promoted by DID procedures are unlikely motivated by caloric need, but rather by other factors such as the pharmacological post-ingestive effects of ethanol.
Interestingly, during the period of time that C57BL/6J mice received ethanol with DID procedures, they exhibited their highest levels of food intake when measures were collected from 4-hours before to 4-hours after the period of time used with DID procedure (Fig. 4A). At first glance, this observation appears to be consistent with the hypothesis that high levels of ethanol intake might be related to caloric need. However, we also observed that C57BL/6J mice showed high levels of saccharin solution consumption during this same period of time (Fig. 4B). Since saccharin is a non-caloric compound with reinforcing properties, increased consumption of saccharin cannot be related to increased caloric need. An alternative explanation is that C57BL/6J mice exhibit an increased motivation to consume reinforcing stimuli (such as food, sweet flavors, and ethanol) during the time of day that DID procedures are performed, and increased motivation to consume these reinforcing stimuli is independent of the reinforcer’s caloric content.
The present observation that ghrelin did not alter ethanol consumption in C57BL/6J mice is consistent with a recent report showing that hypothalamic infusion of ghrelin increased food intake but did not alter ethanol drinking in Sprague-Dawley rats (Schneider et al., 2007). Interestingly, plasma ghrelin levels were found to be elevated in alcoholics relative to normal individuals (Kraus et al., 2005) and plasma ghrelin levels were positively correlated with self-reports of craving in alcoholics (Addolorato et al., 2006). These observations suggest that while ghrelin may modulate neurobiological pathways involved in craving, this peptide may not directly modulate the ingestion of ethanol. Similarly, the present work with leptin is consistent with the observation that repeated daily injections of leptin failed to alter ethanol drinking in rats, although leptin did appear to augment deprivation-induced increases of ethanol drinking (Kiefer et al., 2001). However, disruption of leptin signaling in mutant mice was associated with reduced ethanol intake (Blednov et al., 2004). Circulating levels of leptin have also been found to be elevated in alcoholics, and are correlated with subjective reports of craving in alcoholics (Kiefer et al., 2005; Nicolas et al., 2001). Thus, as with ghrelin, while leptin may be involved with craving in human alcoholics, its role in modulating ethanol consumption in animal models remains unclear.
In the present report, we observed BECs in C57BL/6J mice that ranged from approximately 100 to 150 mg%. These levels of BECs are consistent with previous reports that have used DID procedures (Kamdar et al., 2007; Rhodes et al., 2005; Rhodes et al., 2007). Because C57BL/6J mice exhibit signs of behavioral intoxication with BECs in this range (Rhodes et al., 2007), DID procedures appear to provide a valid animal model of drinking to the point of physiological intoxication, and may be useful for identifying targets that may be protective against binge-like ethanol drinking (Kamdar et al., 2007; Moore et al., 2007; Sparta et al., 2008). The present results further strengthen the usefulness of this model by showing that elevated drinking with DID procedures is unlikely related to caloric need.
In conclusion, data obtained in the present study are inconsistent with the hypothesis that C57BL/6J mice consume large amounts of ethanol during DID procedures in order to satisfy a caloric need. Neither food deprivation nor administration of orexigenic or anorectic compounds significantly alter ethanol drinking with DID procedures. A more likely explanation is that increased ethanol drinking is motivated by other factors associated with the pharmacological post-ingestive effects of ethanol.
ACKNOWLEDGEMENTS
This work was supported by National Institute of Health grants AA013573, AA015148, AA015875, and the Department of Defense grant W81XWH-06-1-0158.
REFERENCES
- Addolorato G, Capristo E, Leggio L, Ferrulli A, Abenavoli L, Malandrino N, Farnetti S, Domenicali M, D’Angelo C, Vonghia L, Mirijello A, Cardone S, Gasbarrini G. Relationship between ghrelin levels, alcohol craving, and nutritional status in current alcoholic patients. Alcohol Clin Exp Res. 2006;30:1933–1937. doi: 10.1111/j.1530-0277.2006.00238.x. [DOI] [PubMed] [Google Scholar]
- Blednov YA, Walker D, Harris RA. Blockade of the leptin-sensitive pathway markedly reduces alcohol consumption in mice. Alcohol Clin Exp Res. 2004;28:1683–1692. doi: 10.1097/01.alc.0000145790.60216.c8. [DOI] [PubMed] [Google Scholar]
- Chen HY, Trumbauer ME, Chen AS, Weingarth DT, Adams JR, Frazier EG, Shen Z, Marsh DJ, Feighner SD, Guan XM, Ye Z, Nargund RP, Smith RG, Van der Ploeg LH, Howard AD, MacNeil DJ, Qian S. Orexigenic action of peripheral ghrelin is mediated by neuropeptide Y and agouti-related protein. Endocrinology. 2004;145:2607–2612. doi: 10.1210/en.2003-1596. [DOI] [PubMed] [Google Scholar]
- Halaas JL, Gajiwala KS, Maffei M, Cohen SL, Chait BT, Rabinowitz D, Lallone RL, Burley SK, Friedman JM. Weight-reducing effects of the plasma protein encoded by the obese gene. Science. 1995;269:543–546. doi: 10.1126/science.7624777. [DOI] [PubMed] [Google Scholar]
- Ho A, Chin A. Circadian feeding and drinking patterns of genetically obese mice fed solid chow diet. Physiol Behav. 1988;43:651–656. doi: 10.1016/0031-9384(88)90221-1. [DOI] [PubMed] [Google Scholar]
- Kamdar NK, Miller SA, Syed YM, Bhayana R, Gupta T, Rhodes JS. Acute effects of naltrexone and GBR 12909 on ethanol drinking-in-the-dark in C57BL/6J mice. Psychopharmacology (Berl) 2007;192:207–217. doi: 10.1007/s00213-007-0711-5. [DOI] [PubMed] [Google Scholar]
- Kiefer F, Jahn H, Otte C, Demiralay C, Wolf K, Wiedemann K. Increasing leptin precedes craving and relapse during pharmacological abstinence maintenance treatment of alcoholism. J Psychiatr Res. 2005;39:545–551. doi: 10.1016/j.jpsychires.2004.11.005. [DOI] [PubMed] [Google Scholar]
- Kiefer F, Jahn H, Wolf K, Kampf P, Knaudt K, Wiedemann K. Free-choice alcohol consumption in mice after application of the appetite regulating peptide leptin. Alcohol Clin Exp Res. 2001;25:787–789. [PubMed] [Google Scholar]
- Kraus T, Schanze A, Groschl M, Bayerlein K, Hillemacher T, Reulbach U, Kornhuber J, Bleich S. Ghrelin levels are increased in alcoholism. Alcohol Clin Exp Res. 2005;29:2154–2157. doi: 10.1097/01.alc.0000191753.82554.7e. [DOI] [PubMed] [Google Scholar]
- Moore EM, Serio KM, Goldfarb KJ, Stepanovska S, Linsenbardt DN, Boehm SL. GABAergic modulation of binge-like ethanol intake in C57BL/6J mice. Pharmacol Biochem Behav. 2007;88:105–113. doi: 10.1016/j.pbb.2007.07.011. [DOI] [PMC free article] [PubMed] [Google Scholar]
- Nicolas JM, Fernandez-Sola J, Fatjo F, Casamitjana R, Bataller R, Sacanella E, Tobias E, Badia E, Estruch R. Increased circulating leptin levels in chronic alcoholism. Alcohol Clin Exp Res. 2001;25:83–88. [PubMed] [Google Scholar]
- Prpic V, Watson PM, Frampton IC, Sabol MA, Jezek GE, Gettys TW. Differential mechanisms and development of leptin resistance in A/J versus C57BL/6J mice during diet-induced obesity. Endocrinology. 2003;144:1155–1163. doi: 10.1210/en.2002-220835. [DOI] [PubMed] [Google Scholar]
- Rhodes JS, Best K, Belknap JK, Finn DA, Crabbe JC. Evaluation of a simple model of ethanol drinking to intoxication in C57BL/6J mice. Physiol Behav. 2005;84:53–63. doi: 10.1016/j.physbeh.2004.10.007. [DOI] [PubMed] [Google Scholar]
- Rhodes JS, Ford MM, Yu CH, Brown LL, Finn DA, Garland T, Jr., Crabbe JC. Mouse inbred strain differences in ethanol drinking to intoxication. Genes Brain Behav. 2007;6:1–18. doi: 10.1111/j.1601-183X.2006.00210.x. [DOI] [PubMed] [Google Scholar]
- Schneider ER, Rada P, Darby RD, Leibowitz SF, Hoebel BG. Orexigenic peptides and alcohol intake: differential effects of orexin, galanin, and ghrelin. Alcohol Clin Exp Res. 2007;31:1858–1865. doi: 10.1111/j.1530-0277.2007.00510.x. [DOI] [PubMed] [Google Scholar]
- Spanagel R. Recent animal models of alcoholism. Alcohol Res Health. 2000;24:124–131. [PMC free article] [PubMed] [Google Scholar]
- Sparta DR, Sparrow AM, Lowery EG, Fee JR, Knapp DJ, Thiele TE. Blockade of the Corticotropin Releasing Factor (CRF) Type 1 Receptor Attenuates Elevated Ethanol Drinking Associated with Drinking in the Dark Procedures. Alcohol Clin Exp Res. 2008;32:259–265. doi: 10.1111/j.1530-0277.2007.00575.x. [DOI] [PMC free article] [PubMed] [Google Scholar]
- Tabarin A, Diz-Chaves Y, Consoli D, Monsaingeon M, Bale TL, Culler MD, Datta R, Drago F, Vale WW, Koob GF, Zorrilla EP, Contarino A. Role of the corticotropin-releasing factor receptor type 2 in the control of food intake in mice: a meal pattern analysis. Eur J Neurosci. 2007;26:2303–2314. doi: 10.1111/j.1460-9568.2007.05856.x. [DOI] [PMC free article] [PubMed] [Google Scholar]
- Wang L, Saint Pierre DH, Tache Y. Peripheral ghrelin selectively increases Fos expression in neuropeptide Y - synthesizing neurons in mouse hypothalamic arcuate nucleus. Neurosci Lett. 2002;325:47–51. doi: 10.1016/s0304-3940(02)00241-0. [DOI] [PubMed] [Google Scholar]