Abstract
Testosterone (T) and its metabolite dihydrotestosterone (DHT) are androgens with different biologic profiles. T and DHT measurements are required for assessment of patients with ambiguous genitalia, hirsutism, during 5 alpha reductase treatment of prostate disorders, and new androgen formulations. Our laboratory has developed and validated a method to simultaneously measure serum T and DHT with liquid chromatography tandem mass spectrometry (LC-MS/MS) for use in a clinical chemistry laboratory. Analysis of sera from blood collected in tubes containing clot activator gave results of T that were four fold higher than blood collected in plain tubes. Changing the ion pair selected for monitoring eliminated this interference by clot activators. Blood collected in fluoride coated tubes gave serum T and DHT levels that were 20 and 15 percent lower respectively than levels measured in blood collected in plain tubes (no additives). Addition of T enanthate to blood collected in plain tubes caused a dose related increase serum T levels due to the action of non-specific esterases in the red cells. This esterase activity could be avoided by using fluoride tubes for blood collection. Serum DHT levels were consistently lower when measured by LC-MS/MS versus radioimmunoassay. The differences were concentration dependent and the variance for the difference was large when serum DHT concentration was low. Celite chromatograph prior to radioimmunoassay reduced the differences between the two methods, thus confirming that higher levels of DHT obtained by immunoassays were probably due to interfering substances which were partially removed by Celite chromatography.
Keywords: Liquid chromatography tandem mass spectrometry, Testosterone, Dihydrotestosterone, Collection tubes, Testosterone Esters, Immunoassays
1. Introduction
In recent years, a number of studies have demonstrated that the commonly used immunoassays for determination of testosterone (T) lack precision and accuracy which is most marked at the concentrations near the lower limit of quantitation (LLOQ) [1-5]. In clinical practice T measurements by immunoassays can help to diagnose hypogonadism in men whose testosterone levels are significantly below the reference range of healthy adult men. However, when serum T concentrations hover at the lower limit of the reference range, the diagnosis of hypogonadism will require further laboratory tests for confirmation including the measurement of free or bioavailable T concentrations. The estimation of free or bioavailable T requires a sensitive, specific, precise and accurate T assay [6,7]. Measurements of serum T concentrations in women and children by immunoassay may not be useful for clinical diagnosis because of the lack of accuracy and precision for T at low serum concentrations [4,5,7]. Serum dihydrotestosterone (DHT) measurements are often required in pharmacokinetic studies of androgen delivery systems to ensure there is no excessive conversion of T to DHT and that the total T plus DHT levels are maintained within the physiological ranges in adult men. DHT has more androgen receptor binding activity than T and is the principal androgen in the prostate. DHT may stimulate prostate growth more than T [8]. Serum DHT levels are also used for the diagnosis of 5 alpha-reductase deficiency and monitor treatment of benign prostatic hyperplasia or prevention of prostate cancer by 5 alpha reductase inhibitors [9]. The role of DHT in androgen excess syndrome in women is not known because of the difficulty of immunoassays to measure serum DHT accurately and precisely using methods which requires oxidation and extraction or column chromatography before assay [10,11].
Recently, we have developed a method to simultaneously measure serum T and DHT using a simple liquid/liquid extraction before liquid chromatography tandem mass spectrometry suitable for human clinical and research samples [12]. This method has good precision and accuracy and the LLOQ of both T and DHT in serum was 0.069 nmol/L (2 ng/dL). Though other methods for T and DHT measurement using mass spectrometry have been described, these methods require solid phase extraction and frequently a derivatization step before gas or liquid chromatography mass spectrometry. Moreover the methods were used to measure T and DHT for animal studies, in culture media, in prostate and testicular interstitial fluids [13-16]. None of these previously published studies were validated for use in a clinical laboratory. This study describes some of the interference by substances in tubes used for blood collection and problems with comparison against established immunoassay methods that were detected during validation of simultaneous measurements of T and DHT by LC-MS/MS method.
2. Experimentals
2.1. Human Serum Samples
Serum samples were obtained from 113 healthy male volunteers aged between19 to 49 years during screening before enrollment in male contraceptive clinical trials. Serum samples from the healthy volunteers were obtained between 7 to 10 hours in the morning. Serum samples were also obtained from hypogonadal men (19 to 83 years) who participated in previously published clinical trials before and after application of transdermal T (4 samples) and DHT (78 samples) hydro-alcoholic gels [17-19]. In addition 99 serum samples were also obtained from hypogonadal men (26 to 59 years) collected after treatment with an oral testosterone preparation containing T in a lipid-based drug delivery system with controlled release characteristics (Clarus Therapeutics, Northbrook, IL). Serum samples were stored at -20°C and were thawed once before these studies. Our validation studies for the T and DHT assays showed that serum concentrations of these steroids are not affected by up to 10 freeze and thaw cycles. The subjects gave informed consent that the residual samples left from the clinical studies may be used by the laboratory for research purposes.
In addition, for the in-vitro studies of interference by blood collection tubes and testosterone esters, about 80 mL blood samples were collected twice from another 5 volunteers. Whole blood was used immediately after collection for these interference studies.
2.2. LC-MS/MS Method
Testosterone and DHT (>99% pure Sigma Aldrich, St. Louis, MO) were used as calibration standards. 1,2 deuterated (D2)-testosterone (>98% pure, Cambridge Isotope Laboratories, Inc., Andover, MA) was used as the internal standard for T quantitation so that the isotopic peak of T from C13 natural abundance would not interfere with the molecular ion of the recovery standard. 19, 19, 19 trideuterated (D3)-dihydrotestosterone synthesized by Dr. Barry Dent (> 98% pure, Wellington, New Zealand) was used as the internal standard for DHT measurements. Calibration standards and test samples were prepared for T and DHT LC-MS/MS using a liquid/liquid extraction twice with 2 mL ethyl acetate: hexanes (3:2 volume: volume) as previously described [12]. Shimadzu HPLC system (Columbia, MD) attached to an Applied Biosystems API5000 LC-MS/MS (Foster City, CA) equipped with a TurboIon Spray source was used to conduct the T and DHT analysis. Analytes were eluted through a Thermo HyperSil Gold column (100mm × 1mm, 3um) using a gradient profile (Solvent A: 98% H2O, 2% MeOH, 0.1% Formic Acid; Solvent B: MeOH) at a flow rate of 0.045mL/min. After optimization using the electrospray ionization in the positive mode, the respective parent/product ion pairs T (289.2/109.0 m/z), D2T (291.2/110.9 m/z), DHT (291.2/255.2 m/z), and D3DHT (294.2/258.2 m/z) were used for T and DHT analysis. There was no interference of T in the DHT assay and vice versa. The calibration standards showed a linear response from 0.35 nmol/L (1 ng/dL) to 69.3 nmol/L (2000 ng/dL) for T and to 34.4 nmol/L (1000 ng/dL) for DHT. The within and between run precision was less than 5 % for both T and DHT. The recovery of samples spiked with the steroids was between 100 to 113% for T and 98 to 107 % for DHT. The lower limit of quantitation was 0.069 nmol/L (2 ng/dL) for both steroids.
2.3. Interference by blood collection tubes
5 mL of blood was placed each into 7 mL plain glass tubes (BD Vacutainer® no additive, red top), tubes with clot activator and gel (BD Vacutainer® gold top), heparin (BD Vacutainer® with 100 USP heparin, green top), EDTA (BD Vacutainer® with 12.5 mg potassium EDTA, lavender top) and 4 mL citrate (BD Vacutainer® with 3.2% sodium citrate, blue top) tubes and allowed to stand at room temperature (23°C) for 30 minutes before centrifugation. Serum were then processed and analyzed for T and DHT. Because we were studying the effect of T esters on the measurement of T and DHT, we collected blood in fluoride tubes to inhibit non-specific esterases present in red blood cells. Two mL of blood was placed into 7 mL BD Vacutainer® tubes containing 30 mg (light grey) and 10 mg (dark grey) fluoride. The samples were allowed to stand to clot for 30 minutes before centrifugation. Serum were then processed and analyzed.
2.4. Interference by testosterone esters
Testosterone enanthate (TE) and undecanoate (TU) USP grade were obtained from Robert Dudley, PhD and Sandra Faulkner, RN (Clarus Therapeutics, Northbrook, IL). The T esters were dissolved in ethanol and a standard solution of 2.49 mmol/L for TE and 2.19 mmol/L for TU (1 mg/mL) were made. For the experiments TE and TU were diluted in buffered phosphate saline and then added to the plain blood collection tube (red top) or the fluoride tube (light grey tube) from 0 to 2469 nmol/L for TE and 2190 nmol/L for TU (1000ng/mL). The blood samples were allowed to clot for 30 minutes and then centrifuged at 4°C for 20 minutes. The samples were collected and assayed for T and DHT. This experiment was repeated twice for the serial dilution of the testosterone esters.
2.5. Comparison between LC-MS/MS versus immunoassays methods to measure DHT before and after androgen treatment
We compared 109 serum samples from hypogonadal and eugonadal (untreated) men, 78 from hypogonadal men after application of a DHT transdermal gel and 99 from hypogonadal men after ingestion of a single oral dose of T, Samples were treated with potassium permanganate and then extracted with solvent followed by radioimmunoassay (RIA) or taken through an additional step with Celite chromatography before being analyzed by RIA using kits from DSL (Webster, Texas) using previously described methods [10,11,18]. The lower limit of quantitation of the immunoassays with and without Celite chromatography was 0.43 nmol/L (12.5 ng/dL) which was about six fold higher than that of the LC-MS/MS
2.6. Data Analyses
Comparison of methods were analyzed by Deming regression [20-22]. Bland and Altman plots were constructed with the difference (or percent difference) between the methods against the average concentration of the two methods [23,24].
3. Results
3.1. Interference by different blood collection tubes
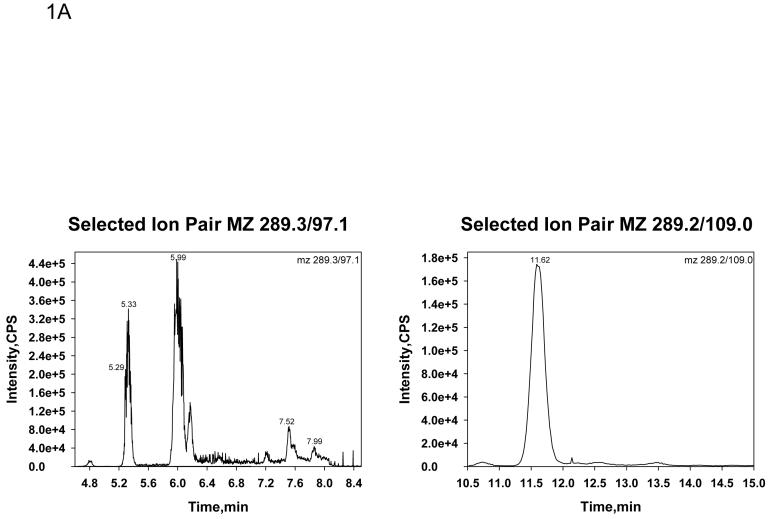
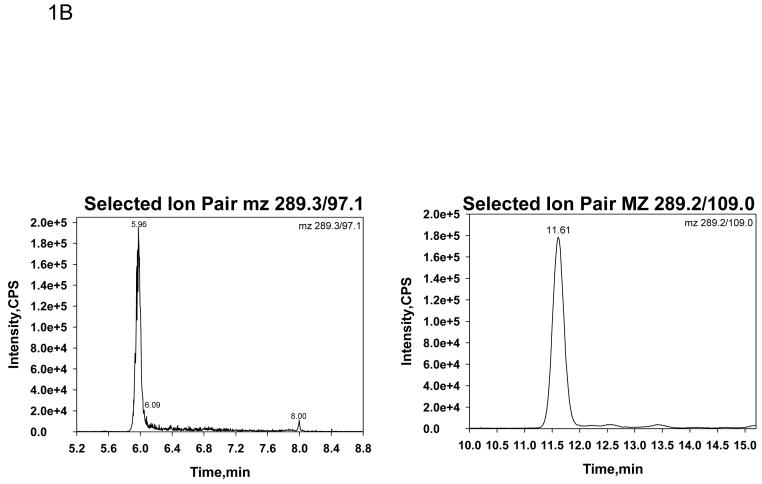
Table 1 shows the serum T concentrations in five male volunteers whose blood was collected in tubes with no additive (red tops), EDTA (lavender top), clot activator (gold top), citrate (blue top) and heparin (green top). In initial experiments, serum T was monitored at mz 289.3/97.1 and DHT at mz 291.2/255.2. Serum T levels were consistent across all blood collection tubes except for the blood collected with a clot activator (gold top). The clot activator caused approximately a four fold increase in serum T concentrations compared to the other blood collection tubes (Table 1, left panel). The chromatograph of T monitored at mz 289.3/97.1 in blood collected with a clot activator had many interfering peaks (Figure 1 A, left panel) which was not present when blood was collected in tubes without additives (Figure 1 B, left panel). When we added sodium hydroxide treatment to remove acidic contaminants, modified the column (changing a short wider column [Supelcosil C18, 3cm×3mm, 3 μm] to a long and narrower column [Thermo Hypersil GOLD C18 column, 10cm×1mm, 3 μm]) to increase resolution and improve chromatographic separation, and changed the monitoring the of T to ion pairs of mz 289.2/109.0, as an alternate to m/z 289.3/97.1, these chromatographic interfering substances from blood collected in tubes with clot activator disappeared (Figure 1 A, right panel). The chromatograph became similar to T monitored when the blood samples were collected in plain tubes (Figure 1 B, right panel). Serum T levels measured by LC-MS/MS from blood collected in various tubes were no longer different when T was monitored at this mz 289.2/109.0 (Table 1, right panel). Serum DHT levels were not significantly affected by blood collected in different tubes (data not shown).
Table 1.
Effect of blood collection tubes on serum T measurements (nmol/L)
| Monitoring at mz 289.3/97.1 | Monitoring at mz 289.2/109.0a | |||||||||
|---|---|---|---|---|---|---|---|---|---|---|
| Plain | EDTA | Clotb | Citrate | Heparin | Plain | EDTA | Clotb | Citrate | Heparin | |
| Subject 1 | 10.75 | 10.57 | 42.65 | 10.02 | 12.2 | 10.02 | 10.02 | 10.02 | 9.53 | 10.37 |
| Subject 2 | 14.39 | 14.01 | 57.21 | 11.55 | 13.59 | 12.41 | 12.62 | 12.14 | 10.78 | 10.75 |
| Subject 3 | 15.19 | 15.39 | 76.97 | 13.42 | 17.34 | 13.73 | 13.66 | 14.01 | 12.55 | 14.08 |
| Subject 4 | 19.55 | 18.34 | 72.46 | 16.78 | 19.21 | 16.43 | 16.33 | 16.54 | 14.77 | 16.68 |
| Subject 5 | 20.25 | 19.07 | 75.93 | 16.92 | 20.73 | 17.3 | 16.89 | 17.41 | 16.75 | 17.23 |
Sodium hydroxide treatment and column change
Clot Activator
Fig. 1.
Selected ion chromatographs by LC-MS/MS for serum T at a concentration of 10 nmol/L (289ng/dL) from a sample where the blood was collected in a tube with a clot activator (Fig. 1 A) or without any additive (Fig. 1B). The ion pair monitored in the left panels was 289.3/97.1 and in the right panel was 289.2/109.0.
We also tested blood collected in fluoride (light grey or dark grey tops) containing tubes. The effects of either concentration of fluoride on serum T and DHT measurements were similar. Serum T (12.86 ± 3.78 nmol/L) measured from four blood samples collected in light grey top tubes were 80 percent of the values measures from blood that was collected in plain tubes (16.05 ± 4.38 nmol/L). Serum DHT levels in blood collected in tubes with fluoride were 78 percent of the DHT levels when blood was collected in tubes with no additives (fluoride tube 0.56 ± 0.03 nmol/L; plain tubes 0.73 ± 0.04nmol/L).
3.2. Effect of Testosterone Esters on the Measurement of T and DHT
When subjects were administered T esters as an injection (Testosterone Enanthate, TE; or Testosterone Undecanoate, TU) or as an oral preparation capsules (Testosterone Undecanoate, TU), the levels of serum T esters (TE or TU) shortly after administration may reach very high levels in the circulation. Such high levels of T esters in blood may interfere with serum T measurements because the possible hydrolysis of T esters into the steroid and the fatty acid side chain moieties by non-specific esterases present in the blood during blood collection and processing. We studied the direct effect of T esters, TE and TU, added to blood in tubes without additives on the serum T and DHT levels measured by LC-MS/MS. Table 2 shows serum T and DHT concentrations measured in blood added to plain tubes with increasing concentrations of TE or TU. The experiments were also repeated with the highest concentration of TE and TU added to blood in tubes containing fluoride. Fluoride was used to inhibit the non-specific esterases in the blood which hydrolyze TU and TE to form T and the fatty acid side chain. As noted above, the presence of fluoride decreased the serum T by about 20% and serum DHT measurements16% due to interference in the steroid assays.
Table 2.
Interference of T esters during blood collection and processing on serum T and DHT measurements by LC-MS/MS
| T esters added (nmol/L) | Measured T (nmol/L) | Measured DHT (nmol/L) |
|---|---|---|
| TE 0 | 8.98 | 0.69 |
| TE 25 | 9.01 | 0.63 |
| TE 75 | 9.33 | 0.66 |
| TE 250 | 11.5 | 0.63 |
| TE 749 | 11.84 | 0.61 |
| TE 2496 | 34.65 | 0.66 |
| TU 0 | 8.91 | 0.64 |
| TU 22 | 9.27 | 0.71 |
| TU 66 | 8.85 | 0.7 |
| TU 219 | 8.86 | 0.71 |
| TU 657 | 8.66 | 0.66 |
| TU 2190 | 9.6 | 0.7 |
| TU 0 +TE 0 | 9.12 | 0.73 |
| TU 22 +TE 25 | 9.3 | 0.71 |
| TU 66 +TE 75 | 9.06 | 0.69 |
| TU 219 +TE 250 | 11.89 | 0.7 |
| TU 657 +TE 749 | 11.44 | 0.71 |
| TU 2190 +TE 2496 | 40.83 | 0.81 |
| TU 0+TE 0 (Fluoride) | 7.46 | 0.71 |
| TU 2190 +TE 2496 (Fluoride) | 11.79 | 0.81 |
Addition of TE to tubes without fluoride resulted in a dose dependent increase in serum T levels. The concentration of serum T measured were increased by 2.5 nmol/L at TE concentration of 249.6 nmol/L (100 ng/mL) and even more marked, by 25.7 nmol/L, at very high TE concentrations of 2496.3 nmol/L TE (1000 ng/mL) due to the hydrolysis of TE to T and the enanthate moiety. When fluoride coated tubes were used to inhibit the red cell non-specific esterases, these increases in serum T induced by addition of TE was decreased markedly to levels that were similar to samples where no TE was added. This interference due to hydrolysis of the T ester did not occur with TU where serum T levels were not significantly increased by the addition of very high concentrations of up to 2190 nmol/L TU (1000 ng/mL). The addition of either T esters did not affect the concentration of serum DHT measured.
3.3. Serum DHT levels in men before and after androgen treatment - LC-MS/MS versus immunoassays
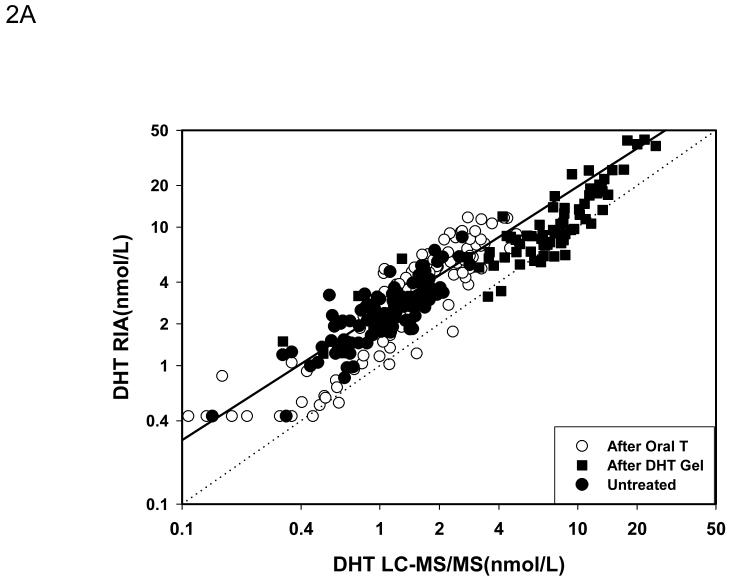
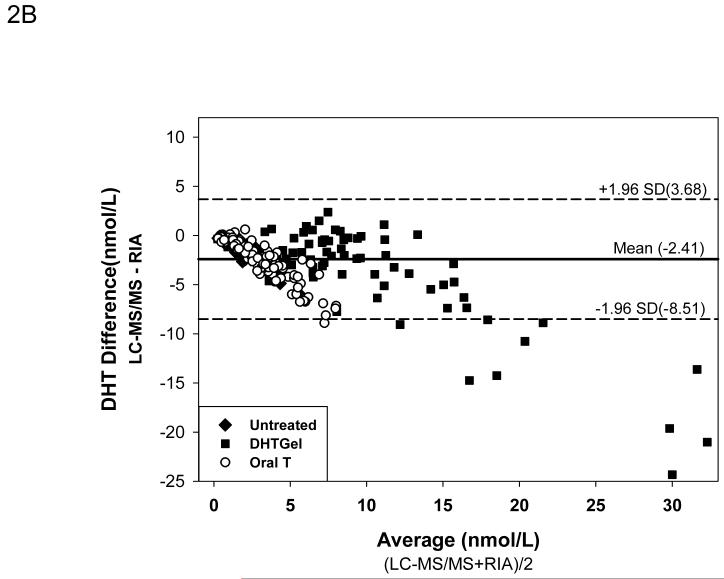
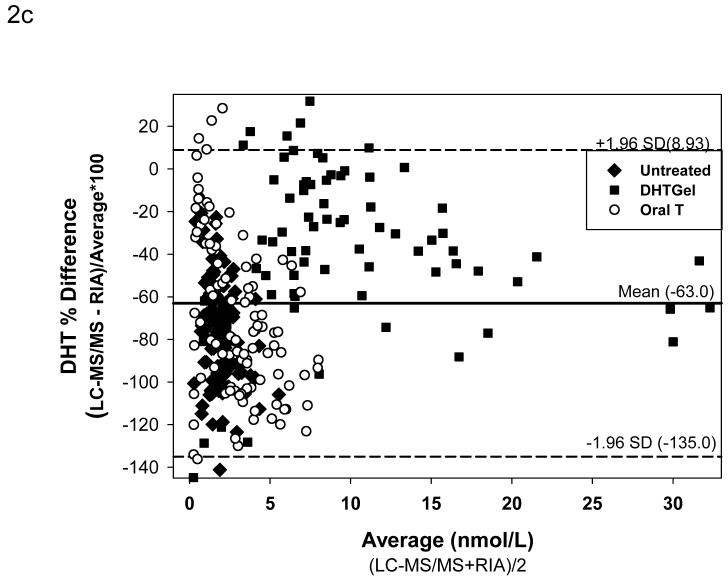
For comparison between LC-MS/MS and RIA after potassium permanganate treatment, 286 serum samples were utilized (109 form healthy men or hypogonadal men before treatment “untreated”; 78 from hypogonadal men after transdermal DHT gel treatment and 99 from men after administration of a single dose of oral testosterone). 112 samples (46 in untreated men, 26 after transdermal DHT treatment and 60 after oral T administration) were used to compare LC-MS/MS versus RIA after Celite chromatography. Figure 2A shows the Deming regression of the samples measured by RIA without chromatography and LC-MS/MS. Serum levels of DHT measured by RIA were much higher than those measured by LC-MS/MS (DHT by RIA = 0.124+1.711 DHT by LC-MS/MS; r=0.9186). The Bland and Altman plots of the difference (Figure 2B) and the percent difference (Figure 2C) between the methods confirmed that the DHT values obtained were much lower with LC-MS/MS when compared to RIA (difference: -2.41 ± 0.18 nmol/L [mean ± SEM]; mean percent difference: -63 ± 2.13%) and that the difference between the methods became more marked with increasing concentrations of DHT measured (Fig. 2 B). Large differences between the two methods, varying between + 30 to -140 percent, occurred in samples with serum DHT levels lower than 7.5 nmol/L (Fig. 2C).
Fig. 2.
Comparison of serum DHT measured by LC-MS/MS versus RIA after potassium permanganate treatment. Fig. 2A. Deming’s regression; Fig. 2B. Bland and Altman plot of the differences in serum DHT versus the average measured by LC-MS/MS and RIA; Bland and Altman plot of the percent differences versus the average serum DHT concentration measured by LC-MS/MS and RIA. (◆Untreated subjects, o subjects after oral T treatment, and ■ subjects after transdermal T or DHT treatment)
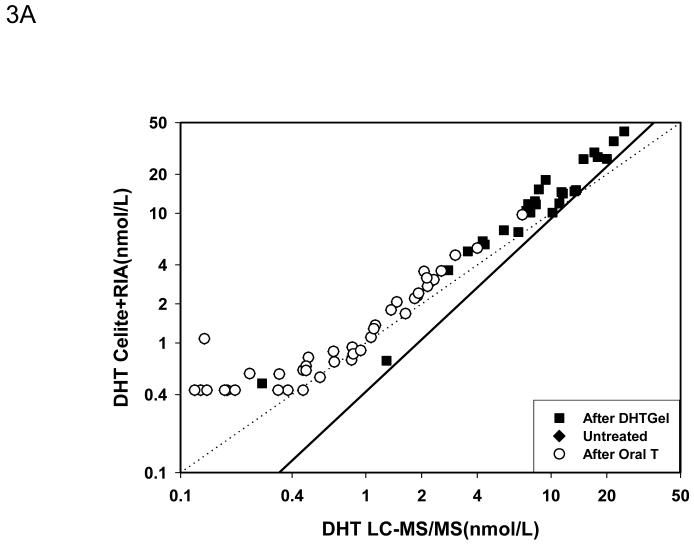
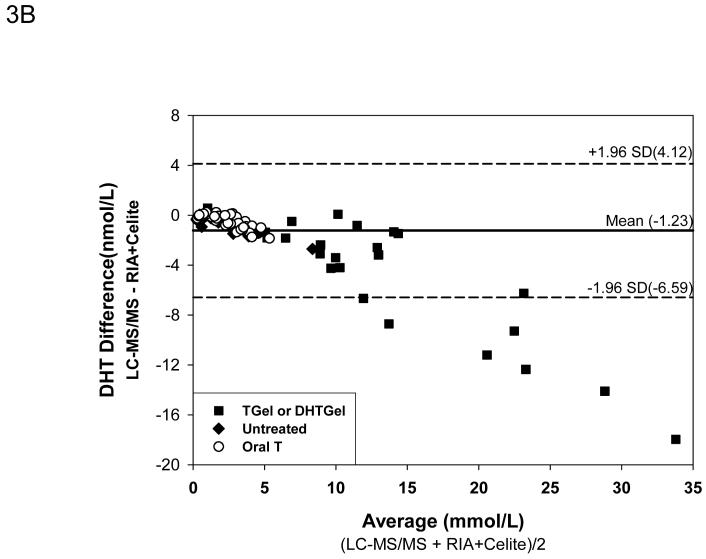
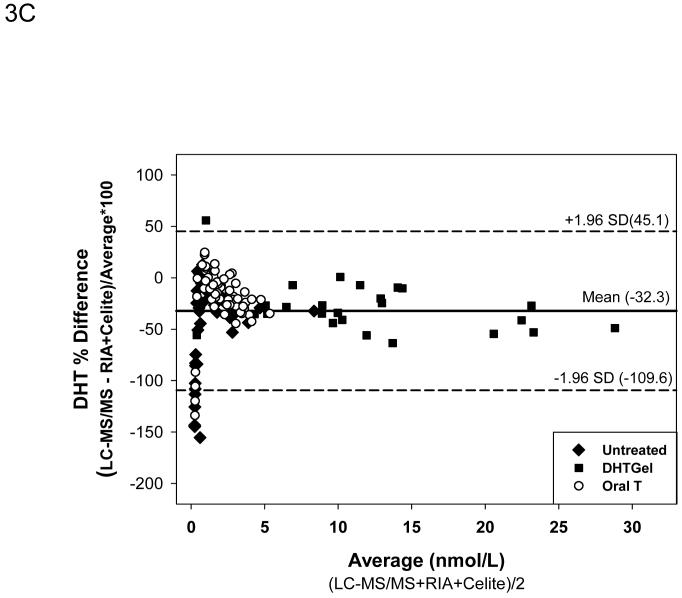
After Celite chromatography, the Deming regression (Fig. 3A) showed that the DHT measured by the RIA method remained higher than LC-MS/MS but the difference was less marked than RIA without chromatography despite good correlation between the two methods (DHT by RIA +Celite = 1.5674X-0.6337 nmol/L DHT by LC-MS/MS, r=0.983). The mean difference between the samples measured by LC-MS/MS versus RIA with Celite chromatography was -1.23 ± 0.24 nmol/L. Again the difference in serum DHT levels increased with higher concentrations of DHT that was observed only after exogenous DHT administration (Fig. 3B). The mean percent difference between values obtained by LC-MS/MS versus RIA plus Celite chromatography was -32.3 ± 3.42 % which was smaller than that between LC-MS/MS and RIA. The difference between the two methods were large only when the serum DHT levels were below 1 nmol/L(Fig. 3C).
Fig. 3.
Comparison of serum DHT measured by LC-MS/MS versus RIA after potassium permanganate treatment followed by Celite chromatography. Fig. 3A. Deming’s regression; Fig. 3B. Bland and Altman plot of the differences in serum DHT versus the average measured by LC-MS/MS and RIA; Bland and Altman plot of the percent differences versus the average serum DHT levels measured by LC-MS/MS and RIA after Celite Chromatography. (◆Untreated subjects, o subjects after oral T treatment, and ■ subjects after transdermal T or DHT treatment)
4. Discussion
We have developed a simple method to simultaneously measure T and DHT with a liquid/liquid extraction followed by LC-MS/MS which can be adapted for routine use in a clinical chemistry laboratory. Though prior methods have been described that could measure both the steroids plus other androgens, these methods frequently require solid phase extraction and derivatization to achieve the sensitivity that is required to measure these steroids in serum samples [13-16]. Moreover many of these methods did not fully validate steroid measurements for clinical use. Fully validated LS-MS-MS based assays for T have been described [25] including a reference method [26]. During the process of validation for routine clinical use we encountered problems of interference by additives in blood collection tubes. The clot activator present in blood collection tubes interfered with the measurement of T with the ion pair when monitored at mz 289.3/97.1, which was the selected transitions for monitoring T by the candidate reference method by Tai et al [26]. T values were over four fold higher when this ion pair was used to monitor T in serum collected in clot-activator tubes. To resolve this issue, we changed the column, and included a sodium hydroxide treatment step during sample preparation, and modified the selected transition to m/z 289.2/109.0. After these changes, the interference in blood collected in a tube with a clot activator was abolished. The transition m/z 289.2/109.0 ions were subsequently used in all our assays. We noted that the other commonly used tubes for blood collection did not cause such marked interference.
Testosterone enanthate (TE) is the commonest injectable T preparation used in the United States [27,28]. Testosterone enanthate recently has been tested in men as an oral preparation [29]. Testosterone Undecanoate (TU) has been available as an oral preparation for many years in many countries except the United States [30-32]. TU is also available as a 12 weekly injection in Europe, Australia and South America [33] and is being tested in clinical trials in the United States [34]. We then studied the interference of these esters during blood collection and processing in our T and DHT assays. TE and TU present in the blood are hydrolyzed by esterases into T and its fatty acid ester. These esterases are present in red blood cells. Fluoride inhibits non-specific esterases. We noted that serum obtained from blood collected in fluoride tubes gave serum T values that were about 20 and 15% lower for T and DHT, respectively, than those collected in tubes with no additives. The reason for the decrease in serum T measured is not known and may be due to T being transferred into the red cells during clotting or to interference with the LC-MS/MS method which cannot be easily corrected as in the situation of tubes with clot activator. Addition of TE at 250nmol/l to blood collected in red tubes resulted in a small increase of measured serum T; which increased to about four times higher when TE 2500 nmol/L was were added to the blood. This increase was largely abolished by using fluoride tubes to collect the blood to which TE was added. Interestingly, addition of TU to blood did not increase the measured serum T levels even at high concentrations.
In our previous study [12], we reported large differences between serum DHT measured by RIA compared to LC-MSMS methods. The serum DHT levels were generally higher when measured by RIA. Such difference had been previously reported for other steroids. and most probably due to interfering steroids in the serum [35]. In the present study we confirmed this finding in samples obtained before and after androgen replacement treatment. The DHT levels measured by LC-MS/MS were, in general, much lower than those measured by RIA without chromatography. Celite chromatography prior to RIA removed some of the interfering substances and decreased the difference between the methods but the levels obtained by LC-MS/MS remained consistently lower than those measured by RIA after Celite chromatography. Interfering substances such as structurally similar steroids, proteins and lipids in the serum and other unknown substances are contributing to differences in the methods, In summary, using a simple method to measure both T and DHT with high sensitivity, precision and accuracy, we identified interference in the blood collection tubes and T esters that patients may be prescribed. We identified problems interfering with RIA that preclude the validation of serum DHT against a previously validated method in laboratories which is required by regulatory agencies [36,37]. The concentration of serum DHT measured by any RIA method overestimates the serum DHT levels. The biological effects of circulating DHT in men and women need to be re-evaluated.
Acknowledgments
The study is supported by MO1RR00435 to the General Clinical Research Center at Harbor-UCLA Medical Center. We thank the staff of the General Clinical Research Center Core Laboratory and for their assistance with this study. We thank Robert Dudley, PhD and Sandy Faulkner, RN, from Clarus Therapeutics (Northbrook, IL) to allow us to use the residual serum samples from an orally administered testosterone preparation and for providing the testosterone esters.
The API 5000 was provided for research through a collaborative agreement between Los Angeles Biomedical Research Institute and Applied Biosystems, Framingham, MA. The employees of Applied Biosystems did not contribute to the research or writing of this manuscript.
Footnotes
Publisher's Disclaimer: This is a PDF file of an unedited manuscript that has been accepted for publication. As a service to our customers we are providing this early version of the manuscript. The manuscript will undergo copyediting, typesetting, and review of the resulting proof before it is published in its final citable form. Please note that during the production process errors may be discovered which could affect the content, and all legal disclaimers that apply to the journal pertain.
Reference List
- [1].Dorgan JF, Fears TR, McMahon RP, Aronson FL, Patterson BH, Greenhut SF. Measurement of steroid sex hormones in serum: a comparison of radioimmunoassay and mass spectrometry. Steroids. 2002;67:151–8. doi: 10.1016/s0039-128x(01)00147-7. [DOI] [PubMed] [Google Scholar]
- [2].Fitzgerald RL, Herold DA. Serum total testosterone: immunoassay compared with negative chemical ionization gas chromatography-mass spectrometry. Clin Chem. 1996;42:749–55. [PubMed] [Google Scholar]
- [3].Sikaris K, McLachlan RI, Kazlauskas R, de KD, Holden CA, Handelsman DJ. Reproductive hormone reference intervals for healthy fertile young men: evaluation of automated platform assays. J Clin Endocrinol Metab. 2005;90:5928–36. doi: 10.1210/jc.2005-0962. [DOI] [PubMed] [Google Scholar]
- [4].Taieb J, Mathian B, Millot F, et al. Testosterone measured by 10 immunoassays and by isotope-dilution gas chromatography-mass spectrometry in sera from 116 men, women, and children. Clin Chem. 2003;49:1381–95. doi: 10.1373/49.8.1381. [DOI] [PubMed] [Google Scholar]
- [5].Wang C, Catlin DH, Demers LM, Starcevic B, Swerdloff RS. Measurement of total serum testosterone in adult men: comparison of current laboratory methods versus liquid chromatography-tandem mass spectrometry. J Clin Endocrinol Metab. 2004;89:534–43. doi: 10.1210/jc.2003-031287. [DOI] [PubMed] [Google Scholar]
- [6].Bhasin S, Cunningham GR, Hayes FJ, et al. Testosterone therapy in adult men with androgen deficiency syndromes: an endocrine society clinical practice guideline. J Clin Endocrinol Metab. 2006;91:1995–2010. doi: 10.1210/jc.2005-2847. [DOI] [PubMed] [Google Scholar]
- [7].Rosner W, Auchus RJ, Azziz R, Sluss PM, Raff H. Utility, Limitations, and Pitfalls in Measuring Testosterone: An Endocrine Society Position Statement. J Clin Endocrinol Metab. 2007;92:405–13. doi: 10.1210/jc.2006-1864. [DOI] [PubMed] [Google Scholar]
- [8].Siiteri PK, Wilson JD. Dihydrotestosterone in prostatic hypertrophy. I. The formation and content of dihydrotestosterone in the hypertrophic prostate of man. J Clin Invest. 1970;49:1737–45. doi: 10.1172/JCI106391. [DOI] [PMC free article] [PubMed] [Google Scholar]
- [9].Thompson IM, Goodman PJ, Tangen CM, et al. The influence of finasteride on the development of prostate cancer. N Engl J Med. 2003;349:215–24. doi: 10.1056/NEJMoa030660. [DOI] [PubMed] [Google Scholar]
- [10].Abraham GE, Manlimos FS, Solis M, Wickman AC. Combined radioimmunoassay of four steroids in one ml of plasma: II. Androgens. Clin Biochem. 1975;8:374–8. doi: 10.1016/s0009-9120(75)93886-2. [DOI] [PubMed] [Google Scholar]
- [11].Werawatgoompa S, Dusitsin N, Sooksamiti P, Leepipatpaiboon S, Virutamasen P, Boonsiri B. A rapid method for the determination of 5 alpha-dihydrotestosterone in Thai males receiving medroxyprogesterone acetate. Contraception. 1982;25:523–33. doi: 10.1016/0010-7824(82)90041-5. [DOI] [PubMed] [Google Scholar]
- [12].Shiraishi S, Lee PWN, Leung A, Goh VHH, Swerdloff RS, Wang C. Simultaneous Measurement of Serum Testosterone and Dihydrotestosterone by Liquid Chromatography Tandem Mass Spectrometry. Clinical Chemistry. 2008 doi: 10.1373/clinchem.2008.103846. Under review. [DOI] [PubMed] [Google Scholar]
- [13].Chang YC, Li CM, Li LA, Jong SB, Liao PC, Chang LW. Quantitative measurement of male steroid hormones using automated on-line solid phase extraction-liquid chromatography-tandem mass spectrometry and comparison with radioimmunoassay. Analyst. 2003;128:363–8. doi: 10.1039/b210111b. [DOI] [PubMed] [Google Scholar]
- [14].Kalhorn TF, Page ST, Howald WN, Mostaghel EA, Nelson PS. Analysis of testosterone and dihydrotestosterone from biological fluids as the oxime derivatives using high-performance liquid chromatography/tandem mass spectrometry. Rapid Commun Mass Spectrom. 2007;21:3200–6. doi: 10.1002/rcm.3205. [DOI] [PubMed] [Google Scholar]
- [15].Kashiwagi B, Shibata Y, Ono Y, Suzuki R, Honma S, Suzuki K. Changes in Testosterone and Dihydrotestosterone Levels in Male Rat Accessory Sex Organs, Serum, and Seminal Fluid After Castration: Establishment of a New Highly Sensitive Simultaneous Androgen Measurement Method. J Androl. 2005;26:586–91. doi: 10.2164/jandrol.04164. [DOI] [PubMed] [Google Scholar]
- [16].Zhao M, Baker SD, Yan X, et al. Simultaneous determination of steroid composition of human testicular fluid using liquid chromatography tandem mass spectrometry. Steroids. 2004;69:721–6. doi: 10.1016/j.steroids.2004.05.020. [DOI] [PubMed] [Google Scholar]
- [17].Swerdloff RS, Wang C, Cunningham G, et al. Long-term pharmacokinetics of transdermal testosterone gel in hypogonadal men. J Clin Endocrinol Metab. 2000;85:4500–10. doi: 10.1210/jcem.85.12.7045. [DOI] [PubMed] [Google Scholar]
- [18].Wang C, Iranmanesh A, Berman N, et al. Comparative pharmacokinetics of three doses of percutaneous dihydrotestosterone gel in healthy elderly men--a clinical research center study. J Clin Endocrinol Metab. 1998;83:2749–57. doi: 10.1210/jcem.83.8.4996. [DOI] [PubMed] [Google Scholar]
- [19].Wang C, Berman N, Longstreth JA, et al. Pharmacokinetics of transdermal testosterone gel in hypogonadal men: application of gel at one site versus four sites: a General Clinical Research Center Study. J Clin Endocrinol Metab. 2000;85:964–9. doi: 10.1210/jcem.85.3.6437. [DOI] [PubMed] [Google Scholar]
- [20].Wakkers PJ, Hellendoorn HB, Op de Weegh GJ, Heerspink W. Applications of statistics in clinical chemistry. A critical evaluation of regression lines. Clin Chim Acta. 1975;64:173–84. doi: 10.1016/0009-8981(75)90199-0. [DOI] [PubMed] [Google Scholar]
- [21].Cornbleet PJ, Gochman N. Incorrect least-squares regression coefficients in method-comparison analysis. Clin Chem. 1979;25:432–8. [PubMed] [Google Scholar]
- [22].Konings H. Use of Deming regression in method-comparison studies. Surv Immunol Res. 1982;1:371–4. doi: 10.1007/BF02918550. [DOI] [PubMed] [Google Scholar]
- [23].Bland JM, Altman DG. Statistical methods for assessing agreement between two methods of clinical measurement. Lancet. 1986;1:307–10. [PubMed] [Google Scholar]
- [24].Bland JM, Altman DG. Measuring agreement in method comparison studies. Stat Methods Med Res. 1999;8:135–60. doi: 10.1177/096228029900800204. [DOI] [PubMed] [Google Scholar]
- [25].Kushnir MM, Rockwood AL, Roberts WL, et al. Performance characteristics of a novel tandem mass spectrometry assay for serum testosterone. Clin Chem. 2006;52:120–8. doi: 10.1373/clinchem.2005.052167. [DOI] [PubMed] [Google Scholar]
- [26].Tai SS, Xu B, Welch MJ, Phinney KW. Development and evaluation of a candidate reference measurement procedure for the determination of testosterone in human serum using isotope dilution liquid chromatography/tandem mass spectrometry. Anal Bioanal Chem. 2007;388:1087–94. doi: 10.1007/s00216-007-1355-3. [DOI] [PubMed] [Google Scholar]
- [27].Snyder PJ, Lawrence DA. Treatment of male hypogonadism with testosterone enanthate. J Clin Endocrinol Metab. 1980;51:1335–9. doi: 10.1210/jcem-51-6-1335. [DOI] [PubMed] [Google Scholar]
- [28].Sokol RZ, Palacios A, Campfield LA, Saul C, Swerdloff RS. Comparison of the kinetics of injectable testosterone in eugonadal and hypogonadal men. Fertil Steril. 1982;37:425–30. doi: 10.1016/s0015-0282(16)46108-x. [DOI] [PubMed] [Google Scholar]
- [29].Amory JK, Bremner WJ. Oral testosterone in oil plus dutasteride in men: a pharmacokinetic study. J Clin Endocrinol Metab. 2005;90:2610–7. doi: 10.1210/jc.2004-1221. [DOI] [PubMed] [Google Scholar]
- [30].Gooren LJ. A ten-year safety study of the oral androgen testosterone undecanoate. J Androl. 1994;15:212–5. [PubMed] [Google Scholar]
- [31].Skakkebaek NE, Bancroft J, Davidson DW, Warner P. Androgen replacement with oral testosterone undecanoate in hypogonadal men: a double blind controlled study. Clin Endocrinol (Oxf ) 1981;14:49–61. doi: 10.1111/j.1365-2265.1981.tb00364.x. [DOI] [PubMed] [Google Scholar]
- [32].Schurmeyer T, Wickings EJ, Freischem CW, Nieschlag E. Saliva and serum testosterone following oral testosterone undecanoate administration in normal and hypogonadal men. Acta Endocrinol (Copenh) 1983;102:456–62. doi: 10.1530/acta.0.1020456. [DOI] [PubMed] [Google Scholar]
- [33].Schubert M, Minnemann T, Hubler D, et al. Intramuscular testosterone undecanoate: pharmacokinetic aspects of a novel testosterone formulation during long-term treatment of men with hypogonadism. J Clin Endocrinol Metab. 2004;89:5429–34. doi: 10.1210/jc.2004-0897. [DOI] [PubMed] [Google Scholar]
- [34].Qoubaitary A, Swerdloff RS, Wang C. Advances in male hormone substitution therapy. Expert Opin Pharmacother. 2005;6:1493–506. doi: 10.1517/14656566.6.9.1493. [DOI] [PubMed] [Google Scholar]
- [35].Hsing AW, Stanczyk FZ, Belanger A, et al. Reproducibility of serum sex steroid assays in men by RIA and mass spectrometry. Cancer Epidemiol Biomarkers Prev. 2007;16:1004–8. doi: 10.1158/1055-9965.EPI-06-0792. [DOI] [PubMed] [Google Scholar]
- [36].Shah VP, Midha KK, Findlay JW, et al. Bioanalytical method validation--a revisit with a decade of progress. Pharm Res. 2000;17:1551–7. doi: 10.1023/a:1007669411738. [DOI] [PubMed] [Google Scholar]
- [37].Viswanathan CT, Bansal S, Booth B, et al. Quantitative bioanalytical methods validation and implementation: best practices for chromatographic and ligand binding assays. Pharm Res. 2007;24:1962–73. doi: 10.1007/s11095-007-9291-7. [DOI] [PubMed] [Google Scholar]


