

Abstract
Phospholamban (PLB) or the sarcoplasmic reticulum Ca2+-ATPase (SERCA) were fused to cyan fluorescent protein (CFP) and coexpressed with PLB fused to yellow fluorescent protein (YFP). The expressed fluorescently tagged proteins were imaged using epifluorescence and total internal reflection fluorescence microscopy. YFP fluorescence was selectively bleached by a focused laser beam. CFP fluorescence at the targeted site increased after YFP photobleaching, indicating fluorescence resonance energy transfer between CFP-SERCA/CFP-PLB and YFP-PLB. The increased donor fluorescence relaxed back toward baseline as a result of donor diffusion and exchange of bleached YFP-PLB for unbleached YFP-PLB, which restored fluorescence resonance energy transfer. Requenching of CFP donors, termed Förster transfer recovery (FTR), was quantified as an index of the rate of PLB subunit exchange from the PLB:SERCA and PLB:PLB membrane complexes. PLB subunit exchange from the PLB:SERCA regulatory complex was rapid, showing diffusion-limited FTR (τ=1.4 second). Conversely, PLB:PLB oligomeric complexes were found to be stable on a much longer time scale. Despite free lateral diffusion in the membrane, they showed no FTR over 80 seconds. Mutation of PLB position 40 from isoleucine to alanine (I40A-PLB) did not abolish PLB:PLB energy transfer, but destabilization of the PLB:PLB complex was apparent from an increased FTR rate (τ=8.4 seconds). Oligomers of I40A-PLB were stabilized by oxidative crosslinking of transmembrane cysteines with diamide. We conclude that PLB exchanges rapidly from its regulatory complex with the SERCA pump, whereas subunit exchange from the PLB oligomeric complex is slow and does not occur on the time scale of the cardiac cycle.
Keywords: phospholamban, SERCA, FRET, TIRF, crosslinking
The sarco(endo)plasmic reticulum calcium ATPase (SERCA) is the major ion pump responsible for sequestration of calcium into the endoplasmic or sarcoplasmic reticulum. In the heart, the activity of this ATPase is regulated by phospholamban (PLB), a 52-aa transmembrane peptide that reduces the apparent affinity of the pump for calcium.1 This inhibitory effect is relieved by high cytosolic calcium and partially relieved by phosphorylation of PLB by protein kinase A or Ca2+/calmodulin kinase II. Calcium and phosphorylation may alter the PLB:SERCA regulatory complex quaternary structure, either by complete dissociation of PLB from the pump2,3 or subtler structural changes.4-8 PLB also forms homooligomers, predominantly pentamers9 that exhibit high thermal stability10 and remain associated in detergent. Thus, multimeric forms of PLB can be detected by SDS-PAGE.11 Electron paramagnetic resonance12 and fluorescence13 analysis showed directly that PLB in a lipid bilayer is in equilibrium between monomer and oligomer (primarily pentamer) and that phosphorylation of PLB stabilizes the pentamer. The regulatory role of the pentameric form of PLB is not clear. However, shifting the pentamer/monomer ratio toward the monomer form can increase inhibition of the pump,12,14-16 and increasing SERCA/PLB ratio depolymerizes pentameric PLB.17 Taken together, these results suggest that the monomer form is the active species, and the PLB:PLB and PLB:SERCA interactions act as interdependent, balanced equilibria.
The affinity of the regulatory interaction has been estimated from fluorescence resonance energy transfer (FRET) measurements,5 NMR,18,19 and electron paramagnetic resonance.6,18 Less is known about the on/off rates of PLB subunits from the pentamer and regulatory complex, although NMR experiments provide evidence that PLB can unbind from SERCA with rapid kinetics.20 In general, observation of the binding/unbinding rates of membrane protein complexes is hampered by the slow kinetics of membrane fusion; proteins in vesicles cannot be rapidly mixed or diluted. Instead, it is necessary to observe the interactions of proteins preequilibrated in the same membrane structure.
To investigate the dynamics of exchange of PLB subunits from the binding site on SERCA and from the PLB pentamer, we used spatially resolved acceptor photobleaching to detect FRET between membrane protein binding partners. Subsequent exchange of bleached for unbleached acceptor-labeled PLB subunits was then observed as a recovery of FRET over time, a process we refer to as Förster transfer recovery (FTR). This approach may be generally useful for observing and quantifying subunit exchange of membrane protein complexes.
Materials and Methods
Molecular Biology and Cell Culture
Cyan fluorescent protein (CFP) and yellow fluorescent protein (YFP) were fused to the N terminus of PLB, and CFP was fused to the N terminus of SERCA. Recombinant plasmids were transfected into cultured AAV-293 cells by calcium phosphate precipitation. Please refer to the online data supplement, available at http://circres.ahajournals.org, for additional details.
Crosslinking and Western Blotting
Oxidative crosslinking was accomplished by exposing adhered AAV-293 cells expressing YFP-I40A-PLB to 5 mmol/L diamide for 10 minutes at room temperature. Cells were harvested with a cell scraper in lysis buffer consisting of PBS with 0.5% Triton X-100 and protease inhibitors (Complete Protease Inhibitor Cocktail, EDTA-free, Santa Cruz Biotechnology, Santa Cruz, CA). Cell lysates were subjected to vortexing and then centrifugation at 14 000 rpm for 20 minutes. Supernatant was diluted 10-fold in Laemmli buffer, heated to 40°C for 10 minutes, and subjected to electrophoresis on a 10% polyacrylamide gel. The protein was transferred to poly(vinylidene difluoride) membrane, probed with anti-PLB monoclonal primary antibody 2D12 and peroxidase-conjugated secondary antibody, and developed with diaminobenzidine color reagent.
Imaging
Fluorescence imaging was performed with an inverted microscope equipped with a 1.49 NA ×60 objective. For epifluorescence imaging, illumination was introduced through an excitation filter wheel equipped with 427/10 nm (for CFP) and 504/12 nm (for YFP) narrow band filters and a multiple band dichroic mirror. Emission was detected with a back-thinned electron-multiplying charged couple device camera (iXon 887, Andor Technology, Belfast, Northern Ireland) through an emission filter wheel, 472/30 nm (for CFP) and 542/27 nm (for YFP).
“Prismless” total internal reflection fluorescence (TIRF) used the 457.9-nm Ar laser line, directed through the objective with a multiple band dichroic mirror. TIRF emission was selected with filters described above. For spatially resolved, acceptor-selective photobleaching, the Ar laser 514.5-nm line was selected by a laser line filter and directed to the sample with a 10/90 beam splitter. The bleach beam was focused to a spot on the specimen using a Keplerian telescope composed of 2 planoconvex lenses. Laser photobleaching exposure time was controlled by a Uniblitz shutter and was typically 100 to 500 ms. Filter transitions and shutter events were automated with acquisition software to give reproducible timing. Image records from multiple experiments were averaged together for improved signal/noise ratio and to reduce intensity fluctuations caused by membrane organelle structural dynamics. Sample sizes were: CFP-SERCA, n=15; CFP-wild type (wt)PLB, n=9; CFP-I40A-PLB, n=6; CFP-I40A-PLB+diamide, n=10. Averaged postbleach images were then normalized to a prebleach image to obtain F/F0 image time series. The spatial profiles of the bleach spot in the acceptor channel and the dequenched region in the donor channel were quantified with Metamorph analysis software by measuring the fluorescence intensity along a line transecting the target region. Analysis of these “line-out” profiles from sequential images in a time-series stack was automated with a software macro. Postbleach line-outs, normalized to prebleach intensity (F/F0), were characterized by bell-shaped profiles that were well described by a Gaussian of the form:
where b is the base fluorescence outside the bleach region, hp is peak height, m is mid position (mean), and σ is the width of the Gaussian or the SD. The diffusion coefficient (D) was obtained from the rate of increase of the square of the Gaussian width (variance, σ2). FRET efficiency was calculated as E=1-(FDA/FD), where FD is the fluorescence of the donor in the absence of acceptor, estimated from the Y-intercept of a plot of CFP versus YFP fluorescence across the postbleach target area, and FDA is the donor fluorescence in the presence of acceptor, which is the prebleach donor intensity. The volume of the Gaussian profile was 2πhpσ2 and was taken to represent the total amount of bleached probe (in the case of the YFP) or the total amount of dequenched probe (brightened CFP donors with no acceptor). Analysis of the evolution of the line-out profiles was performed by fitting image data with a custom analysis program written in MatLab. Please refer to the online data supplement for additional details.
Results
Localization
Fluorescence microscopy of AAV-293 cells showed that CFP-SERCA was exclusively localized to internal membrane structures, probably the endoplasmic reticulum (ER).21,22 YFP-PLB colocalized with SERCA in the ER but was also observed at the plasma membrane (PM). Fluorescently labeled PLB in the basal PM that contacted the glass coverslip culture surface was readily detected by TIRF. In some cells, a portion of the ER was positioned very close to this basal membrane (<1 μm). In these cells, ER-localized proteins were detected by TIRF. Figure 1 (left) shows a TIRF image of CFP-SERCA, which had a reticulated distribution consistent with ER membrane ultrastructure. YFP-PLB (Figure 1, middle) colocalized with this reticulated pattern, and there was an additional YFP-PLB fraction in the basal PM, visible as a smooth, evenly fluorescent area of contact between the membrane and the glass substrate. Colocalized CFP-SERCA and YFP-PLB appeared white in an additive image overlay (Figure 1, right).
Figure 1.
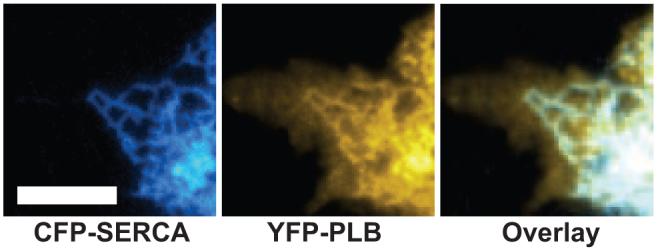
Left, TIRF microscopy of AAV-293 cells showed CFP-SERCA in the ER. Middle, YFP-PLB was localized to both the PM and ER. Right, Overlay. Areas of colocalization of CFP-SERCA and YFP-PLB appear white. Scale bar=5 μm.
The membrane being observed (PM or ER) was selected by adjusting the angle of incidence of laser excitation (θ), which determines the depth of the evanescent field.23 At extreme laser angles, TIRF illumination was highly selective for the PM, SERCA fluorescence was very dim or undetectable, and the PM fraction of YFP-PLB was selectively illuminated. At smaller angles (closer to critical angle), CFP-SERCA and YFP-PLB in the ER became apparent. This transition away from PM selectivity started to occur at a TIRF laser angle of ≈65° from normal. This value of θ corresponds to a field depth (d) of 100 nm, according to the relationship d=λ/4π(ng2sin2θ-nw2)-1/2, where λ is the wavelength of the excitation light (457.9 nm).23
The network pattern of the ER complicated quantitative analysis of TIRF images of CFP-SERCA, particularly because the ER structure was observed to be highly dynamic on the seconds time scale. Spurious intensity fluctuations arising from ER structural remodeling were circumvented by image averaging of many individual experiments. This also smoothed the reticulated fluorescence distribution into a uniform field.
Regulatory Complex Subunit Exchange
When 2 fluorescent probes are brought into close proximity (<100 Å), they can undergo fluorescence resonance energy transfer (FRET).24 FRET between CFP-SERCA and YFP-PLB was detected by acceptor-selective photobleaching. Selective photobleaching of YFP by brief exposure to a focused spot of 514-nm laser illumination (Figure 2, arrow) resulted in a local increase in CFP fluorescence at the target site. A CFP-SERCA F/F0 ratio image (postbleach/prebleach) indicated that the 20% increase in the CFP-SERCA fluorescence was restricted to the target site (Figure 2). Donor enhancement after acceptor photobleaching is diagnostic of FRET.25 Before YFP photobleaching, CFP fluorescence was quenched by FRET and then destruction of YFP relieved quenching of CFP donor. To quantify CFP-SERCA dequenching and subsequent processes, the cells were imaged with TIRF, which simplified the observation volume to an optical section of the near-basal region of the cell. A line-out across the targeted bleach region in an average (n=15) F/F0 image revealed Gaussian distributions of CFP-SERCA and YFP-PLB fluorescence in the postbleach images. The donor and acceptor Gaussians were concentric and inversely related, as shown in Figure 3A, and had similar starting variances (σ2). The base of the CFP-SERCA Gaussian (Figure 3A, blue circles) represents the fluorescence of the donor in the presence of the FRET acceptor (FDA) and was unity in F/F0 ratiometric image data. The peak of the donor Gaussian indicated that the average enhancement of CFP-SERCA donor fluorescence at the first postbleach time point (2.5 seconds postbleach) was 8%. The average efficiency of energy transfer from CFP-SERCA to YFP-PLB was estimated from the Y-intercept of a linear regression of a plot of CFP F/F0 versus YFP F/F0 (Figure 3B), which was taken to represent donor fluorescence in the absence of acceptor (FD). FRET efficiency was 13%, according to the relationship E=1-(FDA/FD). The profile YFP-PLB fluorescence at 2.5 seconds postbleach exhibited a minimum of 45% of initial fluorescence (Figure 3A, green triangles). Figure 3C shows the evolution of the donor (blue circles) and acceptor (green triangles) fluorescence signals. After photobleaching, the acceptor fluorescence in the bleach spot exhibited fluorescence recovery after photobleaching (FRAP), indicating lateral mobility of the YFP-PLB in the membrane (Figure 3C, green triangles). Concomitant with FRAP in the acceptor channel, the fluorescence of CFP-SERCA, which was dequenched by the photobleaching of its FRET partner, relaxed toward baseline (Figure 3C, blue circles). This exponential relaxation of donor fluorescence may be attributed to 2 distinct processes: (1) lateral diffusion of dequenched CFP-SERCA out of the region of interest; and (2) subunit exchange of PLB from PLB:SERCA regulatory complexes, which restores energy transfer (FTR). Line-out Gaussian analysis through the image time series showed that the YFP-PLB bleach spot profile evolved with respect to fit parameter σ2 (variance) as a result of lateral diffusion of YFP-PLB in the membrane. As expected for simple diffusion, the variance increased linearly over time (not shown). Linear regression of the σ2 evolution gave a diffusion coefficient of 0.4 μm2/sec for PM-localized YFP-PLB. Because the intensity of acceptors did not change once photobleaching was completed, the volume of the Gaussian profile was stable over the course of the experiment (data not shown).
Figure 2.
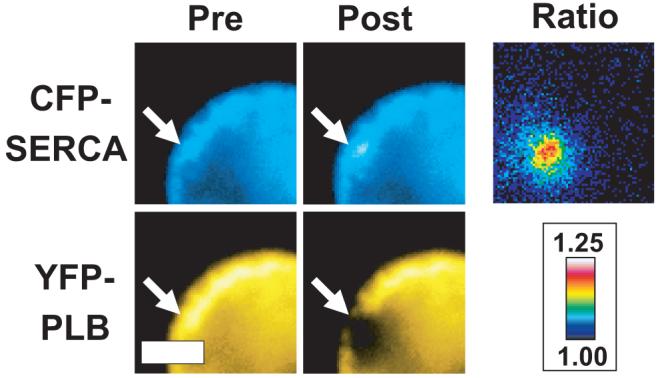
Left, Pre- and postbleach epifluorescence images of CFP-SERCA and YFP-PLB expressed in AAV-293 cells. Laser spot photobleaching (514 nm) selectively ablated YFP at the target site (arrows), abolishing CFP-YFP energy transfer and increasing CFP fluorescence. Right, Ratio image (CFP-SERCA postbleach/prebleach) showing a spatially resolved 20% increase in CFP fluorescence after YFP photobleaching. Scale bar=μm.
Figure 3.
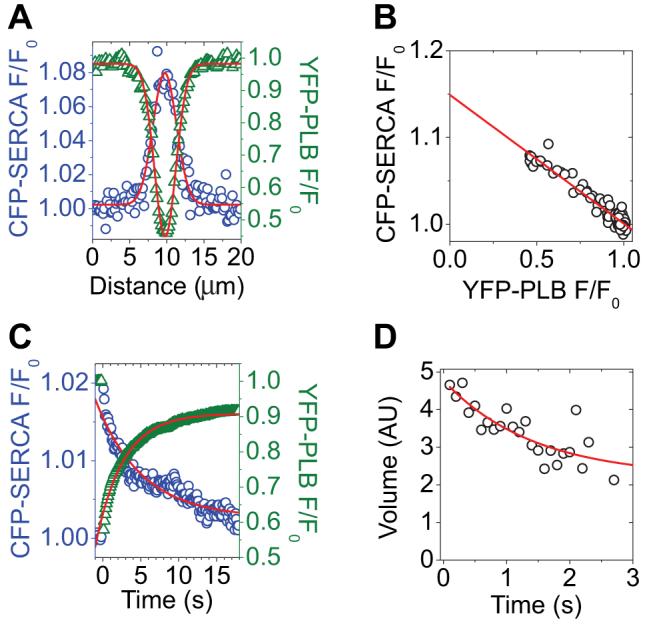
A, Profiles of CFP-SERCA (blue circles) and YFP-PLB (green triangles) fluorescence at 2.5 seconds after YFP-selective laser spot photobleaching. The data are well described by Gaussian fits. B, As in A, plotted to show the relationship between CFP-SERCA and YFP-PLB fluorescence across the target region. The y-intercept indicates 13% energy transfer. C, Average YFP-PLB fluorescence (green triangles) decreased after acceptor-selective laser spot photobleaching and then recovered. CFP-SERCA fluorescence (blue circles) increased after acceptor photobleaching and then relaxed exponentially. D, FTR indicates regulatory complex subunit exchange with a time constant of 1.4 seconds. AU indicates arbitrary units.
The dequenched spot in the donor channel showed typical time evolution of σ2 via lateral diffusion (data not shown), but there was an exponential decrease (τ=1.4 second) in the volume of the donor Gaussian (Figure 3D). The volume change indicates a decrease in the intrinsic intensity of the donors during the postbleach time course. This may be attributed to FTR resulting from exchange of bleached for unbleached YFP-PLB from PLB:SERCA complexes.
PLB Pentamer Subunit Exchange
Because of the PM localization of a fraction of PLB expressed in AAV-293 cells, CFP/YFP fusions of PLB could be observed with high signal/noise using TIRF illumination. Spot photobleaching of YFP-PLB resulted in enhanced fluorescence of the CFP-PLB donor, indicating intrapentameric FRET. The peak of the donor Gaussian (Figure 4A, blue circles) obtained from the average (n=9) F/F0 image showed that the enhancement of CFP-wtPLB fluorescence at the 2.5 second time point was 45%. The YFP-PLB bleach spot profile showed a minimum of 60% of initial fluorescence (Figure 4A, green triangles). The average efficiency of energy transfer from CFP-wtPLB to YFP-wtPLB was 54%, as obtained from the y-intercept of a linear regression of a plot of CFP F/F0 versus YFP F/F0 (Figure 4B), as described above. Figure 4C shows the evolution of the donor (blue circles) and acceptor (green triangles) fluorescence signals. As in the experiments with the regulatory complex, the fluorescently labeled PLB was laterally mobile in the membrane. YFP-PLB fluorescence in the target region recovered from spot photobleaching (Figure 4C, green triangles). The enhanced fluorescence of CFP-PLB in the region of interest also relaxed exponentially (Figure 4C, blue circles). Notably, this donor fluorescence relaxation was entirely attributable to diffusion of dequenched donors out of the target region. Line-out Gaussian analysis through the average (n=9) image time series showed that the volume of the dequenched donor fluorescence distribution remained high for wild-type CFP-PLB over the course of 80 seconds (Figure 4D, black circles), indicating PLB oligomers were stable on this time scale. Mutation of PLB position 40 from isoleucine to alanine (I40A) did not abolish FRET but destabilized the oligomeric complex enough to observe subunit exchange of I40A-PLB as an exponential decrease (τ=8.4 seconds) in the average (n=6) image line-out Gaussian volume (Figure 4,D, red triangles). Exposure of cells expressing fluorescently labeled I40A-PLB to 5mmol/L diamide oxidative cross-linker for 10 minutes increased I40A oligomer stability. Like wtPLB, cross-linked I40A-PLB average (n=10) image line-out Gaussian volume remained high over 80 seconds (Figure 4D, blue squares). The increased stability with diamide was also observed by SDS-PAGE. Figure 5 shows a Western blot probed with anti-PLB antibody 2D12. The YFP fusion of wtPLB (Figure 5, lane 1) shows bands corresponding to pentamer (“P”), monomer (“M”), and intermediate oligomeric species. The band indicated by an asterisk is a nonspecific cross-reactive species present in homogenates of untransfected cells (lane 7). I40A-PLB runs as a monomer (Figure 5, lane 2), but incubation of cultures in 5 mmol/L diamide for 10 minutes converted this species to an indistinct high-molecular-weight band with a mobility similar to pentameric YFP-wtPLB (Figure 5, lane 3). This effect was likely mediated by oxidative crosslinking of cysteine residues in the PLB transmembrane region, because a Cys-null mutant of PLB (AFA), which runs as a monomer (Figure 5, lane 5), did not show crosslinking with diamide (Figure 5, lane 6). Crosslinking of I40A was not fully reversible, but oligomers were partially restored to monomers on the gel by 5 mmol/L mercaptoethanol (Figure 5, lane 4).
Figure 4.
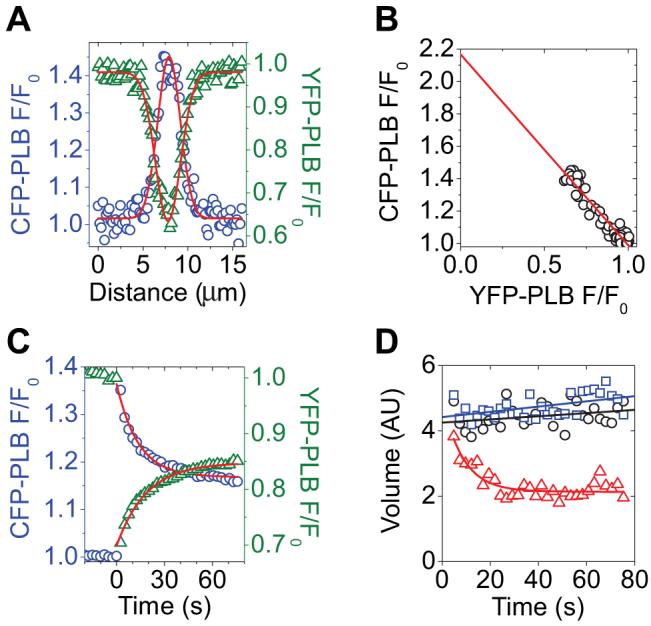
A, Spatial profiles of CFP-PLB (blue circles) and YFP-PLB (green triangles) fluorescence at 2.5 seconds after YFP-selective laser spot photobleaching. The data are well described by Gaussian fits. B, As in A, plotted to show the relationship between CFP-PLB and YFP-PLB fluorescence across the target region. Y-intercept indicates 54% energy transfer. C, Average YFP-PLB fluorescence (green triangles) decreased after acceptor-selective laser spot photobleaching and then recovered. CFP-PLB fluorescence (blue circles) increased after acceptor photobleaching, then relaxed exponentially. D, Wild-type PLB (black circles) line-out Gaussian volume remained high over 80 seconds, indicating that the wtPLB pentamer did not undergo subunit exchange. PLB mutation I40A did not abolish FRET but decreased oligomeric stability, resulting in subunit exchange with a time constant of 8.4 seconds (red triangles). I40A oligomer stability was restored by crosslinking with diamide (blue squares). AU indicates arbitrary units.
Figure 5.
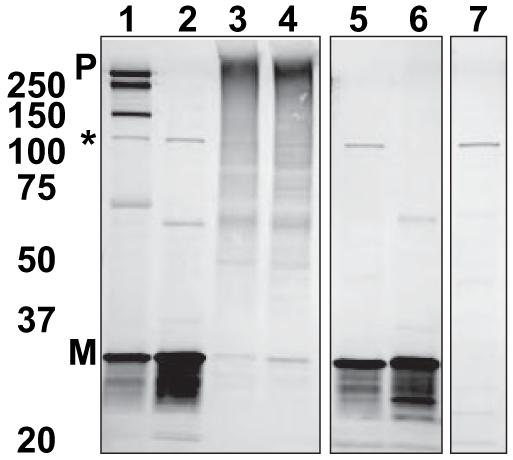
Immunoblot of YFP fusions of PLB variants probed with anti-PLB monoclonal antibody 2D12 showing pentamer (P) and monomer (M) forms. Lanes from left are: wtPLB (1), oligomer-destabilized PLB (I40A-PLB) (2), I40A+diamide (3), I40A-PLB +Diamide +βME (4), Cys-null PLB (AFA-PLB) (5), AFA-PLB+diamide (6), and untransfected AAV-293 cell homogenate control (7). The intermediate-sized band (*) present in all samples is a non-PLB cross-reaction.
The spot photobleaching results are summarized in Figure 6, which shows donor F/F0 images, color encoded with the same look-up table that is shown in Figure 2. The look-up tables for Figure 6 were scaled from F/F0 values of 1.0 to 1.15 (for CFP-SERCA) or from 1.0 to 1.5 (for CFP-wt/I40A-PLB). The F/F0 values of the target regions for SERCA and I40A-PLB donor decreased visibly within 40 seconds of acceptor photobleaching, but wtPLB and I40A-PLB pentamers crosslinked with diamide persisted, with little subunit exchange over the observation time.
Figure 6.
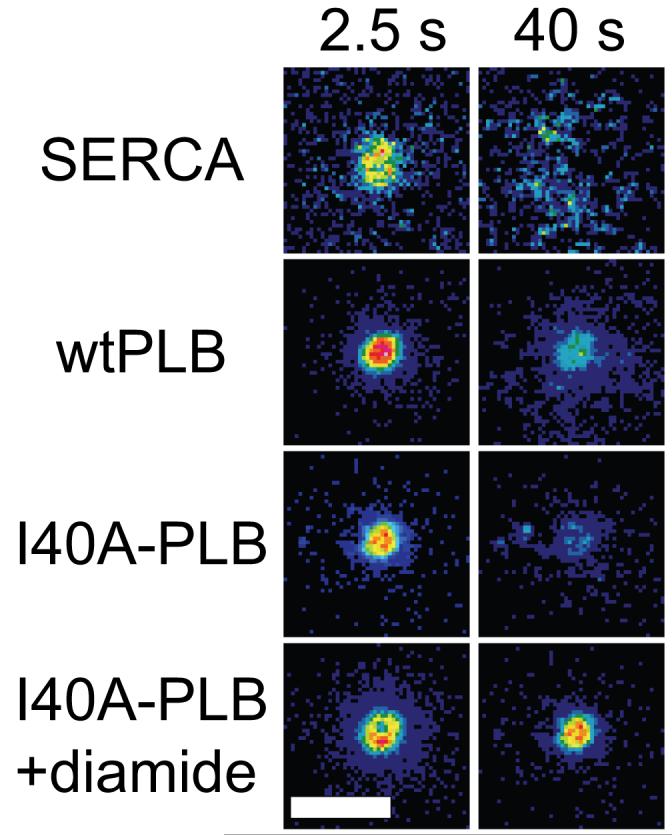
F/F0 ratio images of CFP fusion proteins after YFP-selective spot photobleaching. Scale bar=10 μm.
Discussion
Förster Transfer Recovery
The rapid mixing techniques that have proven so useful for protein-protein binding kinetics are difficult to apply to membrane proteins. Separately prepared proteins in vesicles do not encounter one another until their respective vesicles fuse, and once they are trapped in the same membrane structure, they cannot be rapidly diluted. The FTR experiments described here provide a general approach to quantifying membrane protein-protein binding dynamics. By observing the relaxation of a perturbed FRET pair, one gains access to the binding and unbinding of proteins from complexes at equilibrium. Because both the detection (imaging) and perturbation (photobleaching) are optical methods, these experiments can be performed in living cells. For FTR experiments in which the donor-labeled protein is a diffusible species, it is important to account for both the donor brightness and spatial distribution, because diffusion can also result in donor-intensity relaxation in the area of interest. In the present study, our approach was to explicitly measure the intensity and distribution of fluorophores in the target area, but other solutions can be envisioned for the quantification of FTR. For the current experiments, FTR time resolution is limited to a window of seconds to hundreds of seconds. The theoretical rapid limit of this technique is determined by the minimum diffusion time of a diffraction-limited spot, ie, 100 ms for a 200-nm spot. However, a practical limitation is the decrease in signal/noise ratio with decreasing spot size, because of both fewer fluorophores observed and the shorter camera integration times required for faster diffusion/exchange processes. The slow limit is set by the time of equilibration of diffusible membrane probes in the area of contact between the membrane and the glass substrate on the basal surface of a cultured cell, which has an area on the order of 500 μm2. Longer time regimes would be accessible for proteins reconstituted into planar lipid bilayers.26 Such reconstituted systems would also give control of protein concentration, permitting explicit determination of on and off rate constants.27
The partial recovery of YFP-PLB fluorescence shown in Figure 3C and Figure 4C is typical; we have never observed YFP fluorescence return to baseline (ie, 100% FRAP), even with soluble, cytosolic YFP (not shown). This is commonly reported in the literature and is usually attributed to an “immobile fraction” of poorly diffusible species. In our experiments, a more significant factor is depletion of the total cell brightness by the photobleaching of a fraction of the fluorescent species. Neither the fractional bleaching of YFP nor its fractional recovery affects the present study, because the analysis is directed at the time dependence of these transients rather than their absolute magnitude.
In our experiments, the FTR method was complimented by TIRF microscopy, which selectively illuminated cells cultured on glass cover slides to a depth of ≈100 nm. This method was suitable for imaging CFP-SERCA and YFP-PLB in the PM-adjacent portions of the ER and was particularly effective for detecting PLB in the PM. The PM pool of PLB may be mislocalized “spillover” resulting from overexpression. It is also possible that PLB has undiscovered regulatory targets in the PM. A recent report postulated a developmental role for PM-localized PLB.28
PLB Subunit Exchange
Based on observed differential rates of FTR, we propose that PLB exchanges rapidly from its binding site on SERCA but slowly from PLB pentamers. This kinetic model is summarized in Figure 7, which represents PLB monomers (PLB1) binding and unbinding from the pentamer (PLB5) and the regulatory complex (PLB:SERCA) with different exchange rates. The PLB:SERCA regulatory interaction has been described previously as dynamic, although usually in the context of a putative binding/unbinding of PLB en masse from the population of pumps in response to calcium binding to the pump and PLB phosphorylation.2,3,29 The present experiments focus on the exchange kinetics of PLB in heterologous cells at rest, in the absence of Ca2+ oscillations or stimulated kinase activity. However, the pump is never static, even during diastole. At a “resting” calcium concentration of 100 nmol/L, calcium forward and reverse fluxes balance at ≈21 μmol/L/s.30 With a pump concentration of 15 to 100 μmol/L,31,32 this implies that the entire pump population undergoes E1-E2 structural transitions every few seconds. This is compatible with the kinetics of SERCA PLB exchange observed by FTR. This study provides direct evidence for a rapidly dynamic interaction in unstimulated heterologous cells in which the cytosolic calcium is below the threshold of pump activation.33 Using FTR, we have established an upper limit of 1.4 seconds for the time constant of the binding/unbinding of PLB to/from SERCA. Thus, rather than being a static structure, the regulatory complex may be regarded as the steady-state result of continual binding and unbinding of PLB from its target. The perpetual dynamics of this interaction may contribute to the difficulty in obtaining PLB-SERCA cocrystals suitable for x-ray diffraction studies.
Figure 7.
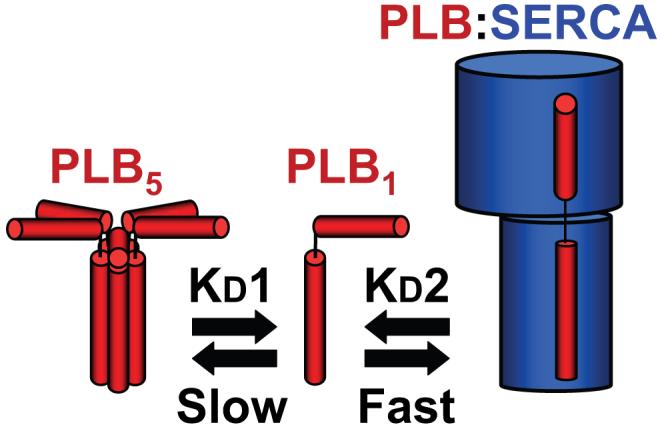
Model of PLB subunit (PLB1) exchange from pentamers (PLB5) and the regulatory complex (PLB:SERCA). PLB associates rapidly with the SERCA pump and exchanges within seconds from the regulatory binding site. PLB exchange from pentamers is much slower, and oligomeric interactions are stable over many tens of seconds.
Furthermore, the present data do not necessarily conflict with studies that describe an avid PLB-SERCA interaction that is not abolished by calcium or phosphorylation.4-8 An interaction that is high affinity (KD<protein concentration) can still support rapid binding/unbinding. The equilibria and the kinetics are related as follows: dissociation constant=koff/kon and exchange rate=koff+kon. This means the same equilibrium could be achieved with fast kinetics or slow kinetics. In a simplified example, [koff/kon=1/2] and [koff/kon=10/20] both yield the same dissociation constant (they have the same affinity) but give different exchange rates of 3 and 30, respectively. Both PLB and SERCA are present in large amounts in the SR membrane32,34-36 at concentrations that greatly exceed the dissociation constant,5 resulting in a large proportion of pumps being bound to PLB in the steady state. In general, a reversible interaction (with a large off rate), compensated by high ligand concentration, is characteristic of a rapidly responsive system.
It is remarkable, then, that PLB pentamers are stable on the minutes time scale. This indicates that monomers (the active species) cannot exchange from PLB complexes (the inactive pool) during the 1-second time scale of the cardiac cycle. The monomer/pentamer ratio is not expected to follow putative fluctuations of PLB-SERCA binding and would integrate the time-averaged concentration of free monomer into the monomer-pentamer equilibrium. It is possible that the equilibrium is regulated over a longer period by sustained signals, such as phosphorylation.12 The kinetics of PLB oligomerization is significantly altered by mutation of the isoleucine at position 40 to alanine. This mutant has been described as a “monomeric” PLB, because, unlike wtPLB, it runs as a monomer on SDS-polyacrylamide gels.37,38 However, the present FRET results indicate that the I40A mutant is still able to form oligomers. This is consistent with the observations of Stokes et al, who detected pentamers of I40A-PLB by electron microscopy of 2D crystals.39 Similarly, the Cys-null mutant Ala-PLB has been shown to form oligomers in DMPC bilayers.40 Cornea et al showed that several weakly pentameric PLB mutants are progressively dissociated by increasing concentrations of SDS.41 Together with the present study, these reports underscore the importance of measuring membrane protein-protein interactions in the membrane environment. Detergents used to solubilize membrane proteins for coimmunoprecipitation or SDS-PAGE experiments may disrupt physiologically important interactions.
The rapid FTR observed for I40A (Figure 4) suggests that these complexes exhibit much faster subunit exchange kinetics compared with wtPLB. If both bind with a diffusion-controlled on rate, then the pentamer-to-monomer off rate must be increased for I40A. Importantly, crosslinking of I40A-PLB transmembrane cysteines by diamide stabilizes the complex and prevents FTR. This demonstrates that the FRET signal arises from protein-protein interactions, rather than nonspecific energy transfer between highly concentrated donors and acceptors.42,43 Furthermore, it shows that oxidation is an important determinant of I40A-PLB oligomerization. Wild-type PLB is also subject to cysteine oxidation; presumably crosslinking would further stabilize the wtPLB pentamer. This may be an important mechanism in conditions of oxidative stress, such as myocardial ischemia.
Acknowledgments
We thank E. Howard, J.M. Autry, R. Cornea, and D.M. Bers for helpful discussions and J. Bossouyt for technical assistance. AAV-293 cells were a gift from J. Martin. Fluorescent protein vectors were a gift from D.M. Bers and J.W. Walker.
Sources of Funding
This work was supported by American Heart Association Scientist Development Grant 0630147N (to S.L.R.), NIH Mentored Research Scientist Development award EB006061 (to S.L.R.), American Heart Association Scientist Development Grant 0630079N (to K.S.C), American Heart Association Predoctoral Fellowship 0410093Z (to D.L.W.), and NIH grant GM27906 (to D.D.T.).
Footnotes
Disclosures
None.
References
- 1.MacLennan DH, Kranias EG. Phospholamban: a crucial regulator of cardiac contractility. Nat Rev Mol Cell Biol. 2003;4:566–577. doi: 10.1038/nrm1151. [DOI] [PubMed] [Google Scholar]
- 2.Asahi M, McKenna E, Kurzydlowski K, Tada M, MacLennan DH. Physical interactions between phospholamban and sarco(endo)plasmic reticulum Ca2+-ATPases are dissociated by elevated Ca2+, but not by phospholamban phosphorylation, vanadate, or thapsigargin, and are enhanced by ATP. J Biol Chem. 2000;275:15034–15038. doi: 10.1074/jbc.275.20.15034. [DOI] [PubMed] [Google Scholar]
- 3.Chen Z, Akin BL, Stokes DL, Jones LR. Cross-linking of C-terminal residues of phospholamban to the Ca2+ pump of cardiac sarcoplasmic reticulum to probe spatial and functional interactions within the transmembrane domain. J Biol Chem. 2006;281:14163–14172. doi: 10.1074/jbc.M601338200. [DOI] [PubMed] [Google Scholar]
- 4.Li J, Bigelow DJ, Squier TC. Conformational changes within the cytosolic portion of phospholamban upon release of Ca-ATPase inhibition. Biochemistry. 2004;43:3870–3879. doi: 10.1021/bi036183u. [DOI] [PubMed] [Google Scholar]
- 5.Mueller B, Karim CB, Negrashov IV, Kutchai H, Thomas DD. Direct detection of phospholamban and sarcoplasmic reticulum Ca-ATPase interaction in membranes using fluorescence resonance energy transfer. Biochemistry. 2004;43:8754–8765. doi: 10.1021/bi049732k. [DOI] [PubMed] [Google Scholar]
- 6.Karim CB, Zhang Z, Howard EC, Torgersen KD, Thomas DD. Phosphorylation-dependent conformational switch in spin-labeled phospholamban bound to SERCA. J Mol Biol. 2006;358:1032–1040. doi: 10.1016/j.jmb.2006.02.051. [DOI] [PubMed] [Google Scholar]
- 7.Negash S, Yao Q, Sun H, Li J, Bigelow DJ, Squier TC. Phospholamban remains associated with the Ca2+- and Mg2+-dependent ATPase following phosphorylation by cAMP-dependent protein kinase. Biochem J. 2000;351:195–205. doi: 10.1042/0264-6021:3510195. [DOI] [PMC free article] [PubMed] [Google Scholar]
- 8.Waggoner JR, Huffman J, Froehlich JP, Mahaney JE. Phospholamban inhibits Ca-ATPase conformational changes involving the E2 intermediate. Biochemistry. 2007;46:1999–2009. doi: 10.1021/bi061365k. [DOI] [PubMed] [Google Scholar]
- 9.Simmerman HK, Collins JH, Theibert JL, Wegener AD, Jones LR. Sequence analysis of phospholamban. Identification of phosphorylation sites and two major structural domains. J Biol Chem. 1986;261:13333–13341. [PubMed] [Google Scholar]
- 10.Robia SL, Flohr NC, Thomas DD. Phospholamban pentamer quaternary conformation determined by in-gel fluorescence anisotropy. Biochemistry. 2005;44:4302–4311. doi: 10.1021/bi0478446. [DOI] [PubMed] [Google Scholar]
- 11.Jones LR, Simmerman HK, Wilson WW, Gurd FR, Wegener AD. Purification and characterization of phospholamban from canine cardiac sarcoplasmic reticulum. J Biol Chem. 1985;260:7721–7730. [PubMed] [Google Scholar]
- 12.Cornea RL, Jones LR, Autry JM, Thomas DD. Mutation and phosphorylation change the oligomeric structure of phospholamban in lipid bilayers. Biochemistry. 1997;36:2960–2967. doi: 10.1021/bi961955q. [DOI] [PubMed] [Google Scholar]
- 13.Li M, Reddy LG, Bennett R, Silva ND, Jr, Jones LR, Thomas DD. A fluorescence energy transfer method for analyzing protein oligomeric structure: application to phospholamban. Biophys J. 1999;76:2587–2599. doi: 10.1016/S0006-3495(99)77411-4. [DOI] [PMC free article] [PubMed] [Google Scholar]
- 14.Autry JM, Jones LR. Functional co-expression of the canine cardiac Ca2+ pump and phospholamban in Spodoptera frugiperda (Sf21) cells reveals new insights on ATPase regulation. J Biol Chem. 1997;272:15872–15880. doi: 10.1074/jbc.272.25.15872. [DOI] [PubMed] [Google Scholar]
- 15.Kimura Y, Kurzydlowski K, Tada M, MacLennan DH. Phospholamban inhibitory function is activated by depolymerization. J Biol Chem. 1997;272:15061–15064. doi: 10.1074/jbc.272.24.15061. [DOI] [PubMed] [Google Scholar]
- 16.Zhai J, Schmidt AG, Hoit BD, Kimura Y, MacLennan DH, Kranias EG. Cardiac-specific overexpression of a superinhibitory pentameric phospholamban mutant enhances inhibition of cardiac function in vivo. J Biol Chem. 2000;275:10538–10544. doi: 10.1074/jbc.275.14.10538. [DOI] [PubMed] [Google Scholar]
- 17.Reddy LG, Jones LR, Thomas DD. Depolymerization of phospholamban in the presence of calcium pump: a fluorescence energy transfer study. Biochemistry. 1999;38:3954–3962. doi: 10.1021/bi981795d. [DOI] [PubMed] [Google Scholar]
- 18.Zamoon J, Nitu F, Karim C, Thomas DD, Veglia G. Mapping the interaction surface of a membrane protein: unveiling the conformational switch of phospholamban in calcium pump regulation. Proc Natl Acad Sci U S A. 2005;102:4747–4752. doi: 10.1073/pnas.0406039102. [DOI] [PMC free article] [PubMed] [Google Scholar]
- 19.Traaseth NJ, Thomas DD, Veglia G. Effects of Ser16 phosphorylation on the allosteric transitions of phospholamban/Ca(2+)-ATPase complex. J Mol Biol. 2006;358:1041–1050. doi: 10.1016/j.jmb.2006.02.047. [DOI] [PubMed] [Google Scholar]
- 20.Hughes E, Middleton DA. Solid-state NMR measurements of the kinetics of the interaction between phospholamban and Ca2+-ATPase in lipid bilayers. Mol Membr Biol. 2005;22:353–361. doi: 10.1080/09687860500175243. [DOI] [PubMed] [Google Scholar]
- 21.Haghighi K, Kolokathis F, Pater L, Lynch RA, Asahi M, Gramolini AO, Fan GC, Tsiapras D, Hahn HS, Adamopoulos S, Liggett SB, Dorn GW, 2nd, MacLennan DH, Kremastinos DT, Kranias EG. Human phospholamban null results in lethal dilated cardiomyopathy revealing a critical difference between mouse and human. J Clin Invest. 2003;111:869–876. doi: 10.1172/JCI17892. [DOI] [PMC free article] [PubMed] [Google Scholar]
- 22.Vafiadaki E, Sanoudou D, Arvanitis DA, Catino DH, Kranias EG, Kontrogianni-Konstantopoulos A. Phospholamban interacts with HAX-1, a mitochondrial protein with anti-apoptotic function. J Mol Biol. 2007;367:65–79. doi: 10.1016/j.jmb.2006.10.057. [DOI] [PubMed] [Google Scholar]
- 23.Axelrod D. Total internal reflection fluorescence microscopy in cell biology. Methods Enzymol. 2003;361:1–33. doi: 10.1016/s0076-6879(03)61003-7. [DOI] [PubMed] [Google Scholar]
- 24.Förster T. Intermolecular energy migration and fluorescence. Ann Phys (Leipzig) 1948;2:55–75. [Google Scholar]
- 25.Kenworthy AK. Imaging protein-protein interactions using fluorescence resonance energy transfer microscopy. Methods. 2001;24:289–296. doi: 10.1006/meth.2001.1189. [DOI] [PubMed] [Google Scholar]
- 26.Li E, Hristova K. Imaging forster resonance energy transfer measurements of transmembrane helix interactions in lipid bilayers on a solid support. Langmuir. 2004;20:9053–9060. doi: 10.1021/la048676l. [DOI] [PubMed] [Google Scholar]
- 27.Robia SL, Ghanta J, Robu VG, Walker JW. Localization and kinetics of protein kinase C-epsilon anchoring in cardiac myocytes. Biophys J. 2001;80:2140–2151. doi: 10.1016/S0006-3495(01)76187-5. [DOI] [PMC free article] [PubMed] [Google Scholar]
- 28.Stenoien DL, Knyushko TV, Londono MP, Opresko LK, Mayer MU, Brady ST, Squier TC, Bigelow DJ. Cellular trafficking of phospholamban and formation of functional sarcoplasmic reticulum during myocyte differentiation. Am J Physiol Cell Physiol. 2007;292:C2084–C2094. doi: 10.1152/ajpcell.00523.2006. [DOI] [PubMed] [Google Scholar]
- 29.Chen Z, Akin BL, Jones LR. Mechanism of reversal of phospholamban inhibition of the cardiac Ca2+-ATPase by protein kinase A and by anti-phospholamban monoclonal antibody 2D12. J Biol Chem. 2007;282:20968–20976. doi: 10.1074/jbc.M703516200. [DOI] [PubMed] [Google Scholar]
- 30.Bers DM. Excitation-Contraction Coupling and Cardiac Contractile Force. 2nd ed. Kluwer Academic Publishers; Boston: 2001. [Google Scholar]
- 31.Hove-Madsen L, Bers DM. Sarcoplasmic reticulum Ca2+ uptake and thapsigargin sensitivity in permeabilized rabbit and rat ventricular myocytes. Circ Res. 1993;73:820–828. doi: 10.1161/01.res.73.5.820. [DOI] [PubMed] [Google Scholar]
- 32.Levitsky DO, Benevolensky DS, Levchenko TS, Smirnov VN, Chazov EI. Calcium-binding rate and capacity of cardiac sarcoplasmic reticulum. J Mol Cell Cardiol. 1981;13:785–796. doi: 10.1016/0022-2828(81)90236-4. [DOI] [PubMed] [Google Scholar]
- 33.Estacion M, Sinkins WG, Jones SW, Applegate MA, Schilling WP. Human TRPC6 expressed in HEK 293 cells forms non-selective cation channels with limited Ca2+ permeability. J Physiol. 2006;572(pt 2):359–377. doi: 10.1113/jphysiol.2005.103143. [DOI] [PMC free article] [PubMed] [Google Scholar]
- 34.Feher JJ, Briggs FN. The effect of calcium load on the calcium permeability of sarcoplasmic reticulum. J Biol Chem. 1982;257:10191–10199. [PubMed] [Google Scholar]
- 35.Louis CF, Turnquist J, Jarvis B. Phospholamban stoichiometry in canine cardiac muscle sarcoplasmic reticulum. Neurochem Res. 1987;12:937–941. doi: 10.1007/BF00966316. [DOI] [PubMed] [Google Scholar]
- 36.Tada M, Inui M, Yamada M, Kadoma M, Kuzuya T, Abe H, Kakiuchi S. Effects of phospholamban phosphorylation catalyzed by adenosine 3′:5′-monophosphate- and calmodulin-dependent protein kinases on calcium transport ATPase of cardiac sarcoplasmic reticulum. J Mol Cell Cardiol. 1983;15:335–346. doi: 10.1016/0022-2828(83)91345-7. [DOI] [PubMed] [Google Scholar]
- 37.Fujii J, Maruyama K, Tada M, MacLennan DH. Expression and site-specific mutagenesis of phospholamban. Studies of residues involved in phosphorylation and pentamer formation. J Biol Chem. 1989;264:12950–12955. [PubMed] [Google Scholar]
- 38.Simmerman HK, Kobayashi YM, Autry JM, Jones LR. A leucine zipper stabilizes the pentameric membrane domain of phospholamban and forms a coiled-coil pore structure. J Biol Chem. 1996;271:5941–5946. doi: 10.1074/jbc.271.10.5941. [DOI] [PubMed] [Google Scholar]
- 39.Stokes DL, Pomfret AJ, Rice WJ, Glaves JP, Young HS. Interactions between Ca2+-ATPase and the pentameric form of phospholamban in two-dimensional co-crystals. Biophys J. 2006;90:4213–4223. doi: 10.1529/biophysj.105.079640. [DOI] [PMC free article] [PubMed] [Google Scholar]
- 40.Hughes E, Clayton JC, Middleton DA. Probing the oligomeric state of phospholamban variants in phospholipid bilayers from solid-state NMR measurements of rotational diffusion rates. Biochemistry. 2005;44:4055–4066. doi: 10.1021/bi0482351. [DOI] [PubMed] [Google Scholar]
- 41.Cornea RL, Autry JM, Chen Z, Jones LR. Reexamination of the role of the leucine/isoleucine zipper residues of phospholamban in inhibition of the Ca2+ pump of cardiac sarcoplasmic reticulum. J Biol Chem. 2000;275:41487–41494. doi: 10.1074/jbc.M008195200. [DOI] [PubMed] [Google Scholar]
- 42.Fung BK, Stryer L. Surface density determination in membranes by fluorescence energy transfer. Biochemistry. 1978;17:5241–5248. doi: 10.1021/bi00617a025. [DOI] [PubMed] [Google Scholar]
- 43.Vogel SS, Thaler C, Koushik SV. Fanciful FRET. Sci STKE. 2006;2006:re2. doi: 10.1126/stke.3312006re2. [DOI] [PubMed] [Google Scholar]