Abstract
We report the synthesis, properties, and cellular application of Naphtho-Peroxyfluor-1 (NPF1), a new fluorescent indicator for hydrogen peroxide based on a red-emitting naphthofluorescein platform. Owing to its boronate cages, NPF1 features high selectivity for hydrogen peroxide over a panel of biologically relevant reactive oxygen species (ROS), including superoxide and nitric oxide, as well as excitation and emission profiles in the far-red region of the visible spectrum (>600 nm). Flow cytometry experiments in RAW264.7 macrophages establish that NPF1 can report changes in peroxide levels in living cells.
The chemistry and biology of hydrogen peroxide (H2O2) is of current interest owing to its dual roles as a canonical marker for oxidative stress and as a newly recognized mediator for cellular signaling.1–7 Because the dynamic production, accumulation, and clearance of H2O2 in living systems can have disparate physiological and/or pathological consequences, new methodologies that allow selective and sensitive detection of this reactive oxygen metabolite in biological settings offer promise for helping to elucidate the complex contributions of peroxide to health, aging, and disease. Optical imaging with H2O2-responsive emissive probes offers an attractive approach to this goal, and several systems for H2O2 visualization in biological samples have been reported recently, including those using small molecule,8–17 protein,18,19 and nanoparticle20 reporters. In this context, luminescent indicators that possess excitation and emission profiles in the visible far-red to near-infrared region of the electromagnetic spectrum are highly desirable owing to reduced background interference from endogenous cellular components in this energy range, resulting in enhanced optical transparency of tissue and the ability to interrogate thicker specimens. In this report, we present the synthesis, spectroscopy, and live-cell evaluation of Naphtho-Peroxyfluor-1 (NPF1), a new small-molecule fluorescent probe for hydrogen peroxide based on a red-emitting naphthofluorescein dye platform. NPF1 utilizes a caged boronate switch to provide specific detection of H2O2 over competing reactive oxygen species (ROS), including superoxide, nitric oxide, and hydroxyl radical, and excitation and emission profiles in the visible far-red region (>600 nm). We further show that the red-emitting indicator is capable of reporting changes in H2O2 levels in living cells by flow cytometry.
Scheme 1 summarizes the design, synthesis, and activation of NPF1. Previous work from our laboratory established that the chemoselective conversion of aryl boronates to phenols provides a reaction-based approach to specific detection of H2O2 over other ROS.12–17 To extend this strategy to a system that possesses lower energy absorption/emission profiles, we turned our attention to fluorescein derivatives with extended naphthalene conjugation.21–25 In particular, we reasoned that appending boronates to the 4’ and 9’ positions of a naphthalene-expanded xanthenone scaffold would force this platform to adopt a closed, colorless, and non-fluorescent lactone form and furnish a caged, red-emitting naphthofluorescein compound that could be unmasked in the presence of H2O2. Related sulfonate- and phosphinate-capped naphthofluorescein have been reported for fluorescence detection of peroxide11 and superoxide,26 respectively. NPF1 is readily obtained in two steps from naphthofluorescein according to Scheme 1.
Scheme 1.
Synthesis and activation of Naphtho-Peroxyfluor-1 (NPF1). Reagents and conditions: (i) N-phenyl-bis(trifluoromethanesulfonimide), DIPEA, DMF, 25 °C, 24 h. (ii) Pd(dppf)Cl2•CH2Cl2, dppf, bis(pinacolato)diboron, KOAc, 1,4-dioxane, 100 °C, 24 h.
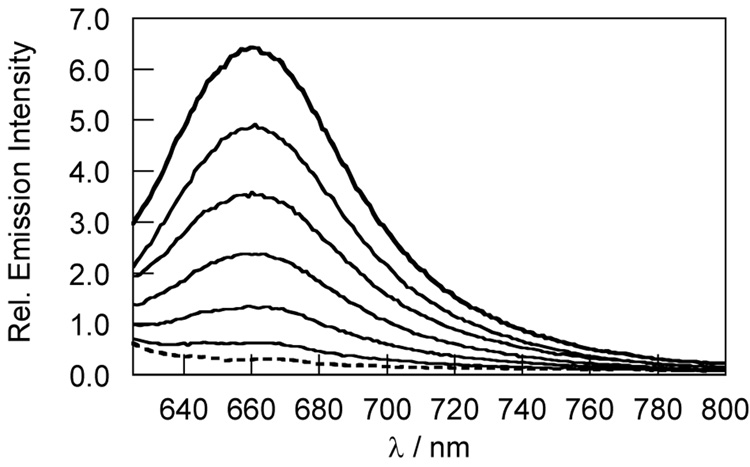
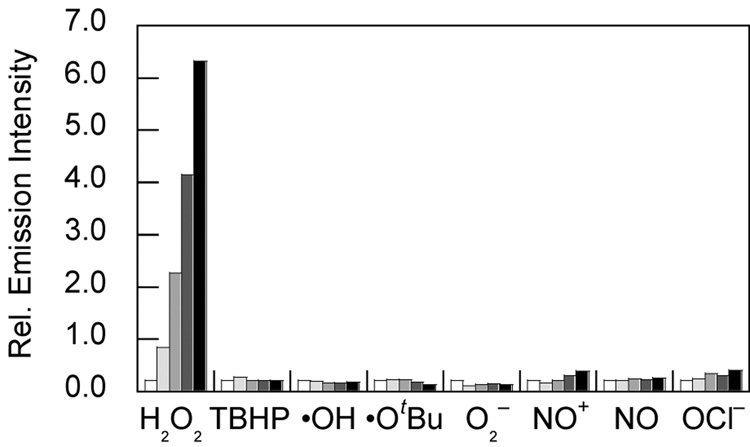
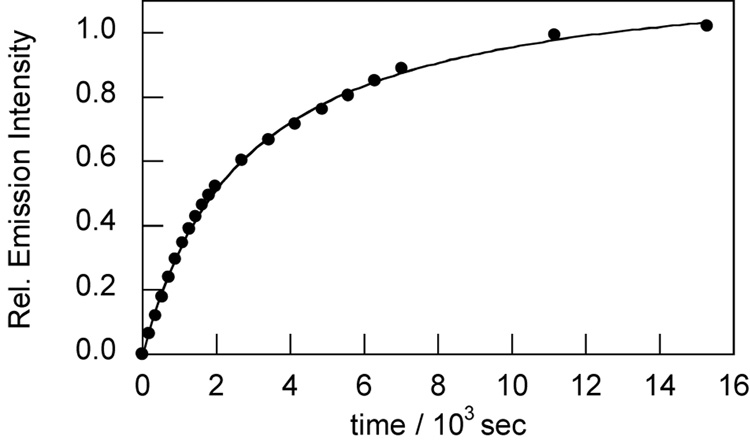
NPF1 was evaluated in aqueous solution at physiological pH (20 mM HEPES buffer, pH 7.5, 37 °C). In the absence of H2O2, NPF1 displays no discernable absorption or emission bands in the visible region of the spectrum, as expected for the parent compound in the closed lactone form. The compound does possess an absorption in the ultraviolet region due to the naphthalene chromophore (λmax = 345 nm, ε = 2.24 × 10⁴ M−1cm−1). Treatment of NPF1 with H2O2 triggers an increase in red-colored fluorescence centered at 660 nm with concomitant growth of an absorption feature centered at 598 nm characteristic of the ring-opened naphthofluorescein product.25,27 Figure 1 shows the fluorescence response of NPF1 to H2O2 from 0–60 min. NPF1 exhibits a > 25-fold increase in emission intensity after H2O2 treatment under these conditions. We note that deprotections of NPF1 are kinetically controlled and are not complete at these early time points. NPF1 is highly specific for H2O2 over competing ROS. Figure 2 shows the relative reactivities of the indicator toward various oxidants. NPF1 is selective for H2O2 over a variety of reactive oxygen and nitrogen metabolites, including superoxide, nitric oxide, hydroxyl radical, and tert-butyl hydroperoxide. Kinetics measurements of the fluorescence response of NPF1 to H2O2 under pseudo-first-order conditions (1 µM NPF1, 1 mM H2O2) give an observed rate constant of kobs = 3.1(1) × 10−4 s−1 (Figure 3).
Figure 1.
Fluorescence response of 5 µM NPF1 to 100 µM H2O2. The dashed spectrum was acquired before H2O2 addition (dotted line) and the solid line spectra shown were acquired after 10, 20, 30, 40, 50 and 60 min incubation with H2O2. Spectra were acquired in 20 mM HEPES, pH 7.5, at 37 °C (λexc = 598 nm).
Figure 2.
Fluorescence responses of 5 µM NPF1 to 100 µM reactive oxygen species (ROS). Hydrogen peroxide (H2O2), tert-butyl hydroperoxide (TBHP), and hypochlorite (OCl−) were delivered from 30%, 70%, and 5% aqueous solutions, respectively. Hydroxyl radical (•OH) and tert-butoxy radical (•OtBu) were generated by reactions of 1 mM Fe2+ with 100 µM H2O2 or 100 µM TBHP, respectively. Superoxide (O2−) was generated enzymatically using a xanthine/xanthine oxidase system. NO+ was delivered using S-nitrosocysteine (SNOC). NO was delivered using NOC-5. Spectra were acquired in 20 mM HEPES, pH 7.5, and all data were obtained after incubation with the appropriate ROS at 37 °C. Bars represent relative emission responses (λexc = 598 nm, λem = 660 nm at 0 (white), 15 (light gray), 30 (gray), 45 (dark gray), and 60 min (black) after addition of the appropriate ROS.
Figure 3.
Time-course kinetics measurement of the fluorescence response of NPF1 to H2O2. Data were collected under pseudo-first-order conditions (1 µM NPF1, 1 mM H2O2). Spectra were acquired in 20 mM HEPES, pH 7.5, at 25 °C (λexc = 598 nm, λem = 660 nm), and data are plotted as relative emission intensities over initial background.
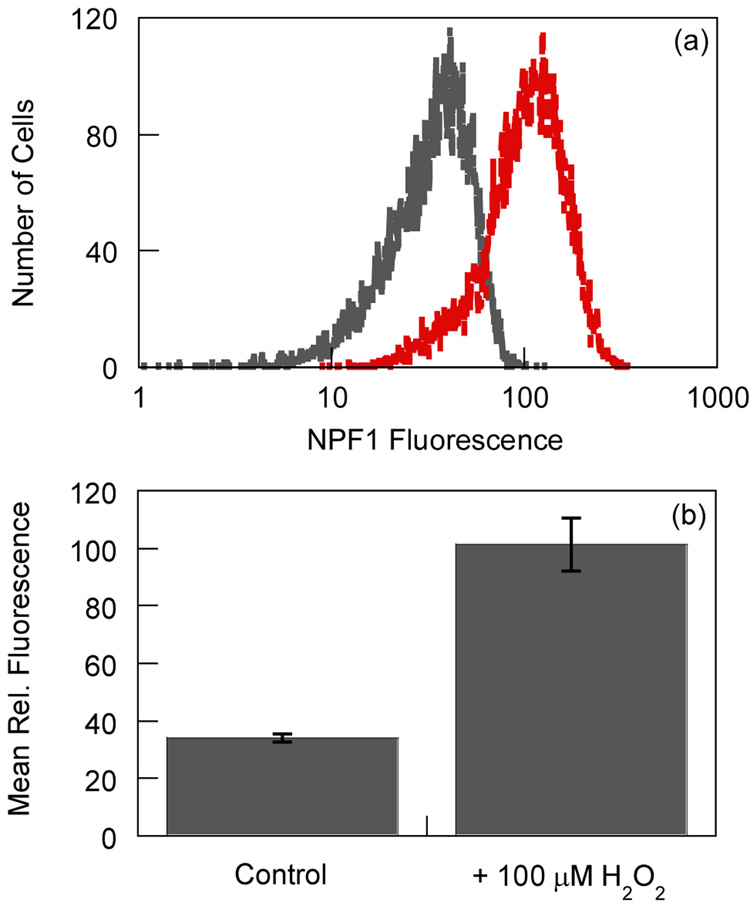
With spectroscopic data demonstrating the H2O2-specific response of NPF1 in aqueous media at physiological pH, we turned our attention to evaluating the ability of the dye to report changes in H2O2 levels in live-cell systems. To this end, RAW 264.7 macrophages were treated with either (i) 20 µM NPF1 only for 2 h at 37 °C or (ii) 20 µM NPF1 for 1 h followed by 100 µM H2O2 for an additional 1 h at 37 °C, and the relative fluorescence intensities of these cells were analyzed by flow cytometry. A clear population shift is observed in cells exposed to H2O2 compared to control cells without H2O2 exposure, with the H2O2-treated cells displaying a marked increase in red-colored fluorescence over their untreated counterparts (Figure 4). Dynamic light scattering measurements also confirm that the cells are viable throughout the experiments (Supplementary data). As observed for other diboronate reagents,15 initial attempts to use NPF1 for intracellular H2O2 detection under oxidative signaling conditions were unsuccessful, and confocal microscopy measurements were also hampered by the relative dimness of the naphthofluorescein product relative to fluorescein.25,27 Nevertheless, these results establish that NPF1 is cell-permeable and is capable of responding to intracellular changes in H2O2 levels in living mammalian cells.
Figure 4.
Flow cytometry analysis of NPF1-loaded live RAW 264.7 macrophages in response to increases in H2O2 levels. Two aliquots of cells were incubated with 20 µM NPF1 for 1 h. 100 µM H2O2 was subsequently added to one of the aliquots and the cells were incubated for an additional 1 h. Cells were then analyzed by flow cytometry. (a) Represetative flow cytometry trace from one experiment described above. Data are shown for NPF1-loaded control cells in the absence of H2O2 (gray) and cells treated with H2O2 (red). (b) Mean relative fluorescence for populations shown in panel (a) from three replicate experiments. Error bars represent the standard deviation from the mean for the three experiments. The data represent at least 10,000 cells for each analysis.
In summary, we have described a new boronate-based red-emitting fluorescent indicator for hydrogen peroxide in living cells. NPF1 possesses good selectivity for H2O2 over competing ROS, far-red visible excitation and emission profiles, and is capable of responding to changes in H2O2 levels within living cells. Ongoing and future efforts are focused on utilizing NPF1 and analogs for studies of peroxide biology in situations of oxidative stress, as well as increasing the sensitivity and optical brightness of probes that emit in the far-red visible and near-infrared region for use in live-cell and in vivo imaging applications.
Supplementary Material
Supplementary data associated with this article can be found in the online version.
Acknowledgments
We thank the Beckman, Packard, and Sloan Foundations, and the NIH (GM 79465) for providing funding for this work. A.E.A., B.C.D., and E.W.M. thank the NIH Chemical Biology Graduate Program (T32 GM066698) for support. A.E.A. thanks the ACS Organic Division for an Emmanuil Troyansky Graduate Fellowship and UC Berkeley for a Chancellor’s Opportunity Fellowship. E.W.M. acknowledges a Stauffer fellowship for support. We thank Ann Fischer (UCB Tissue Culture Facility) for expert technical assistance and Prof. Carolyn Bertozzi for use of her laboratory’s flow cytometer.
Footnotes
Publisher's Disclaimer: This is a PDF file of an unedited manuscript that has been accepted for publication. As a service to our customers we are providing this early version of the manuscript. The manuscript will undergo copyediting, typesetting, and review of the resulting proof before it is published in its final citable form. Please note that during the production process errors may be discovered which could affect the content, and all legal disclaimers that apply to the journal pertain.
References
- 1.Rhee SG. Science. 2006;312:1882–1883. doi: 10.1126/science.1130481. [DOI] [PubMed] [Google Scholar]
- 2.Stone JR, Yang S. Antioxid. Redox Signal. 2006;8:243–270. doi: 10.1089/ars.2006.8.243. [DOI] [PubMed] [Google Scholar]
- 3.Veal EA, Day AM, Morgan BA. Molecular Cell. 2007;26:1–14. doi: 10.1016/j.molcel.2007.03.016. [DOI] [PubMed] [Google Scholar]
- 4.D’Autréaux B, Toledano MB. Nat. Rev. Mol. Cell Biol. 2007;8:813–824. doi: 10.1038/nrm2256. [DOI] [PubMed] [Google Scholar]
- 5.Giorgio M, Trinei M, Migliaccio E, Pelicci PG. Nat. Rev. Mol. Cell Biol. 2007;8:722–728. doi: 10.1038/nrm2240. [DOI] [PubMed] [Google Scholar]
- 6.Poole LB, Nelson KJ. Curr. Opin. Chem. Biol. 2008;12:18–24. doi: 10.1016/j.cbpa.2008.01.021. [DOI] [PMC free article] [PubMed] [Google Scholar]
- 7.Miller EW, Chang CJ. Curr. Opin. Chem. Biol. 2007;11:620–625. doi: 10.1016/j.cbpa.2007.09.018. [DOI] [PMC free article] [PubMed] [Google Scholar]
- 8.Hempel SL, Buettner GR, O'Malley YQ, Wessels DA, Flaherty DM. Free Rad. Biol. Med. 1999;27:146–159. doi: 10.1016/s0891-5849(99)00061-1. [DOI] [PubMed] [Google Scholar]
- 9.Soh N. Anal. Bioanal. Chem. 2006;386:532–543. doi: 10.1007/s00216-006-0366-9. [DOI] [PubMed] [Google Scholar]
- 10.Maeda H, Futkuyasu Y, Yoshida S, Fukuda M, Saeki K, Matsuno H, Yamauchi Y, Yoshida K, Hirata K, Miyamoto K. Agnew. Chem. Int. Ed. 2004;43:2389–23891. doi: 10.1002/anie.200452381. [DOI] [PubMed] [Google Scholar]
- 11.Xu K, Tang B, Huang H, Yang G, Chen Z, Li P, An L. Chem. Commun. 2005:5974–5976. doi: 10.1039/b512440a. [DOI] [PubMed] [Google Scholar]
- 12.Chang MCY, Pralle A, Isacoff EY, Chang CJ. Am. Chem. Soc. 2004;126:15392–15393. doi: 10.1021/ja0441716. [DOI] [PMC free article] [PubMed] [Google Scholar]
- 13.Miller EW, Albers AE, Pralle A, Isacoff EY, Chang CJ. J. Am. Chem. Soc. 2005;127:16652–16659. doi: 10.1021/ja054474f. [DOI] [PMC free article] [PubMed] [Google Scholar]
- 14.Albers AE, Okreglak VS, Chang CJ. J. Am. Chem. Soc. 2006;128:9640–9641. doi: 10.1021/ja063308k. [DOI] [PubMed] [Google Scholar]
- 15.Miller EW, Tulyathan O, Isacoff EY, Chang CJ. Nat. Chem. Biol. 2007;3:263–267. doi: 10.1038/nchembio871. [DOI] [PubMed] [Google Scholar]
- 16.Srikun D, Miller EW, Domaille DW, Chang CJ. J. Am. Chem. Soc. 2008;130:4596–4597. doi: 10.1021/ja711480f. [DOI] [PubMed] [Google Scholar]
- 17.Dickinson BC, Chang CJ. J. Am. Chem. Soc. 2008;130:9638–9639. doi: 10.1021/ja802355u. [DOI] [PMC free article] [PubMed] [Google Scholar]
- 18.Zhou M, Diwu Z, Panchuk-Voloshina N, Haugland RP. Anal. Biochem. 1997;253:162–168. doi: 10.1006/abio.1997.2391. [DOI] [PubMed] [Google Scholar]
- 19.Belousov VV, Fradkov AF, Lukyanov KA, Staroverov DB, Shakhbazov KS, Terskikh AV, Lukyanov S. Nat. Methods. 2006;3:281–286. doi: 10.1038/nmeth866. [DOI] [PubMed] [Google Scholar]
- 20.Lee D, Khaja S, Velasquez-Castano JC, Dasari M, Sun C, Petros J, Taylor WR, Murthy N. Nat. Mater. 2007;6:765–769. doi: 10.1038/nmat1983. [DOI] [PubMed] [Google Scholar]
- 21.For some recent selected examples, seeHilderbrand SA, Weissleder R. Tetrahedron Lett. 2007;48:4383–4385. doi: 10.1016/j.tetlet.2007.04.088.and references 22-26.
- 22.Clark MA, Hilderbrand SA, Lippard SJ. Tetrahedron Lett. 2004;45:7129–7131. [Google Scholar]
- 23.Yang Y, Lowry M, Schowalter CM, Fakayode SO, Escobedo JO, Xu X, Zhang H, Jensen TJ, Fronczek FR, Warner IM, Strongin RM. J. Am. Chem. Soc. 2006;128:14081–14092. doi: 10.1021/ja0632207. [DOI] [PMC free article] [PubMed] [Google Scholar]
- 24.Yang Y, Lowry M, Xu X, Escobedo JO, Sibrian-Vazquez, Wong L, Schowalter CM, Jensen TJ, Fronczek FR, Warner IM, Strongin RM. Proc. Natl. Acad. Sci. USA. 2008;105:8829–8834. doi: 10.1073/pnas.0710341105. [DOI] [PMC free article] [PubMed] [Google Scholar]
- 25.Lee L. 4,933,471. U.S. Patent. 1990
- 26.Xu X, Liu X, Tang B. ChemBioChem. 2007;8:453–458. doi: 10.1002/cbic.200600392. [DOI] [PubMed] [Google Scholar]
- 27.Haugland RP. In: The Handbook: A Guide to Fluorescent Probes and Labeling Technologies. 10th Ed. Spence MTZ, editor. Carlsbad, CA: Invitrogen Corp; 2005. [Google Scholar]
Associated Data
This section collects any data citations, data availability statements, or supplementary materials included in this article.
Supplementary Materials
Supplementary data associated with this article can be found in the online version.


