

Abstract
Natural Killer (NK) cells from nonobese diabetic (NOD) mice induced with poly I:C in vivo exhibit low cytotoxicity against a range of target cells, but the genetic mechanisms controlling this defect are yet to be elucidated. Defects in the expression of NKG2D and its ligands, the RAE-1 molecules, have been hypothesized to contribute to the reduced NK function present in NOD mice. Here we show that segregation of the NK-mediated killing phenotype did not correlate with the NOD Raet1 haplotype, and that the large alterations in NKG2D expression previously reported on NK cells expanded in vitro were not observed in primary, poly I:C-elicited NK cells in vivo. Additional studies indicate a complex genetic control of defective NOD NK cells, including genes linked to the MHC and possibly those that are associated with an altered cytokine response to the TLR3-agonist, poly I:C.
INTRODUCTION
Natural killer (NK) cells are effector cells of the innate immune system that have a crucial role in fighting certain microbial infections and tumours. Without the need for immunisation or pre-activation, NK cells can recognise and kill aberrant cells (1). A number of investigators have reported a defect in the activation of NK cells in the nonobese diabetic (NOD) mouse strain (2-4), an animal model for human type 1 diabetes. Evidence for the reduced function of NOD NK cells being protective for type 1 diabetes was shown in studies using NOD and B6 mice transgenic for the BDC2.5 T cell receptor (5). Using microarray analyses, differences in the expression of several NK receptors in cells from BDC2.5/NOD and BDC2.5/B6 mice were observed, with most differentially expressed NK receptors being less abundant on the NOD genetic background. In addition, depletion of NK cells by anti-asialo GM1 antibody in the BDC2.5/NOD mice impaired diabetes development. These results supported a direct role for NK cells in beta cell death and led the authors to hypothesize that reduced NK activity on the NOD genetic background could provide partial protection from T1D.
A molecule described to influence NOD NK function is RAE-1, which is a ligand of the activating NK receptor NKG2D. Ogasawara et al. (6) observed that NKG2D on the surface of B6 NK cells cultured for four days with IL-2 was upregulated to a much higher level than on NOD NK cells. The reduced expression of NKG2D on NOD NK cells was correlated with high expression of RAE-1 ligands on NOD NK cells. Ogasawara et al. (6) proposed that increased expression of Rae-1 causes a reduced expression of NKG2D and contributes to the low NK killing observed in NOD mice. This ligand-induced internalisation of NKG2D was not observed in B6 NK cells and was proposed to be due to NOD and B6 strain-specific differences in RAE-1 expression. These observations were then correlated with the different NK activities displayed by the NOD and B6 strains (6). In addition, treatment with an anti-NKG2D mAb was shown to prevent diabetes in NOD mice by impairing the expansion and function of autoreactive CD8+ T cells, and a potential contributory effect of suppressed NK cells by NKG2D blockade could not be excluded (7).
We have evaluated several aspects of the hypothesis that NKG2D impairment due to expression of specific RAE-1 molecules contributes to the NK defect observed in NOD mice. Using mouse strains with different or segregating Raet1 haplotypes we fail to obtain support for the hypothesis that NKG2D upregulation or NK-mediated killing is determined by the Raet1 haplotype. Instead, we find that NK-mediated killing is under complex genetic control and that NOD NK cells are partially activated following the injection of poly I:C.
MATERIALS AND METHODS
Mice
Breeding stock for the NOD/MrkTac (NOD), NOD.Idd3/5 (Taconic line 6109; B10 at D1Mit124 to D1Mit132 and B6 at D3Nds36 to D3Nds34), NOD.Idd3/l0/18 (Taconic line 1538; B6 at D3Mit67 to D3Mit94 and D3Mit12 to rs38124092) and NOD.Idd9 (Taconic line 905; B10 at D4Mit258 to D4Mit42) strains were purchased from Taconic, Inc (Germantown, NY, USA). (Depictions of the congenic intervals are at the following website: http://www.t1dbase.org/page/DrawStrains). For the genetic analyses, F1 mice were produced by mating NOD and B10.NOD H2g7 mice (Taconic line 1107; NOD at rsl3459151 to rsl3483054); (NOD × B10.NOD H2g7)F1 mice were mated with NOD mice to produce the backcross one generation. Note that B10.BR H2k (Taconic line 1073; length of congenic interval encompassing the MHC has not been defined) is denoted as B10.H2k, and B10.NOD H2g7 as B10.H2g7. All animals were housed under specific pathogen-free conditions. All mice were age-matched females and were tested at eight to 14 weeks of age. C57BL/6 and BALB/c mice were obtained from Charles River Laboratories (Margate, UK).
Poly I:C administration and preparation of single cell suspensions
Mice received poly I:C (Sigma, USA) at a dose of 300 μg intraperitoneally in PBS. Spleen cell suspensions were prepared and red blood cells were removed by hypotonic shock.
RNA extraction and Quantitative real time PCR (QPCR)
Total RNA was extracted from spleen cells using TRIzol® (Gibco BRL, USA) and polyA RNA was isolated using the Genelute mRNA miniprep kit (Sigma, USA). QPCR was performed on an ABI Prism 7700 Sequence Detection System (Perkin Elmer, Foster City, CA) using cDNA as template. Amplification reactions contained 13 μl of TaqMan® Universal PCR Mastermix (with TaqGold (5 U/μl) and Amperase UNG (5 U/μl)), primers and probes at a previously determined optimised concentration, 2 μl of cDNA and ddH2O to achieve a final reaction volume of 25 μl. Amplification of β2-microglobulin was performed for sample normalisation. NKG2D and Raet1 transcripts were amplified as previously described (7). To ensure absence of genomic DNA contaminants, samples that were treated with and without reverse transcriptase during cDNA synthesis were prepared and run in parallel.
Fluorescence activated cell sorting (FACS) analysis
Spleen cells from 8 to 14 week old mice were used for FACS analysis. Antibodies against mouse leukocyte antigens included: PE-conjugated pan-NK cell mAb (clone DX5; anti-mouse CD49b reacting with the integrin α2 chain) was purchased from BD Biosciences and biotinylated NKG2D mAb (clone C7) was purchased from BioLegend (San Diego, CA).
NK cytotoxicity assays
NK cytotoxicity was measured using a standard 51Cr-release assay. Freshly isolated splenocytes were used as effector cells. For target preparation, YAC-1 cells were labelled with Na2 (5lCr) for 60 min at 37°C, then washed twice with medium and plated out at 1 × 10⁴ cells in each U-bottomed well of 96 MicroWell™ Optical Bottom Plates (Fisher Scientific, UK). All assays were performed in quadruplicate and averaged. As a measure of total release, target cells were lysed with 100 μl of 1% Triton X-100 (BDH Laboratory Supplies, UK) in PBS solution. Percent specific release was calculated using the standard formula: [(experimental cpm − spontaneous cpm)/(maximal cpm − spontaneous cpm)] × 100. Spontaneous release was below 15% of maximal incorporated cpm.
IL-12p40 protein assay
Sera obtained from uninjected mice and mice injected three hours previously with poly I:C (Sigma) were assayed for IL-12p40 using a mouse IL-12/IL-23p40 non allele specific kit (R&D Systems).
Statistical analysis
Differences in data points for various strains or treatment groups were tested for significance using the unpaired two-tailed Student's t test or a non-parametric test, Mann-Whitney, where appropriate. All data are shown as the mean response ± standard error of the mean (SEM) or standard deviation (SD).
RESULTS
High NK function in NOD mice is not restored by alleles at Idd loci that prevent type 1 diabetes
First, we confirmed previous studies demonstrating that NOD mice have reduced NK killing as compared to B6 mice 24 h following injection of the TLR3-agonist, poly I:C. In order to rule out the possibility that the low NK cytotoxicity in NOD mice is secondary to the immune events leading to the development of type 1 diabetes, we asked whether any of the major diabetes-causing genetic intervals influence NK function. We surveyed three NOD congenic strains having highly protective combinations of Idd alleles derived from either the B6 or B10 mouse strains, NOD.Idd3/5, NOD.Idd3/10/18, and NOD.Idd/9, where mice develop 1%, 5%, and 2% diabetes, respectively (8-11), in contrast to an incidence of >80% in NOD mice. Some of the Idd loci, including Idd3, Idd5, Idd 10, and Idd 18 (8, 10, 12, 13), regulate both insulitis and diabetes susceptibility, and others, including Idd9.1, Idd9.2 and Idd9.3 limit the progression to diabetes whilst having no effect on the development of insulitis (14). None of the surveyed strains of diabetes-resistant NOD congenic mice demonstrated B6-like NK activity suggesting that genes on the NOD background outside of these diabetes-causing regions, rather than secondary effects caused by disease pathogenesis, are responsible for low NK activity in NOD mice (Fig. 1).
Figure 1. Low NK function of spleen cells from NOD and NOD congenic mice in spite of normal numbers of DX5+CD3− cells.
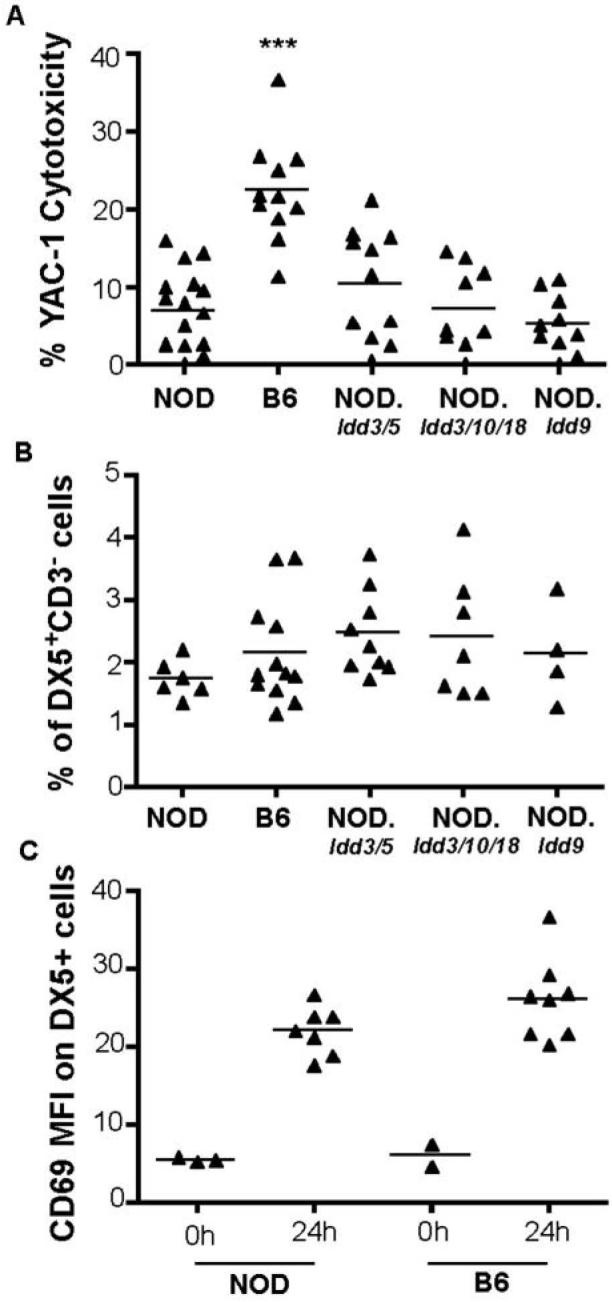
(A) Cytotoxicity mediated by total splenocytes from NOD (n = 16), B6 (n = 11), NOD.Idd3/5 (n = 11), NOD.Idd3/10/18 (n = 9), and NOD.Idd9 (n = 10) mice was tested using a 4 h 51Cr release assays. YAC-1 target cells were labelled with 51Cr and co-cultured with in vivo poly I:C stimulated splenocytes at an effector:target (E:T) ratio of 200:1. (B) Percentages of DX5+CD3− cells in the lymphocyte gate of total splenocytes analysed by flow cytometry. (C) MFI of CD69 on DX5+ cells with and without activation using in vivo poly I:C. P values were obtained by unpaired, two-tailed t tests, and refer to tests against NOD. ***, P < 0.001.
B6-like percentages of DX5+ CD3− cells in NOD and NOD congenic mice
One trivial explanation for the lower NK activity in NOD mice would be that NOD mice have reduced numbers of NK cells. Due to the lack of the NK 1.1 allotype in NOD mice, we used DX5 and CD3 as markers to enumerate NK cells in spleens of the strains tested for NK function. The percentage of DX5+ CD3− cells in the lymphocyte gate was similar in strains with high and low NK cytotoxicity (Fig. 1B). This agrees with findings obtained for the CD3− TMb-1+ DX5+ phenotype of splenic NK cells from NOD compared to B6.H2g7 mice (4), but contrasts with data obtained for the percentage of DX5+ asialo-GM1+ fraction in spleens of NOD and B6 mice (3), which was lower by approximately 20% in NOD compared to B6 splenocytes.
NOD mice respond to poly I:C
Since NOD mice have NK cells, we measured the expression of CD69, an activation marker (15), on B6 and NOD NK cells at various times after poly I:C administration. After determining that maximal upregulation of CD69 was achieved by 24 h (data not shown), we tested groups of B6 and NOD mice at this time point. Although B6 NK cells tended to express higher levels of CD69 as compared to NOD NK cells, both strains upregulated CD69 and there was no significant difference in their mean fluorescence intensities (MFI) 24 h following injection of poly I:C (Fig. 1C).
Complex genetic control of NK activity
In initial analyses of NK cytotoxicity in a variety of crosses, we noted restoration of NK-mediated killing in (NOD × B10.H2g7)F1 mice (Fig. 2A) to B6-like killing levels, indicating that a backcross to NOD would be appropriate to examine the genetic control of NK function. Unexpectedly, splenocytes obtained from B10.H2g7 mice performed relatively poorly in the YAC-1 cytotoxicity assay as compared to B6 spleen cells, suggesting that either the NOD MHC-linked region or the B10 versus B6 background genes have an effect on NK-mediated killing in these mice. Consistent with the first possibility, we found that the NK function of B10.H2k cells was similar to that of B6 cells, although NOD.H2b NK function remained low (data not shown). These results therefore led us to speculate that the B6-like NK function present in the (NOD × B10.H2g7)F1 genetic environment is due to an interaction between B10-derived and NOD-derived alleles that can counter the negative effects of NOD MHC homozygosity. This observation indicated a complex genetic control of NK cell function. We next assessed NK function in a panel of NOD × (NOD × B10.H2g7)F1 backcross mice. Standard 51Cr release assays were used to measure cytotoxicity levels of total splenocytes obtained from adult mice following injection poly I:C. A total of 68 female backcross mice were produced and tested for NK cytotoxicity 24 h after poly I:C administration. Cytotoxicity levels ranged from NOD-like (low) to Fl-like (high) as measured by 51Cr release after 4 h incubation with YAC-1 targets (Figure 2B). The continuous distribution of NK activity amongst the backcross population around a single mean with approximately two thirds of the mice showing F1-like or higher NK activity, indicates that NK function is controlled by multiple genes. If a single NOD-derived recessive gene had been responsible for the reduced NOD NK cell function, a 50:50 bimodal distribution of high and low responders would have been expected in the backcross population.
Figure 2. NK function in (NOD × B10.H2g7)F1 and NOD × (NOD × B10.H2g7)F1 backcross mice.
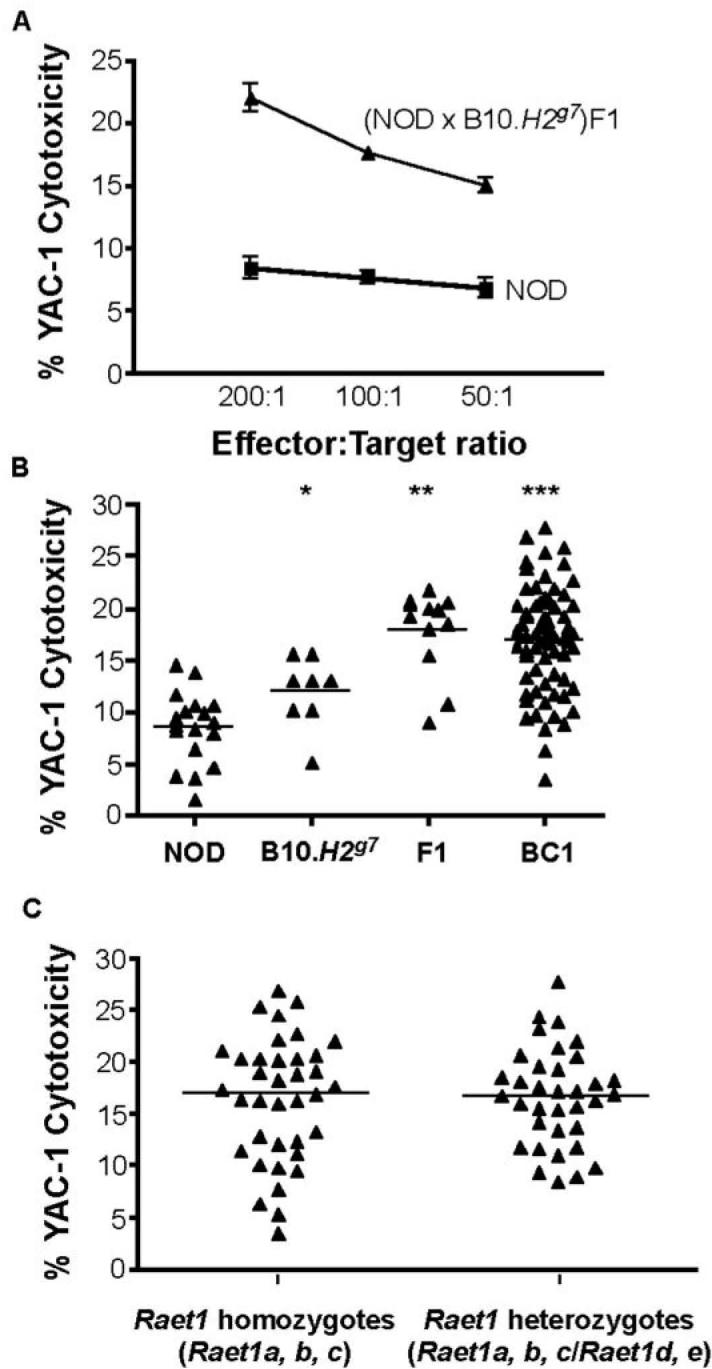
(A) Cytotoxicity by total splenocytes of NOD (n = 3) and (NOD × B10.H2g7)F1 (n = 3) mice. YAC-1 target cells were labelled with 51Cr and co-cultured with in vivo poly I:C stimulated splenocytes at effector:target ratios of 200:1, 100:1 and 50:1. (B) Cytotoxicity is shown at an E:T = 200:1 in groups of NOD (n = 18), B10.H2g7 (n = 8), (NOD × B10.H2g7)F1 (n = 12) and NOD × (NOD × B10.H2g7)F1 backcross (n = 68) mice. (C) Cytotoxicity levels observed in NOD × (NOD × B10.H2g7)F1 backcross mice segregated by Raet1 haplotypes.
Genetic control of NK activity does not segregate with strain-specific Raet1 alleles
Stimulated by the report that low NOD NK cell function may be related to downmodulation of NKG2D by the expression of strain-specific RAE-1 ligands in vitro (6), we asked whether the genetic control of NK function in vivo is influenced by the polymorphic Raet1 locus on chromosome 8. To address this, we first investigated whether strain-specific Raet1 alleles segregate with NK function in the panel of backcross mice between NOD and B10 mice: NOD mice have the Rete1a, Raet1b and Raet1g genes, while B10 mice have the Raet1d and Raet1e genes (data not shown). Genotyping showed that the (NOD × B10.H2g7)F1 mice were heterozygous at all five Raet1 genes (a, b, c, d, e) and approximately half of the backcross mice were homozygous for NOD Raet1 genes (a, b, c) and half were heterozygous. Logistic regression analysis of 68 (NOD × B10.H2g7)F1 × NOD backcross one mice showed no association between cytotoxicity level and Raet1 haplotype (P=0.84) at an effector:target ratio of 200:1. The average level of cytotoxicity of Raet1 homozygotes was 16.91 (95% CI 14.74-19.08) compared to 16.63 exhibited by Raet1 heterozygotes (95% CI 15.02-18.25) (Figure 2C).
Is the down-modulation of NKG2D by RAE-1 necessary for reduced NK function in NOD mice?
In order to further investigate the potential correlation between NKG2D cell surface expression and NK cytotoxicity levels, additional mouse strains, BALB/c and B10.H2k, were examined. If the NOD NK defect was in part influenced by the NOD Raet1 haplotype as suggested previously (6), strains with the same Raet1 haplotype would be expected to exhibit some defect in NK cell function. Sequence analyses (data not shown) demonstrated that B10.H2k mice have the B6-like Raet1 haplotype (Raet1d and Raet1e), while BALB/c mice have the NOD-like Raet1 haplotype (Raet1a, Raet1b and Rae1d). We show that B10.H2k DX5+ cells modestly upregulate NKG2D following in vivo poly I:C activation (Figure 3A) and have B6-like cytotoxicity levels (Figure 3B). DX5+ cells from poly I:C treated BALB/c mice upregulated NKG2D similarly to B10H2k DX5+ cells following activation (Figure 3A) and exhibited high cytotoxicity (Figure 3B). Thus, there was no evidence of either NKG2D down modulation or low NK function in BALB/c mice despite having the Raet1 hapotype proposed to contribute to NK cell functional impairment in NOD mice. Taken together, the failure to detect an association between the Raet1 haplotype and cytotoxicity in a panel of backcross one mice, and the observation that Raet1 genes present in the NOD strain have no effect on cytotoxicity in BALB/c mice, demonstrate that reduced NK function in the NOD strain cannot be attributed to the polymorphic Raet1 locus.
Figure 3. NKG2D expression on (A) BALB/c and (B) B10.H2k DX5+ cells.

Flow cytometric analysis was performed using freshly isolated single cell suspensions of spleens from uninjected and poly I:C injected animals. Cells were stained with PE-conjugated pan-NK cell mAb and biotinylated NKG2D mAb plus PerCP-streptavidin. Mean fluorescence intensity (MFI) values are shown for untreated (0 h) and treated (24 h after poly I:C injection) animals. The dotted grey and black lines show isotype control Ig staining for unactivated and activated DX5+ cells, respectively, and the thin grey and thick black lines represent NKG2D expression on unactivated and activated DX5+ cells, respectively. Shown are examples of at least two independent experiments. (C) Cytotoxicity by NOD, B6, B10.H2k, and BALB/c splenocytes activated by in vivo poly I:C for 24 h using 4 h 51Cr release assays with YAC-1 targets (2 or 3 animals per strain). Cytotoxicity levels of NOD and (NOD × B10.H2g7)F1 splenocytes are shown for comparison. Data are shown as mean % cytotoxicity ± SEM.
Failure to upregulate NKG2D in vivo does not correlate with NK activity in backcross one and (NOD × B10.H2g7)F1 mice
We next asked if the downmodulation of NKG2D on the surface of NOD NK cells that occurs in vitro, which is hypothesized to result from high expression of Raet1 ligands on NOD NK cells (6), also occurs in vivo. NKG2D levels on freshly isolated NK cells were examined from normal mice and those injected with poly I:C 24 h earlier. As shown in Figure 4A, B6 mice exhibit a small degree of upregulation of NKG2D upon activation, in marked contrast with the significant upregulation observed by (6) on NK cells activated in vitro for four days. NOD and B6 DX5+ cells have comparable levels of cell surface NKG2D in the unactivated state, however, NOD DX5+ cells (Figure 4B) failed to undergo the slight upregulation of NKG2D observed in B6 cells following in vivo activation with poly I:C. However, at the 24h time-point, in addition to the slightly reduced NKG2D expression on NOD DX5+ cells compared to B6 DX5+ cells, (NOD × B10.H2g7)F1 DX5+ cells also exhibited lower NKG2D expression compared to B6 cells, even though YAC-1 cytotoxicity of splenocytes obtained from these mice is similar to B6 (Figure 4C). During a time-course of 0, 2 and 24 h of poly I:C activation, NKG2D transcript levels were not upregulated in splenocytes from either B6 or NOD mice (Figure 4D).
Figure 4. NKG2D cell surface staining and mRNA transcript expression following poly I:C administration.

NKG2D expression on B6 (A) and NOD (B) DX5+ cells measured by flow cytometry. Freshly isolated single cell suspensions of spleens from uninjected and poly I:C injected mice were stained with PE-conjugated pan-NK cell mAb and biotinylated NKG2D mAb plus PerCP-streptavidin. Mean fluorescence intensity (MFI) values are shown for untreated (0 h) and treated (24 h after poly I:C injection) animals. The dotted grey and black lines show isotype control Ig staining for unactivated and activated DX5+ cells, respectively, and the grey thin and black thick lines represent NKG2D expression on unactivated and activated DX5+ cells, respectively. Shown are examples of at least five independent experiments. (C) Expression levels of RAE-1 and NKG2D transcripts in B6 and (D) NOD splenocytes by QPCR. Each sample was run in duplicate. The two resulting cycle numbers (Ct values) at which mRNA expression was detected were averaged and normalised with β2-microglobulin to obtain delta Ct values. Poly(A) RNA was used for cDNA synthesis. Means of two experiments are shown and error bars represent standard deviation.
Differences in NKG2D cell surface expression between backcross one mice were minimal as expected, since the difference in upregulation of this molecule even between NOD and B6 mice is only small upon in vivo activation with poly I:C. Nevertheless, in general, we noted a trend towards increased levels of NKG2D on DX5+ cells of mice whose splenocytes exhibited high levels of cytotoxicity in 51Cr release assays, but this was not significant (P > 0.05). Such a trend was not noted when NKG2D expression was correlated with the Raet1 haplotype, suggesting that potent NK cells could have somewhat higher levels of NKG2D on the cell surface than NK cells with low cytotoxicity, but that this is not related to the Raet1 genes. Examples of backcross one mice with the homozygous NOD Raet1 haplotype (Raet1a, b, c) and the heterozygous Raet1 haplotype (Raet1a, b, c) /Raet1 d, e) are shown in Figure 5A. The Raet1 heterozygous backcross one mouse had similar NKG2D levels as the Raet1 a, b, c homozygotes, and splenocytes from both mice were potent killers (Figure 5B).
Figure 5. NKG2D cell surface staining of cells with two Raet1 haplotypes.
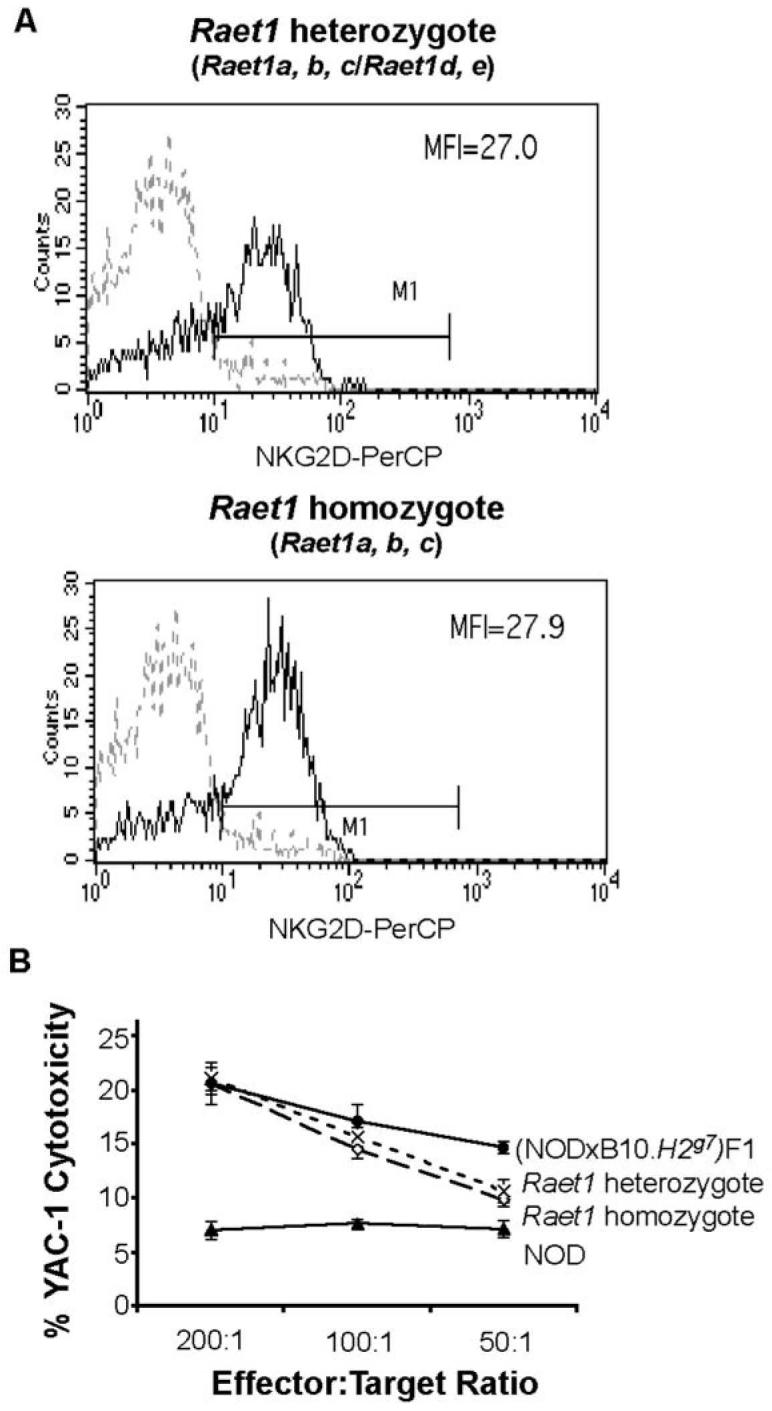
(A) NKG2D expression on NK cells for backcross one mice analysed by flow cytometry and for cytotoxicity. Shown are representative examples of mice with the F1-haplotype (with all five Raet1 genes, namely, a, b, c, d, e) or the NOD haplotype (a, b, c) with high and low YAC-1 cytotoxicity. Freshly isolated single cell suspensions of splenocytes from uninjected and poly I:C injected mice were stained with PE-conjugated pan-NK cell DX5 mAb and biotinylated NKG2D mAb plus PerCP-streptavidin. The dotted lines show isotype control Ig staining and the thick line represents NKG2D expression on DX5+ cells of poly I:C activated animals 24 h after treatment. Mean fluorescence intensities (MFI) are shown. (B) Cytotoxicity determined by 5lCr release assays using splenocytes obtained from the Raet1 heterozgyote and the Raet1 homozygote as shown in (A). Cytotoxicity levels of NOD and (NOD × B10H2g7)F1 splenocytes are shown for comparison. Data are shown as mean % cytotoxicity ± SEM.
Having failed to observe a correlation of NKG2D levels or Raet1 haplotype with NK activity, we noted the NOD NK cells are activated as measured by CD69 upregulation following injection with poly I:C (Figure 1C). Since poly I:C induces macrophages and dendritic cells to produce cytokines and interferons that subsequently activate NK cells (16, 17), we hypothesized that events leading to the full activation of NK cells might be disparate in different strains of mice. Early events in the poly I:C response in vivo include the activation of macrophages and dendritic cells as measured by secretion of cytokines and interferons. These secreted products subsequently activate NK cells. Using QPCR analysis of cDNA obtained from normal or poly I:C-injected mice, preliminary kinetic analyses were performed and a 2 h time-point was selected to examine IL-12p40, IL-18, IFN-β, and IFN-γ mRNA levels in NOD, B10.H2g7 and (NOD × B10.H2g7)F1 spleen cells. We noted that the expression of B2m, the gene used for normalizing gene expression in our study, was not modulated following activation by poly I:C (data not shown).
Most interestingly, IL-12p40 mRNA was lowest in unstimulated NOD spleen cells, 4.8-fold lower than B10.H2g7 and 2.1 fold lower than F1 spleen cells (Figure 6A). NOD splenocytes also failed to upregulate IL-12p40 mRNA upon poly I:C stimulation, unlike both B10.H2g7 and F1 spleen cells (Figure 6A). In addition, IFN-γ was upregulated in the NOD splenocytes upon stimulation (P = 0.009), while down-regulated in F1 spleen cells (P = 0.01); B10.H2g7 spleen cells showed a trend towards IFN-γ downregulation (P = 0.11). While both IL-18 and IFN-β mRNA were upregulated in the NOD spleen cells upon stimulation (P = 0.001 and P < 0.0001, respectively), B10.H2g7 and F1 spleen cells only upregulated IFN-β (P = 0.006 and P = 0.01, respectively). In comparisons to NOD basal levels, the expression of both cytokines were higher in F1 spleen cells (IL 18: P=0.002, IFN-β: P = 0.004), and in comparison to NOD levels upon stimulation, B10.H2g7 spleen cells showed increased upregulation of IFN-β mRNA. We also noted that the NOD cytokine pattern was retained in NOD.Idd3/5, NOD.Idd3/10/18, and NOD.Idd9 spleen cells with and without poly I:C (data not shown).
Figure 6. Cytokine expression following poly I:C treatment.

(A) Expression of IL-12, IL-18, IFN-γ, and IFN-β mRNA at 2h in splenocytes of untreated and in vivo poly I:C activated splenocytes. The two resulting cycle numbers (Ct values) at which RNA expression was detected were averaged and normalised to (β2-microglobulin to obtain ΔCt values. Differences within basal and activated groups were calculated using nonparametric (Mann-Whitney) tests and are noted at the top of each. Data from unstimulated B10.H2g7 and F1 mice are compared to unstimulated NOD mice; data from stimulated B10.H2g7 and F1 mice are compared to stimulated NOD mice. *, P < 0.05. **, P < 0.01. ***, P < 0.001. F1 refers to (NOD × B10.H2g7)F1. The numbers of mice per cytokine and condition are: IL-12 (NODunstim = 17, NODstim = 30; B10.H2g7unstim, = 7, B10.H2g7stim, = 9; F1unstim = 6, F1stim = 8), IL-18 (NODunstim = 11, NODstim = 31; BIO.H2g7unstim, = 4, B10.H2g7stim, = 8; F1unstim = 9, F1stim = 12), IFN-γ (NODunstim = 10, NODstim = 31; B10.H2g7unstim, = 5, B10.H2g7stim, = 9; F1unstim = 10, F1stim = 13), IFN-β (NODunstim = 10, NODstim = 32; B10.H2g7unstim, = 4, B10.H2g7stim, = 9; F1unstim = 11, F1stim = 13). (B) Expression of IL-12p40 in sera of untreated and in vivo poly I:C activated NOD and B10.H2g7 mice. IL-12p40 was measured using an antibody-based detection assay. P values were obtained using the Mann-Whitney non-parametric test. Data from unstimulated B10.H2g7 mice are compared to unstimulated NOD mice; data from stimulated B10.H2g7 mice are compared to stimulated NOD mice and data from stimulated NOD mice are compared to unstimulated NOD mice. *, P < 0.05. **, P < 0.01. ***, P < 0.001.
IL-12p40 protein expression also differed between NOD and B10.H2g7 mice injected with poly I:C (Figure 6.B). Levels of IL-12p40 in NOD (n = 8)and B10.N2g7 (n = 8) mice were 9.38 +/− 1.71 ng/ml and 28.6 +/− 3.69 ng/ml, respectively (P = 0.01). Basal levels of serum IL-12p40 were detectable and also differed between the two strains; NOD IL-12p40 serum levels were lower (0.395 +/− 0.17, n = 4) than those of B10.H2g7 mice (1.74 +/− 0.29, n=4) and this was significantly different (P = 0.03). Thus, whilst there is an increase in serum IL-12p40 protein levels following activation in NOD mice, it is much less than that in B10.H2g7 mice, which is similar to the response measured at the transcript level—a large increase in IL-12p40 mRNA in B10.H2g7 splenocytes at the transcript level versus no increase in NOD splenocytes following activation with poly I:C. The difference in the results between the RNA and protein levels could reflect the ability of poly I:C to induce sufficient activation to stimulate translation of existing IL-12p40 mRNA but may be insufficient to induce new transcription in NOD mice while in B10.H2g7 mice, translation and transcription are both stimulated by poly I:C. Alternatively, cells outside of the spleen could produce the IL-12p40 protein detected in NOD mice after poly I:C.
These results support the hypothesis that genes involved in determining the initial response made by macrophages and DCs, which we have studied in vivo by injection of poly I:C, contribute to the multigenic control of NK function.
DISCUSSION
NK cell function is reduced in NOD mice and we wished to extend prior mechanistic studies of this defect. Our data do not lend support to the hypothesis that NOD NK impairment is due to NKG2D down-modulation by a NOD-specific Raet1 haplotype. In contrast to the 400% difference in NKG2D upregulation between B6 NK cells activated for four days as reported by Ogasawara el al. (6), B6 NK cells displayed only a minimal increase (∼25%) in cell-surface NKG2D after activation in vivo. Although poly I:C-activated NOD NK cells did not show the small increase of NKG2D observed on activated B6 NK cells, the B6 and NOD NK cells had comparable levels of NKG2D before activation and there was no down-modulation of NKG2D on the NOD NK cells (Fig. 5). An explanation of the observed discrepancies between theses two studies may be the use of cells that have been treated very differently before and during the course of the experiment. Ogasawara et al. (6) used purified NK cells cultured with IL-2 for four days, while here, freshly isolated unactivated or in vivo poly I:C-activated cells were examined.
Since our data did not support the hypothesis that the Raet1 haplotype present in the NOD strain caused poor NK function, we next examined initial events following poly I:C activation. Amongst other differences in cytokine mRNA production between strains with high and low NK function, differences in the induced level of IL-12p40 mRNA following poly I:C injection were most notable and were decreased in NOD mice as compared with mice known to have potent NK function. IL-12 is a crucial player in inducing resistance to infection, stimulates IFN-γ secretion by NK cells and increases NK cytolytic activity (18, 19). Notably, variants between NOD and B6 in the coding region of the IL-12p40 gene have been described and basal and LPS-stimulated expression differences observed in vivo (20), although the co-segregation of IL-12p40 expression levels and Il12b genotype was not observed in all of the mouse strains examined. Since the IL-12p40 gene is located near or possibly within the Idd4 linkage region on chromosome 11 that was originally defined in a segregation analysis involving the NOD and B10.H2g7 strains (21), we tested for co-segregation of NK cytotoxicity and D11Nds1, the marker at the peak of the Idd4 linkage region. A phenotype-genotype correlation was not observed in the 68 (NOD × B10.H2g7)F1 × NOD backcross one mice tested (data not shown). These results indicate that genetic variation at the IL-12p40 gene itself is not sufficient to alter NK cytotoxicity levels, at least in the sample size tested.
In contrast to the lower in vivo expression of IL-12p40 by NOD mice following injection of poly I:C that was observed in the current study, others have observed higher expression of IL-12p40 by NOD macrophages and DCs as compared to diabetes-resistant strains (22, 23). We note that these studies have involved macrophages and dendritic cells stimulated ex vivo or activated after differentiating in vitro from bone marrow cells. From these combined studies, IL-12 has been hypothesized to be an important factor in predisposing to and shaping the Th1-driven immunopathology in NOD mice (24). These aberrantly high IL-12 levels may be caused by NF-κB hyperactivation in both macrophages (6) and bone marrow-derived DCs (25). Using thioglycollate-elicited peritoneal exudate macrophages from B6.NOD Idd4 mice stimulated with lipopolysaccharide in vitro, NOD over-expression of IL-12p40 correlated with the Idd4 genotype (26). However, in a strain comparison, expression of IL-12p40 did not segregate with the IL-12p40 allele present suggesting that genes within the Idd4 region other than Il12b are responsible for the aberrant IL-12p40 regulation (26, 27).
A recent report by Vasquez et al. (28) observed that NOD CD8α+ DCs produced less IL-12p40 than did CD8α+ DCs from diabetes-resistant strains. Results from Johansson el al. (4) are also consistent with the interpretation that some cells in NOD mice are deficient in producing IL-12p40 since they observed a normalisation of NK function when NOD splenocytes were incubated with IL-12 and IL-18 for four days in vitro.
CONCLUSION
Our genetic studies strongly support the hypothesis that the low NK function in NOD mice is a complex trait under multigenic control that may include genes affecting the expression of IL-12p40. Based on this apparent level of complexity, a whole genome scan involving several hundreds of backcross and F2 mice phenotyped for NK cell cytolytic activity would be necessary to define the chromosome regions responsible for the variation in NK cell function between the NOD and the B10.H2g7 mouse strains. A positional cloning strategy would then be necessary to identify viable candidate genes.
Abbreviations used in this paper
- NK
natural killer
- T1D
type 1 diabetes
Footnotes
LSW and JAT are supported by a grant from the Juvenile Diabetes Research Foundation (JDRF) and the Wellcome Trust, and LSW is JDRF/Wellcome Trust Principal Research Fellow. The Cambridge Institute for Medical Research is in receipt of a Wellcome Trust Strategie Award (079895). The availability of NOD congenic mice through the Taconic Farms Emerging Models Program has been supported by grants from the Merck Genome Research Institute, NIAID, and the JDRF. LMM is a JDRF Postdoctoral Fellow.
REFERENCES
- 1.Colucci F, Caligiuri MA, Di Santo JP. What does it take to make a natural killer? Nat Rev Immunol. 2003;3:413–425. doi: 10.1038/nri1088. [DOI] [PubMed] [Google Scholar]
- 2.Kataoka S, Satoh J, Fujiya H, Toyota T, Suzuki R, Itoh K, Kumagai K. Immunologic aspects of the nonobese diabetic (NOD) mouse. Abnormalities of cellular immunity. Diabetes. 1983;32:247–253. doi: 10.2337/diab.32.3.247. [DOI] [PubMed] [Google Scholar]
- 3.Poulton LD, Smyth MJ, Hawke CG, Silveira P, Shepherd D, Naidenko OV, Godfrey DI, Baxter AG. Cytometric and functional analyses of NK and NKT cell deficiencies in NOD mice. Int Immunol. 2001;13:887–896. doi: 10.1093/intimm/13.7.887. [DOI] [PubMed] [Google Scholar]
- 4.Johansson SE, Hall H, Bjorklund J, Hoglund P. Broadly impaired NK cell function in non-obese diabetic mice is partially restored by NK cell activation in vivo and by IL-12/IL-18 in vitro. Int Immunol. 2004;16:1–11. doi: 10.1093/intimm/dxh002. [DOI] [PubMed] [Google Scholar]
- 5.Poirot L, Benoist C, Mathis D. Natural killer cells distinguish innocuous and destructive forms of pancreatic islet autoimmunity. Proc Natl Acad Sci USA. 2004;101:8102–8107. doi: 10.1073/pnas.0402065101. [DOI] [PMC free article] [PubMed] [Google Scholar]
- 6.Ogasawara K, Hamerman JA, Hsin H, Chikuma S, Bour-Jordan H, Chen T, Pertel T, Carnaud C, Bluestone JA, Lanier LL. Impairment of NK cell function by NKG2D modulation in NOD mice. Immunity. 2003;18:41–51. doi: 10.1016/s1074-7613(02)00505-8. [DOI] [PubMed] [Google Scholar]
- 7.Ogasawara K, Hamerman JA, Ehrlich LR, Bour-Jordan H, Santamaria P, Bluestone JA, Lanier LL. NKG2D blockade prevents autoimmune diabetes in NOD mice. Immunity. 2004;20:757–767. doi: 10.1016/j.immuni.2004.05.008. [DOI] [PubMed] [Google Scholar]
- 8.Lyons PA, Armitage N, Lord CJ, Phillips MS, Todd JA, Peterson LB, Wicker LS. Mapping by genetic interaction: high-resolution congenic mapping of the type 1 diabetes loci Idd10 and Idd18 in the NOD mouse. Diabetes. 2001;50:2633–2637. doi: 10.2337/diabetes.50.11.2633. [DOI] [PubMed] [Google Scholar]
- 9.Lyons PA, Hancock WW, Denny P, Lord CJ, Hill NJ, Armitage N, Siegmund T, Todd JA, Phillips MS, Hess JF, Chen SL, Fischer PA, Peterson LB, Wicker LS. The NOD Idd9 genetic interval influences the pathogenicity of insulitis and contains molecular variants of Cd30, Tnfr2, and Cd137. Immunity. 2000;13:107–115. doi: 10.1016/s1074-7613(00)00012-1. [DOI] [PubMed] [Google Scholar]
- 10.Hill NJ, Lyons PA, Armitage N, Todd JA, Wicker LS, Peterson LB. NOD Idd5 locus controls insulitis and diabetes and overlaps the orthologous CTLA4/IDDM12 and NRAMP1 loci in humans. Diabetes. 2000;49:1744–1747. doi: 10.2337/diabetes.49.10.1744. [DOI] [PubMed] [Google Scholar]
- 11.Robles DT, Eisenbarth GS, Dailey NJ, Peterson LB, Wicker LS. Insulin autoantibodies are associated with islet inflammation but not always related to diabetes progression in NOD congenic mice. Diabetes. 2003;52:882–886. doi: 10.2337/diabetes.52.3.882. [DOI] [PubMed] [Google Scholar]
- 12.Ghosh S, Palmer SM, Rodrigues NR, Cordell HJ, Hearne CM, Cornall RJ, Prins JB, McShane P, Lathrop GM, Peterson LB, et al. Polygenic control of autoimmune diabetes in nonobese diabetic mice. Nat Genet. 1993;4:404–409. doi: 10.1038/ng0893-404. [DOI] [PubMed] [Google Scholar]
- 13.Wicker LS, Todd JA, Prins JB, Podolin PL, Renjilian RJ, Peterson LB. Resistance alleles at two non-major histocompatibility complex-linked insulin-dependent diabetes loci on chromosome 3, Idd3 and Idd10, protect nonobese diabetic mice from diabetes. J Exp Med. 1994;180:1705–1713. doi: 10.1084/jem.180.5.1705. [DOI] [PMC free article] [PubMed] [Google Scholar]
- 14.Lyons PA, Armitage N, Argentina F, Denny P, Hill NJ, Lord CJ, Wilusz MB, Peterson LB, Wicker LS, Todd JA. Congenic mapping of the type 1 diabetes locus, Idd3, to a 780-kb region of mouse chromosome 3: identification of a candidate segment of ancestral DNA by haplotype mapping. Genome Res. 2000;10:446–453. doi: 10.1101/gr.10.4.446. [DOI] [PMC free article] [PubMed] [Google Scholar]
- 15.Yokoyama WM, Koning F, Kehn PJ, Pereira GM, Stingl G, Coligan JE, Shevach EM. Characterization of a cell surface-expressed disulfide-linked dimer involved in murine T cell activation. J Immunol. 1988;141:369–376. [PubMed] [Google Scholar]
- 16.Koo GC, Jewell ME, Manyak CL, Sigal NH, Wicker LS. Activation of murine natural killer cells and macrophages by 8-bromoguanosine. J Immunol. 1988;140:3249–3252. [PubMed] [Google Scholar]
- 17.Fernandez NC, Lozier A, Flament C, Ricciardi-Castagnoli P, Bellet D, Suter M, Perricaudet M, Tursz T, Maraskovsky E, Zitvogel L. Dendritic cells directly trigger NK cell functions: cross-talk relevant in innate anti-tumor immune responses in vivo. Nat Med. 1999;5:405–411. doi: 10.1038/7403. [DOI] [PubMed] [Google Scholar]
- 18.Gately MK, Renzetti LM, Magram J, Stern AS, Adorini L, Gubler U, Presky DH. The interleukin-12/interleukin-12-receptor system: role in normal and pathologic immune responses. Annu Rev Immunol. 1998;16:495–521. doi: 10.1146/annurev.immunol.16.1.495. [DOI] [PubMed] [Google Scholar]
- 19.Walzer T, Dalod M, Robbins SH, Zitvogel L, Vivier E. Natural-killer cells and dendritic cells: “l'union fait la force”. Blood. 2005;106:2252–2258. doi: 10.1182/blood-2005-03-1154. [DOI] [PubMed] [Google Scholar]
- 20.Ymer SI, Huang D, Penna G, Gregori S, Branson K, Adorini L, Morahan G. Polymorphisms in the Il12b gene affect structure and expression of IL-12 in NOD and other autoimmune-prone mouse strains. Genes Immun. 2002;3:151–157. doi: 10.1038/sj.gene.6363849. [DOI] [PubMed] [Google Scholar]
- 21.Todd JA, Aitman TJ, Cornall RJ, Ghosh S, Hall J, Hearne CM, Knight A, Love J, McAleer MA, Prins JB, et al. Genetic analysis of a complex, multifactorial disease, autoimmune type 1 (insulin-dependent) diabetes. Res Immunol. 1991;142:483. doi: 10.1016/0923-2494(91)90051-j. [DOI] [PubMed] [Google Scholar]
- 22.Alleva DG, Pavlovich RP, Grant C, Kaser SB, Beller DI. Aberrant macrophage cytokine production is a conserved feature among autoimmune-prone mouse strains: elevated interleukin (IL)-12 and an imbalance in tumor necrosis factor-alpha and IL-10 define a unique cytokine profile in macrophages from young nonobese diabetic mice. Diabetes. 2000;49:1106–1115. doi: 10.2337/diabetes.49.7.1106. [DOI] [PubMed] [Google Scholar]
- 23.Weaver DJ, Jr., Poligone B, Bui T, Abdel-Motal UM, Baldwin AS, Jr., Tisch R. Dendritic cells from nonobese diabetic mice exhibit a defect in NF-kappa B regulation due to a hyperactive I kappa B kinase. J Immunol. 2001;167:1461–1468. doi: 10.4049/jimmunol.167.3.1461. [DOI] [PubMed] [Google Scholar]
- 24.Trembleau S, Penna G, Bosi E, Mortara A, Gately MK, Adorini L. Interleukin 12 administration induces T helper type 1 cells and accelerates autoimmune diabetes in NOD mice. J Exp Med. 1995;181:817–821. doi: 10.1084/jem.181.2.817. [DOI] [PMC free article] [PubMed] [Google Scholar]
- 25.Poligone B, Weaver DJ, Jr., Sen P, Baldwin AS, Jr., Tisch R. Elevated NF-kappaB activation in nonobese diabetic mouse dendritic cells results in enhanced APC function. J Immunol. 2002;168:188–196. doi: 10.4049/jimmunol.168.1.188. [DOI] [PubMed] [Google Scholar]
- 26.Simpson PB, Mistry MS, Maki RA, Yang W, Schwarz DA, Johnson EB, Lio FM, Alleva DG. Cuttine edge: diabetes-associated quantitative trait locus, Idd4, is responsible for the IL-12p40 overexpression defect in nonobese diabetic (NOD) mice. J Immunol. 2003;171:3333–3337. doi: 10.4049/jimmunol.171.7.3333. [DOI] [PubMed] [Google Scholar]
- 27.Alleva DG, Kaser SB, Beller DI. Intrinsic defects in macrophage IL-12 production associated with immune dysfunction in the MRL/++ and New Zealand Black/White F1 lupus-prone mice and the Leishmania major-susceptible BALB/c strain. J Immunol. 1998;161:6878–6884. [PubMed] [Google Scholar]
- 28.Vasquez AC, Feili-Hariri M, Tan RJ, Morel PA. Qualitative and quantitative abnormalities in splenic dendritic cell populations in NOD mice. Clin Exp Immunol. 2004;135:209–218. doi: 10.1111/j.1365-2249.2003.02359.x. [DOI] [PMC free article] [PubMed] [Google Scholar]