Abstract
Heme oxygenase 1 (HO-1) is a representative mediator of antioxidants and cytoprotectants against various stress stimuli including oxidants in vascular cells. Intensive insulin treatment can delay the onset and progression of diabetic retinopathy and other vascularopathies, yet little is known about insulin regulation of anti-apoptotic and antioxidant molecules such as HO-1 in vascular cells. Intravitreous injection or in vitro addition of insulin increased HO-1 protein expression in rat retina and in cultured bovine retinal pericytes, retinal endothelial cells, and retinal pigment epithelial cells. In bovine retinal pericytes, insulin induced mRNA and protein expression of HO-1 in a time- and concentration-dependent manner. Using HO-1 promoter analysis, the luciferase reporter assay showed that induction of HO-1 expression by insulin is mediated by additional response elements in the ho-1 promoter gene, which was not responsive to antioxidants. Insulin-induced HO-1 mRNA expression through activation of PI3-kinase/Akt pathway without affecting ERK and p38 MAPK. Overexpression of an adenoviral vector of native IRS1, IRS2, and Akt dominant negative or small interfering RNA transfection of Akt1 and Akt2 targeted gene demonstrated that insulin regulated HO-1 expression via IRS1 and Akt2 pathway, selectively. Further, insulin treatment prevented H2O2-induced NF-κB and caspase-8 activation and apoptosis via the IRS1/PI3K/Akt2/HO-1 pathway in the pericytes. In conclusion, we suggest that the anti-apoptotic properties of insulin are mediated partly by increasing HO-1 expression at transcriptional level via IRS1/PI3K/Akt2 activation, a potential explanation for how insulin is retarding the progression of microvascular complications induced by diabetes.
Oxidative stress, as a result of hyperglycemia and diabetes, has been postulated to be a major metabolic abnormality causing a variety of cellular dysfunctions and vascular pathologies (1-3). Increases in oxidative stress in patients who have diabetes with poor glycemic control or insulin resistance may result from enhanced production of reactive oxygen species (ROS)3 because of metabolism of metabolites such as elevated glucose and free fatty acid levels in excess of endogenous antioxidant defense (4-6). Large clinical studies such as Diabetes Complications and Control Trial and the Epidemiology of Diabetes Interventions and Complications trials have clearly identified hyperglycemia as one of the main initiating factors of diabetic complications that can be mitigated by insulin treatment in type 1 diabetic patients (7, 8). One of the earliest and most specific histopathological findings associated with hyperglycemia and diabetic retinopathy is the selective loss of retinal capillary pericytes, probably because of apoptosis (9). Many studies have proposed that oxidative stress via elevation of glucose levels is one of the potential triggers of the increased rate of pericyte apoptosis (10, 11). Antioxidant treatments have been reported to ameliorate diabetic retinopathy by preserving retinal vascular pericytes in rodent models of diabetes (12). However, in large clinical studies, including the Heart Outcomes Prevention Study, antioxidant treatments such as vitamins C and E did not provide substantial improvement of microvascular or cardiovascular damage in individuals who had diabetes for several years (13). Thus, it is possible that in addition to normalizing hyperglycemia, insulin may directly affect the endogenous antioxidant defense to neutralize the intracellular elevation of oxidants induced by the metabolism of elevated levels of glucose or free fatty acids.
Heme oxygenase (HO) plays an important key role in regulating the intracellular heme level by catalyzing the initial and rate-limiting step of heme degradation, in which oxidative cleavage of the porphyrin ring results in formation of biliverdin, CO, and free iron (14, 15). A number of studies have demonstrated the potent antioxidant activity of biliverdin and bilirubin and the cytoprotective action of CO on vascular cells (16). To date, three isoforms of mammalian HO have been identified: HO-1, HO-2, and HO-3 (15, 17). Under physiological conditions, HO-1, the inducible 32-kDa isoform, is highly expressed in liver and spleen, whereas HO-2, the constitutive 36-kDa isoform, is expressed mainly in brain and testis. HO-3, a 33-kDa isoform that closely resembles HO-2, has been detected in many tissues including the spleen, liver, thymus, prostate, heart, kidney, brain, and testis but has very low enzyme activity compared with that of the other two isoforms (17). The HO-1 isozyme is a phase II enzyme, a member of the family of heat shock proteins, and its expression is triggered by diverse stress stimuli including hypoxia (18), heavy metals, UV radiation, ROS such as H2O2 (19), reactive nitrogen oxides such as NO (20), tumor necrosis factor-α, interleukin-1β, interferon-γ (21), and phenolic compounds such as curcumin and caffeic acid (22). The biological functions of HO-1 are thus believed to be associated with a fundamental adaptive and defensive response against oxidative and cellular stress. Indeed, inhibition of HO-1 by using HO inhibitors such as zinc protoporphyrin or tin protoporphyrin resulted in a worsening of the diseases in which these stresses operate, such as graft rejection, ischemia-reperfusion injury, cisplatin nephrotoxicity, and endotoxin-induced septic shock (23). In contrast, HO-1 inducers, such as cobalt protoporphyrin, and selective overexpression of HO-1 by genetic manipulation produced beneficial effects in cultured cells and in a variety of animal models of various diseases in brain, heart, kidney, lung, and liver (23). Accumulating evidence suggests a vital role for HO-1 in both cell growth and cell death, especially involvement of the enzymes in the regulation of apoptosis (24). Previous studies have also reported that HO-1 can serve as a downstream effecter of interleukin-10 providing evidence of potential anti-inflammatory approaches for treating diseases (25). Thus, HO-1 represents a crucial mediator of antioxidants that comprises a key component of anti-inflammatory and anti-apoptotic stress defense mechanisms documented in various tissues including heart, kidney, and brain.
HO-1 has been described to be elevated in the myocardium, glomeruli, and retina of diabetic animals as well as in diabetic patients associated with insulin resistance (26-28). Recent studies have shown increased expression of HO-1 attenuated cytokine- and glucose-mediated cell growth arrest and apoptosis in vitro and decreased endothelial cell signaling in diabetes rodent animals (29). Because intensive insulin treatment can substantially decrease the progression of vascular disease, we have characterized the effects of insulin on HO-1 expression and actions as a possible antioxidative target. Despite the increasing evidence that insulin has multiple actions on vascular cells, its effect on the regulation of HO-1 has not been studied in detail. In this study, we have evaluated the effect of insulin on HO-1 expression and its actions in cultured BRPC and dissected the signaling pathways leading to HO-1 regulation. Our results indicate that insulin activates HO-1 expression by increasing its promoter activity selectively by the IRS1/PI3K/Akt2-dependent pathway.
EXPERIMENTAL PROCEDURES
Reagents—Fetal bovine serum (FBS), Dulbecco's modified Eagle's medium (DMEM), and penicillin-streptomycin were obtained from Invitrogen. Primary antibodies for immunoblotting were obtained from commercial sources including anti-actin and anti-BAX from Santa Cruz Biotechnology Inc. (Santa Cruz, CA), anti-caspase-8, anti-phospho-Bad, anti-IRS1, phospho-Akt, phospho-ERK anti-Akt1, and anti-Akt2 from Cell Signaling (Danvers, MA), polyclonal antibody against bovine HO-1 and HO-2 from Stressgen Biotechnologies (Victoria, Canada), anti-IRS2 from Millipore (Danvers, MA), and anti-rabbit peroxidase-conjugated secondary antibody from GE Healthcare. Zinc protoporphyrin was obtained from Porphyrin Products (Logan, UT). PD98059, SB203580, wortmannin, and LY294002 were purchased from Calbiochem. All other reagents employed including bovine serum albumin (BSA) (fraction V), 2,4,6-trinitrobenzenesulfonic acid, EDTA, heparin, leupeptin, phenylmethylsulfonyl fluoride, aprotinin, leupeptin, Na3VO4, and N-acetyl cysteine (20 mm) were purchased from Sigma-Aldrich, unless otherwise stated.
Cell Culture—Fresh calf eyes were obtained from a local abattoir. Primary cultures of bovine retinal endothelial cells (BREC) and pericyte cells (BRPC) were isolated by homogenization and a series of filtration steps as described previously (30). Bovine retinal pigment epithelial cells (BRPE) were isolated by gentle scraping after the removal of the neural retina and incubation with 0.2% collagenase (31). BREC were subsequently propagated with DMEM and 10% FBS, 50 mg/liters heparin, and 50 μg/ml endothelial cell growth factor (Roche Applied Science) and grown on collagen I-coated dishes (BD Biosciences, San Jose, CA). BRPC were cultured in DMEM and 20% FBS and BRPE in DMEM and 10% FBS. The cells were cultured in 5% CO2 at 37 °C, and the media were changed every other day. BREC and BRPC were characterized for homogeneity by immunoreactivity with anti-factor VIII antibody and monoclonal antibody 3G5, respectively (32). The authenticity of BRPE was verified by the presence of pigment granules on transmission electron microscopy. BREC from passages 2-7, and BRPC and BRPE from passages 2-5 were used in these experiments. The cells remained morphologically unchanged under these conditions, as confirmed by light microscopy. Stock solution of hemin was prepared freshly in 0.05 n sodium hydroxide. BRPCs were precultured respectively in DMEM containing 0.1% BSA overnight before the induction of HO-1. HO-1 expression was induced by adding 20 μm hemin or different concentrations of insulin to the culture medium and incubating at 37 °C for various time points.
Immunoblot Analyses—The cells were stimulated with the compounds indicated after overnight starvation in 0.1% BSA. The cells were lysed in Laemmli buffer (50 mm Tris, pH 6.8, 2% SDS, and 10% glycerol) containing protease inhibitors (1 mm phenylmethylsulfonyl fluoride, 2 μg/ml aprotinin, 10 μg/ml leupeptin, 1 mm Na3VO4; Sigma). The protein amount was measured with BCA kit (Bio-Rad). The lysates (50 μg protein) were separated by SDS-PAGE, transferred to polyvinylidene difluoride membrane, and blocked with 5% skim milk. Antigens were detected using anti-rabbit horseradish peroxidase-conjugated antibody for Western blot and detected with the ECL system (GE Healthcare). Protein content quantification was performed using computer-assisted densitometry (Image-quant; GE Healthcare).
Real Time PCR Analyses—Real time PCR was performed to evaluate mRNA expressions of HO-1 in cultured BRPC. Total RNA was extracted from cultured cells with TRI-REAGENT, as described by the manufacturer and RNeasy mini kit (Qiagen). The RNA was treated with deoxyribonuclease I (Invitrogen) to remove any genomic DNA contamination. Approximately 1 μg of RNA was used to generate cDNA using SuperScript II reverse transcriptase and random hexamers (Invitrogen) at 42 °C for 60 min. PCR primers and probes were: bovine HO-1 (GenBank™ NM 001014912), forward 5′-CTTCTTCACTTTCCCCAATA-3′; reverse 5′-TCATCTCCAGAGTGTTCATG-3′; TaqMan probe 5′6FAM-CGCCAGTGCCACCAAGTTCAAGCAGCTAMRA3′. 18 S ribosomal RNA expression was used for normalization. PCR products were gel-purified, subcloned using QIA quick PCR Purification kit (Qiagen), and sequenced in both directions to confirm identity.
Luciferase Reporter Constructs and Expression Plasmids—An HO-1 luciferase reporter plasmid, HO-1-(-4045/+74), was amplified from mouse genomic DNA by PCR and subcloned into the pGL2 luciferase reporter vector (Promega, Madison, WI). This HO-1 promoter was described previously (33). HO-1-(-3527/+74), HO-1-(-2986/+74), HO-1-(-2413/+74), HO-1-(-1857/+74), HO-1-(-295/+74), HO-1-(-137/+74), HO-1-(-117/+74), HO-1-(-66/+74), and HO-1-(-35/+74) deletion mutants were generated by PCR amplification with HO-1-(-4045/+74) as the template.
Cell Transfection and Luciferase Assay—HO-1 reporter constructs were used for transient transfection assays of BRPCs as described previously (34). Briefly, BRPCs were seeded on 60-mm cell culture plates. After 24 h of incubation, the cells were 60-80% confluent. The BRPCs were cotransfected with 0.2 μg of luciferase expression plasmid and 0.05 μg of PRL-TK plasmid as normalization reference for transfection efficiency, and 0.75 μg of each expression plasmid using Lipofectamine 2000 (Invitrogen) following the instructions for the reagent. After 48 h transfection, the cells were harvested. The firefly and Renilla luciferase activities were determined by using a dual luciferase reporter assay kit (Promega) with signal detection duration of 30 s by a luminometer (Moonlight 3010; Analytical Luminescence Laboratory, San Diego CA).
siRNA Transfection—The transfection of siRNA was performed using the Amaxa basic nucleofactor kit for primary cells (Amaxa Inc., Gaithersburg, MD) and following the Amaxa guidelines. Briefly, the cells were resuspended in the basic nucleofector solution. Cell suspension (100 μl) at a density of 1-3 × 10⁵/ml mixed with 2 μg of pmax green fluorescent protein (GFP) vector plus 1 μl of 100 μm siRNA were transferred to a cuvette and nucleofected with an Amaxa nucleofector apparatus. The cells were transfected using specific pulsing parameter and were immediately transferred into wells containing 37 °C prewarmed culture medium in 6-well plates. Untreated cells and cells in nucleofector solution, without siRNA and with the application of the electroporation program, were both used as negative controls. Twenty-four hours after the electroporation, the cells were stimulated with insulin (100 nm) for 12 h and then lysed for immunoblot analyses.
Adenoviral Vector Transfection—cDNA of native IRS1 and IRS2 were generously gifted by Dr. Morris White and Dr. C. Ronald Kahn's laboratories, respectively. Dominant negative Akt was constructed by substituting Thr-308 to Ala and Ser-473 to Ala as described previously (35). Adenovirus was applied at a concentration of 1 × 10⁸ plaque-forming units/ml, and adenovirus with the same parental genome carrying GFP or LacZ gene was used as controls. Expression of each recombinant protein was confirmed by Western blot analysis, and expression was increased ∼10-fold with all constructs as compared with the cells infected with control adenovirus.
DNA Fragmentation Analysis—DNA fragmentation was measured by quantitation of cytosolic oligonucleosome-bound DNA using enzyme-linked immunosorbent assay (Roche Applied Science) according to the manufacturer's instructions. Briefly, the cells were grown in 6-well plates at a density of 1 × 10⁵ cells/well in 2 ml of DMEM and 20% FBS. After incubation with insulin (24 h) and/or H2O2 (1 h), the cells were lysed directly on the plate. The cytosolic fraction was used as antigen source in a sandwich enzyme-linked immunosorbent assay with primary anti-histone antibody coated to the microtiter plate and a secondary anti-DNA antibody coupled to peroxidase. From the absorbance values, the fragmentation in comparison with controls was calculated according to the following formula: ratio of control = 100 × (absorbance stimulated cells - absorbance blank)/(absorbance control cells - absorbance blank).
Nuclear Extract and NoShift Transcription Factor Assay—The cells were stimulated with the conditions and compounds indicated after overnight starvation in 0.1% BSA. After stimulation, the cells were washed three times with cold PBS and lysed, and nuclear-specific proteins were isolated using the NucBuster protein extraction kit (Novagen, Madison, WI) according to the manufacturer's instructions. Detection of NF-κB in the nucleus was quantified using the NoShift transcription factor assay kit (Novagen). Briefly, 20 μg of nuclear protein was incubated with biotin-labeled wild-type DNA (10 pm) alone or in combination with 10-fold molar excess biotin-labeled mutant DNA or cold wild-type DNA. The reactions were added to streptavidin-coated plates and incubated for an hour. The wells were washed three times and treated with primary antibody (anti-p65 subunit) for an hour. The wells were then washed three times and exposed with the anti-mouse secondary antibody. After five washes, 3′,5,5′-tetramethyl benzidine substrate was added, and the reaction was stopped after 15 min by the addition of 1 n HCL. The absorbance was read at 450 nm (EL808; BIO-Tek Instruments, Inc., Highland Park, VT) to quantify the nuclear NF-κB levels.
Statistical Analysis—These data were shown as the means ± S.D. for each group. Statistical analysis was performed by unpaired t test or by one-way analysis of variance followed by Tukey's test correction for multiple comparisons. All of our results were considered statistically significant at p < 0.05.
RESULTS
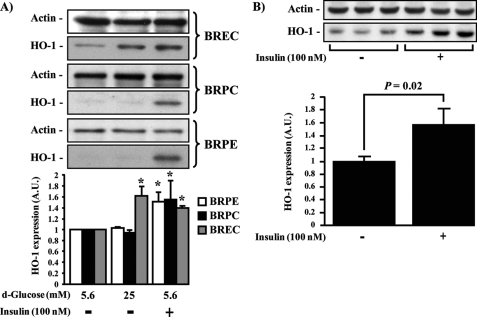
Insulin-induced HO-1 Expression in Retinal Vascular Cells in Culture and in Vivo—The effect of insulin on HO-1 expression was characterized in several retinal cells because insulin can regulate multiple biological actions in retinal endothelial cells and pericytes (36, 37). In addition, various reports have shown that insulin signaling in the retina is impaired in diabetes (38). Therefore, the effect of insulin to modulate HO-1 expression was studied in retinal vascular cells such as BRPC, BRPE, and BREC. After overnight incubation with 0.1% BSA, the cells were treated with insulin (100 nm) for a period of 6 h or in the presence of low (5.6 mm) or high glucose concentration (HG; 25 mm) for 24 h (Fig. 1A). As compared with cells exposed to low glucose, exposure to HG elevated HO-1 protein expression only in BREC by 62% (p < 0.05) but, surprisingly, not in BRPE or BRPC. In contrast to HG exposure, insulin stimulation significantly increased the protein expression of HO-1 in all retinal cell types (BRPE = 51%; BRPC = 55%; BREC = 40%; p < 0.05) (Fig. 1A). To confirm that the effect of insulin in increasing HO-1 expression has physiological significance, insulin was injected into the vitreous of Sprague-Dawley rats, increasing HO-1 protein expression in the whole retina by 57% (p = 0.02) after 24 h as compared with saline-injected retina (Fig. 1B).
FIGURE 1.
HO-1 expression in retinal vascular cells induced by insulin. A, BREC, BRPC, and BRPE were treated with low glucose (5.6 mm), HG (25 mm) for 24 h, insulin (100 nm) for 6 h. B, intravitreous injection of saline (right eye) or insulin (10 μl of 100 nm; left eye) for 24 h in Sprague-Dawley rat retina (n = 6). Expression of HO-1 was detected by Western blot analyses and normalized with actin expression. One experiment representative of three immunoblots is shown with densitometric quantitation (means ± S.D.) from three independent experiments. *, p < 0.05 versus PBS-treated cells.
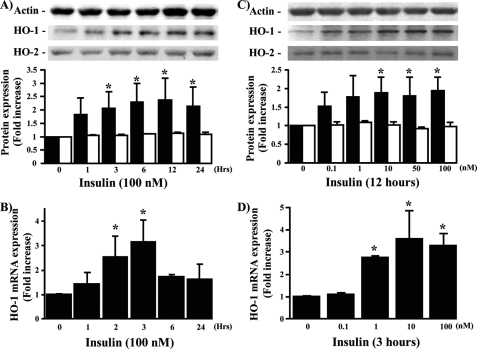
Time- and Concentration-dependent Effects of Insulin in mRNA and Protein Expression of HO-1 in BRPC—Because insulin increased HO-1 protein expression in several retinal cells, we characterized the actions of insulin in BRPC, which has been shown to be very sensitive to insulin. In addition, unlike BREC and BRPE, pericyte apoptosis has been clearly demonstrated to be a specific and consistent finding in diabetic retinopathy (39). Insulin (100 nm) increased time-dependent HO-1 mRNA and protein expression with maximum effect at 3 h (by 3-fold; p < 0.05) and 12 h (2.4-fold; p < 0.05), respectively (Fig. 2, A and B). Using these time points, the dose-response effect of insulin was also evaluated. Insulin increased HO-1 mRNA and protein expression in a dose-dependent manner with maximum effect at 10 nm by 1.8- and 3.4-fold (p < 0.05), respectively (Fig. 2, C and D). HO-2, which is constitutively expressed in the cell, was not affected by the addition of insulin (Fig. 2, A and C) or hemin (data not shown).
FIGURE 2.
Time- and dose-dependent effect of insulin on HO-1 mRNA and protein expression. BRPC were treated with insulin in a time- (A and B) and dose-dependent manner (C and D). HO-1 (black bars) and HO-2 (white bars) protein (A and C) and mRNA (B and D) expressions were measured by Western blot and RT-PCR analyses and normalized either by actin or 18 S expression. The experiments were done in triplicate, and one experiment representative of three immunoblots is shown with densitometric quantitation (means ± S.D.) from three separate experiments. *, p < 0.05 versus PBS-treated cells.
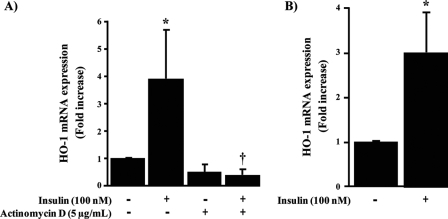
Insulin Regulates Transcriptional Activity of HO-1—The effect of insulin on HO-1 expression was further examined to determine its action on the transcriptional activities of HO-1. The results in Fig. 3A show that the elevation of HO-1 mRNA expression by insulin was completely prevented by using actinomycin D (5 μg/ml), an inhibitor of transcription (p < 0.05). Further, the effect of insulin to modulate the transcriptional level of HO-1 was characterized by measuring insulin action on the promoter activity of HO-1-(-4045/+74) luciferase reporter construct. We observed that insulin increased HO-1 promoter activity by 3-fold (p < 0.05) (Fig. 3B). These results suggest that insulin can increase HO-1 transcription by modulating the promoter activity in the 5′ sequence region of HO-1.
FIGURE 3.
Insulin regulated HO-1 transcriptional and promoter activity. BRPC were stimulated with insulin (100 nm) for 3 h with or without actimomycin D (5 μg/ml). HO-1 mRNA expression was evaluated by RT-PCR (A). BRPC were transiently transfected with luciferase reporter plasmid HO-1-(-4045/+74) (250 ng/well). After transfection, the cells were treated with vehicle or insulin (100 nm) for 24 h and then harvested for luciferase assay. The luciferase activity was plotted as fold induction compared with activity of HO-1-(-4045/+74) without insulin treatment (B). More than three independent experiments were performed. *, p < 0.05 versus PBS-treated cells; †, p < 0.05 versus insulin.
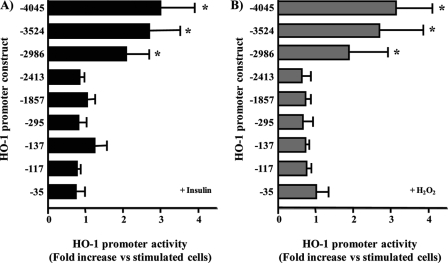
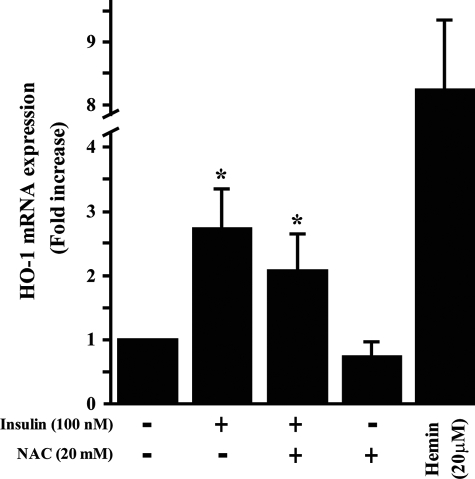
Insulin-responsive Element Is Located Downstream of bp-2986 in the HO-1 Promoter—To characterize the promoter region targeted by insulin, we analyzed the various constructs, which contained several lengths of the 5′ DNA sequence of HO-1 that have been reported in macrophage (33). The responsiveness of HO-1 construct covering -4045/+74 base of the 5′ region of HO-1 to insulin (100 nm) and H2O2 were evaluated. Both insulin and H2O2 were able to increase luciferase activation by 2.9- and 3.1-fold (p < 0.05) as compared with basal (Fig. 4). To further localize the insulin-responsive element, several sequential deletion mutants of HO-1-(-4045/+74) were transfected into BRPC and stimulated with insulin (100 nm; Fig. 4A) or H2O2 (50 μm; Fig. 4B). These data are presented as fold induction of promoter activity compared with HO-1-(-4045/+74) promoter construct in the absence of insulin or H2O2. Induction by insulin or H2O2 was similar to construct HO-1-(-4045/+74) in deletion mutants -3524 and -2986/+74 of HO-1. In contrast, deletions (including constructs HO-1-(-2413/+74), HO-1-(-1857/+74), HO-1-(-295/+74), HO-1-(-137/+74), HO-1-(-117/+74), HO-1-(-66/+74), and HO-1-(-34/+74)) showed a significant reduction in promoter activity when exposed to insulin (Fig. 4A) or H2O2 (Fig. 4B). These results suggest that critical elements for HO-1 induction by either insulin or H2O2 in the BRPC are located downstream of bp -2986 to -3524 and upstream to -2413 in the HO-1 promoter. Further analysis showed that N-acethyl cysteine, a potent antioxidant, did not prevent insulin actions on HO-1 mRNA expression (Fig. 5) but did prevent the activation of H2O2, suggesting that the mechanism and the promoter elements are different between insulin and H2O2.
FIGURE 4.
Insulin responsive site of HO-1 promoter is located downstream of bp -2986. BRPC were transiently transfected with deletion mutants of the HO-1 promoter (250 ng/well). After the transfection, the cells were treated with insulin (A, 100 nm) or H2O2 (B, 50 μm) for 24 h and then harvested. HO-1 promoter activity was calculated by comparison with the HO-1-(-4045/+74) promoter construct. *, p < 0.05 versus activity of HO-1-(-4045/+74) promoter construct stimulated with either insulin or H2O2 treatment in three separate experiments.
FIGURE 5.
HO-1 mRNA expression induced by insulin is not prevented by antioxidant. BRPC were treated with insulin (100 nm) for 3 h with or without N-acethyl cysteine (20 mm). HO-1 mRNA expression was measured by RT-PCR analyses and normalized by 18 S expression. The experiments were done in triplicate, and the data are expressed as the means ± S.D. *, p < 0.05 versus PBS-treated cells.
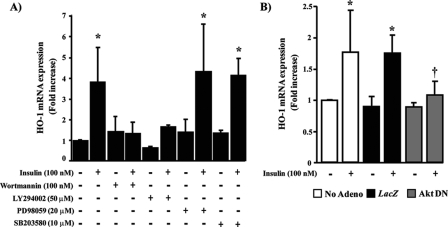
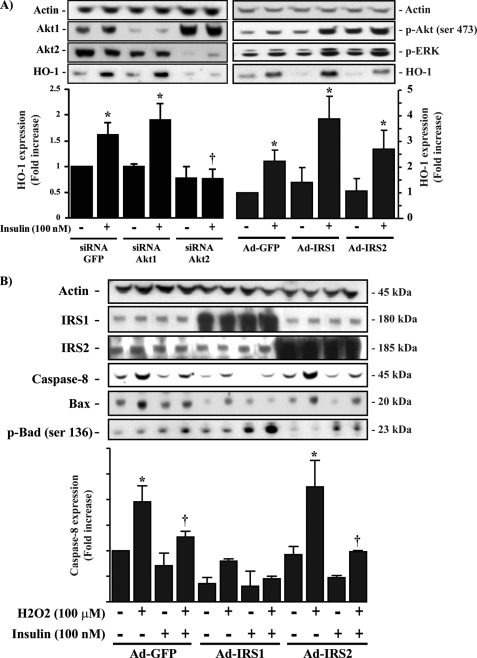
IRS1/PI3K/Akt2 Serves as a Downstream Signaling Target for the Action of Insulin on HO-1 Expression—To characterize the signaling pathway by which insulin was inducing HO-1 expression, we pretreated BRPC with specific inhibitors of PI3K, ERK, and p38 MAPK pathway. As expected, insulin exposure for 3 h increased HO-1 mRNA expression by 3.9-fold (p < 0.05) as compared with untreated cells. When the cells were pretreated with PI3K inhibitors, wortmannin, or LY294002, the effect of insulin on HO-1 expression was completely abrogated (Fig. 6A). In contrast, inhibitors of ERK and p38 MAPK did not affect insulin action on HO-1 mRNA expression (Fig. 6A). These results suggested that insulin induced HO-1 expression through activation of PI3K pathway. To determine the role of specific Akt in insulin action on HO-1 expression, we overexpressed adenoviral vector of control LacZ or dominant negative construct of Akt. The results showed that control LacZ-overexpressed cells responded identically to insulin-induced HO-1 mRNA expression as nontransfected cells. However, overexpression of an adenoviral vector containing dominant negative of Akt in BRPC inhibited insulin action by 95% (p < 0.05) to promote HO-1 expression (Fig. 6B). Transfection of BRPC with specific siRNA of Akt1 and Akt2 reduced protein expression of Akt1 and Akt2 by 65 and 75%, respectively (Fig. 7A). Using the same siRNA of Akt1 and Akt2 to reduce their protein expressions, we were able to demonstrate that increased HO-1 expression by exposure of insulin for 12 h was only abrogated significantly in Akt2 siRNA transfected cells by 100% (p < 0.05) as compared with GFP control but not with Akt1 siRNA transfected cells (Fig. 7A). These results indicated that insulin promotes HO-1 expression via activation of Akt2 signaling pathway. In another set of experiments, we overexpressed wild-type IRS1 or IRS2 adenoviral vector in the pericytes. The results showed that overexpression of IRS1, but not IRS2, further increased HO-1 protein expression by insulin (Fig. 7A) and also prevented completely H2O2-induced pro-apoptotic markers such as caspase-8 and BAX expression (p < 0.05) (Fig. 7B). Insulin, via IRS1 activation, increased the phosphorylation of Bad by 3-fold (p < 0.01), which will bind to BAX and consequently prevent BAX association to Bcl-2. Interestingly, the overexpression of IRS1 and IRS2 enhanced the phosphorylation of Akt and ERK similarly, unlike their actions to HO-1 expression, suggesting that the differentiation of insulin signaling to regulate HO-1 occurs in steps downstream from Akt activation.
FIGURE 6.
PI3K serves as a downstream target for insulin on HO-1 mRNA expression. BRPC were treated with insulin (100 nm) for 3 h with or without PI3K inhibitors (wortmannin and LY294002), ERK inhibitor (PD98059), or p38 MAPK inhibitor (SB203580) (A). The cells were infected with adenoviral vector of Akt dominant negative or LacZ control and then stimulated with insulin (100 nm) for 3 h. HO-1 mRNA expression was measured by RT-PCR analyses and normalized by 18 S expression. The experiments were done in triplicate, and the data are expressed as the means ± S.D. *, p < 0.05 versus PBS-treated cells; †, p < 0.05 versus insulin.
FIGURE 7.
HO-1 expression induced by insulin is mediated through IRS1/Akt2 isoform. BRPC were transfected with specific Akt1, Akt2, siRNAs, Ad-IRS1, Ad-IRS2, or control siRNAs and GFP adenovirus, treated in the presence or absence of 100 nm of insulin for 12 h and then exposed to H2O2 (50 μm) for 1 h as described under “Experimental Procedures.” The expression of HO-1, Akt-1, Akt-2, phospho-Akt, phospho-ERK (A), IRS1, IRS2, caspase-8, BAX, and phospho-Bad (B) was detected by Western blot analyses and normalized with actin expression. One experiment representative of three immunoblots is shown with densitometric quantitation (means ± S.D.) from three separate experiments. *, p < 0.05 versus PBS-treated cells.
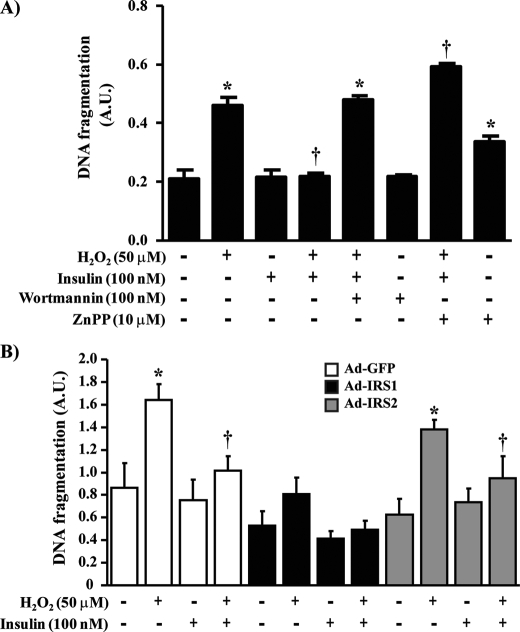
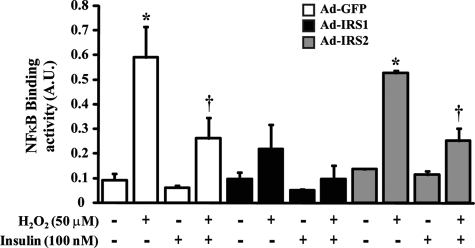
Insulin Prevents DNA Fragmentation and NF-κB Binding Activity Induced by H2O2 in BRPC—Oxidative stress has been implicated in the apoptosis of BRPC in diabetes. Because insulin can increase the expression of HO-1, we evaluated the effects of insulin to prevent DNA fragmentation when exposed to H2O2 in pericytes. As compared with untreated cells, insulin did not affect pericyte apoptosis at the basal state (Fig. 8A). Exposure of pericyte to H2O2 increased DNA fragmentation by 2.2-fold (p < 0.001) (Fig. 8A). Stimulation with insulin prior to H2O2 treatment prevented H2O2-induced pericyte apoptosis in BRPC by 96% (p < 0.001). The anti-apoptotic effects of insulin are dependent to PI3K pathway because pretreatment of BRPC with wortmannin blocked insulin inhibitory actions by 99% (p < 0.001) on pericyte apoptosis induced by H2O2 (Fig. 8A). Inhibition of HO-1 alone increased DNA fragmentation in nonstimulated cells and exacerbated H2O2 effects (2.86-fold; p < 0.001) while completely preventing insulin action (Fig. 8A). Overexpression of IRS1 confirmed previous findings and diminished pro-apoptotic marker expression. IRS1-overexpressed cells exhibited significant reduction, when exposed to H2O2 alone or with insulin, in DNA fragmentation as compared with control GFP-overexpressed cells by 102 and 105%, respectively (p < 0.05) (Fig. 8B). No significant change was noted in IRS2-overexpressed cells as compared with control GFP (Fig. 8B). In oxidative stress conditions, NF-κB has been shown to up-regulate many pro-apoptotic molecules. In our studies, we demonstrated that control GFP-overexpressed cells, exposed to H2O2, exhibited increases of NF-κB binding activity by 5.31-fold (p < 0.001) (Fig. 9). Insulin-decreased NF-κB binding activity induced by H2O2 by 55% (p < 0.05). In IRS1-overexpressed cells, the capacity of H2O2 to increase NF-κB was reduced by 63% as compared with control GFP cells. Furthermore, insulin treatment completely prevented H2O2-induced NF-κB action (p < 0.01) (Fig. 9). In contrast, overexpression of IRS2 by Ad-IRS2 did not differ significantly from cells injected with Ad-GFP.
FIGURE 8.
Insulin prevents pericyte apoptosis induced by H2O2 via IRS1/PI3K pathway. BRPC were seeded in a 6-well culture plate, incubated with insulin (100 nm) in absence or presence of wortmannin (100 nm) or zinc protoporphyrin (10 μm), and then treated with H2O2 for 1 h as described under “Experimental Procedures” (A). BRPC were transfected with control GFP, wild-type IRS1 or IRS2, and exposed to insulin and/or H2O2 (B). DNA fragmentation was measured according to the manufacturer's instructions. Each value was normalized by the untreated cell response. The results are shown as the means ± S.D. of three independent experiments. *, p < 0.01 versus PBS-treated cells; †, p < 0.05 versus H2O2.
FIGURE 9.
Reduction of NF-κB binding activity induced by H2O2 by insulin through IRS1. BRPC were seeded in a 6-well culture plate, transfected with control GFP, wild-type IRS1, or IRS2, incubated in the absence or presence of insulin (100 nm) for 12 h, and then exposed to H2O2 for 1 h as described under “Experimental Procedures.” NF-κB binding activity assay was performed according to the manufacturer's instructions as described under “Experimental Procedures.” The results are shown as the means ± S.D. of three independent experiments. *, p < 0.001 versus PBS-treated cells; †, p < 0.01 versus H2O2.
DISCUSSION
Reactive oxygen species, which are produced as by-products of normal metabolism, are capable of causing cellular damage, leading to cell death and tissue injury. Mammalian cells are equipped with both enzymatic and nonenzymatic antioxidant defense mechanisms to minimize the cellular damage resulting from interactions between cellular constituents and ROS (40). Diabetic patients have a high risk of developing vascular diseases. Hyperglycemia leads to significant cellular metabolic changes, which are postulated to initiate the sequence of events causing pathological changes, partly because of oxidative stress in the small vessels (41). Clinical studies have clearly demonstrated that intensive glycemic control by insulin and other medical interventions can reduce major microvascular events in diabetes (7). In addition to normalizing glycemic control, there is a great deal of data supporting the idea that insulin has direct vasotropic actions. The aim of our study was to investigate whether insulin mediates some of its vasotropic actions by regulating the expression of antioxidant molecules HO-1 and prevents cellular apoptosis induced by oxidants such as H2O2.
HO-1 expression is commonly elevated in oxidative and inflammatory environment (19, 25). An overwhelming body of evidence indicates that the heme-HO system is intrinsically involved in the regulation of many physiological and pathophysiological processes, including diabetes (27, 28). Hyperglycemia may also enhance retinal ROS production causing cell damage and death. In our study, exposure of HG in retinal vascular cell only increased HO-1 expression in BREC but not in BRPE or BRPC. Many factors can explain these results. HG-induced oxidants and elevation of HO-1 expression response in EC occurred generally within a short exposure as compared with BRPE or BRPC. In our study, we only exposed cells for 18 h with HG. It is believed that the majority of metabolic changes induced by HG in pericytes require longer exposure (more than 3 days).4 However, it is also possible that these data suggest there are differences in the amount of ROS being generated in BRPE and BRPC versus BREC, indicating the importance of oxidative stress as an inciting factor for vascular diseases in diabetes that may be cell-dependent. These results have provided strong support that insulin can regulate HO-1 in a physiological manner. Insulin significantly increased HO-1 protein expression in retina after intravitreous injection and in all retinal vascular cells (BREC, BRPE, and BRPC). Interestingly, insulin was previously reported to not only activate NO formation but also to enhance expression of ferritin, a secondary antioxidant protein that is often induced in tandem with HO-1 (22). Insulin has been reported to induce HO-1 expression in renal cells. Other growth factors such as transforming growth factor-β, but not basic fibroblast growth factor, platelet-derived growth factor, transforming growth factor-α, insulin-like growth factor-1, and epidermal growth factor, have been reported to increase HO-1 mRNA and protein expression in BRPE in a time- and dose-dependent manner (42). Our findings characterized insulin action on HO-1 regulation in detail, demonstrating that insulin increased HO-1 mRNA and protein expression in BRPC in a time- and dose-dependent manner with maximum effects at 3 and 12 h, respectively, without affecting HO-2 mRNA and protein expression. A question can also be raised regarding the physiological importance of insulin actions because most of the cellular studies were performed using 100 nm. However, the expression studies of HO-1 required incubation times of 3-10 h, which may allow most of the insulin in the media to degrade. Multiple lines of data support insulin action to increase HO-1 expression as being physiologically important. The effect of insulin was significant at 1 nm, clearly indicating again the physiological importance of the findings, which has been confirmed by the intravitreous injection studies. The increase of HO-1 induced by insulin is also comparable with HG levels and H2O2 (50 μm), which again supports the postulate that this effect of insulin is both biologically and physiologically significant.
In contrast to HO-2, HO-1 is regulated at the gene transcription level. Two enhancer regions located 4 and 10 kb upstream from the transcription start site have been shown to play a role in the induction of HO-1 by LPS in macrophages (43). However, deletion of the -10 kb enhancer does not decrease HO-1 promoter activity; instead it further increases its activity in the presence of the -4kb enhancer only, suggesting that some negative regulatory elements are present in the upstream region of HO-1 (44). Therefore, we focused our interest in the -4-kb enhancer region of the HO-1 promoter. Luciferase assay showed that insulin induced HO-1 (-4045/+74) promoter activity by 3-fold (Fig. 3B). Transfection of deletion constructs removing the -4 kb enhancer region did not show a reduction in promoter activity after stimulation with insulin or H2O2 in BRPC. In fact, the deletion mutants down to construct HO-1-(-2986/+74) maintained an activity analogous to that construct HO-1-(-4045/+74), which exhibited the greatest response to insulin. Further deletion constructs (HO-1-(-2413/+74), HO-1-(-1857/+74), HO-1-(-295/+74), HO-1-(-137/+74), HO-1-(-117/+74), HO-1-(-66/+74), and HO-1-(-34/+74)) showed a significant reduction in promoter activity when exposed to both insulin and H2O2. Analysis of the promoter sequence revealed that stress-responsive elements, which are present in multiple copies in murine enhancers (-3885/-3876; -3937/-3928; -3983/-3974) and spatially and structurally well conserved among mouse, rat, and human ho-1 genes, are functionally similar to antioxidant response elements (23). Previous studies demonstrated that NF-E2-related factor 2 (Nrf2) regulates induction of HO-1 by stimuli such as heme and antioxidants (45). However, in our data, insulin-induced HO-1 promoter activity may not correspond to the same response element as Nrf2 because insulin action on HO-1 mRNA expression remained unaffected by the use of the antioxidant N-acethyl cysteine. This finding is in contrast to previous reports supporting the possibility that Nrf2 is a potential transcriptional factor for insulin-promoted HO-1 in renal cells (46). Factors such as the cell type, dose used, and time of exposure may explain the difference between our results and previous studies. Clearly, our studies were not precise enough to identify the 5′ DNA-responsive element or to show that Nrf2 is not involved. More precise and detailed studies will be needed to identify the responsive element for insulin in the region of HO-1.
The mechanisms by which insulin promotes HO-1 levels in pericytes were further analyzed using PI3K/Akt, ERK, and p38 MAPK inhibitors because these signaling pathways have been reported to regulate HO-1 induction. A previous report observed that the PI3K pathway mediates HO-1 expression by carnosal, a polyphenol isolated from the herb rosemary (33, 45). It is reported that oxidative stress can activate MAPK pathways to induce the ho-1 gene. Cadmium, a stress inducer compound, enhanced HO-1 levels that involve p38 MAPK activity (47). Moreover, inhibition of p38 MAPK reduces HO-1 expression following carnosal (45) and diallyl sulfide treatment (48), although an earlier study found that p38 inhibition had no effect on HO-1 mRNA expression following cadmium, arsenate, or hemin treatment (49). Our results showed that inhibition of PI3K/Akt pathway, but not the ERK or p38 MAPK cascade, prevents insulin action on HO-1 expression in BRPC. Further, using specific siRNA of Akt1 and Akt2 to knock down the expressions of each Akt isoforms, we demonstrated for the first time that insulin induced HO-1 expression selectively via Akt2 isoform. Even more interestingly, in addition to Akt2, insulin action to increase HO-1 expression in retinal pericytes is also selective for IRS1 but not for IRS2. However, the effects of insulin on the phosphorylate for Akt and ERK were enhanced equally among control of Ad-IRS1- or 2-infected cells. Differentiation of IRS1 and IRS2 actions on HO-1 expression and apoptosis appears to occur after the activation of Akt because both were able to increase the activation of Akt equally in pericytes. The exhibition of differential effects between IRS1 and IRS2 occurs in many types of cells including liver, retina, brain, and others (53, 54). IRS1 appears to mediate rapid metabolic actions in the cells, whereas IRS2 may mediate more prolonged actions of the cells (53, 54). It is possible that the differential effects of IRS1 and IRS2 on HO-1 expression could be due to differences in subcellular location of the signaling pathways induced by the second messengers of insulin receptors in the pericytes. Further studies will be needed to identify the post-Akt steps, which are differentially activated by IRS1/2 to cause the changes in HO-1 and apoptosis in pericytes. Insulin dose of 100 nm could also activate the insulin-like growth factor-1 receptor. However, our data clearly indicate that IRS1 involvement suggests that insulin is the mediator of HO-1 induction in our model.
HO-1 has been described as a protein capable of cytoprotection via radical scavenging and apoptosis prevention. The up-regulation of HO-1 to promote survival of Mueller cells after ischemia-reperfusion injury has been reportedly caused by decreasing infiltration of inflammatory cells and destruction of the retina (50). Thus, insulin action on HO-1 induction may represent a potential mechanism to prevent pericyte loss. Our data showed that exposure to oxidant generator H2O2 increased DNA fragmentation in pericytes. Treatment with insulin abrogated the effect of H2O2 on pericyte apoptosis, and these beneficial actions of insulin are also mediated via IRS1/PI3K/Akt1 pathway and HO-1. Previous work demonstrated that insulin possessed free radical scavenging properties preserving the integrity of the vascular wall because of its capacity to protect cardiomyocytes from the deleterious effects of H2O2 (51). Because intensive glycemic treatment in clinical trials using insulin can delay the progression of retinopathy and other microvascular pathologies in type 1 diabetic patients, the loss of the direct vasotropic actions of insulin may increase the risks of developing retinal disease in type 1 diabetic patients (52). Thus, our results suggest the possibility that the beneficial effect of insulin may be attributed to its capacity to increase HO-1 expression to prevent excessive cellular apoptosis of pericytes, an early and specific histopathological finding of diabetic retinopathy.
This work was supported, in whole or in part, by National Institutes of Health Grants 5 R01 DK053105-09A1 and NEI 5 R01 EY016150-02 (to G. L. K.), Grant P30 DK36836, and Grant R01HL60788 (to M. A. P.). This work was also supported by American Diabetes Association Research Grant 1-08-RA-93. The costs of publication of this article were defrayed in part by the payment of page charges. This article must therefore be hereby marked “advertisement” in accordance with 18 U.S.C. Section 1734 solely to indicate this fact.
Footnotes
The abbreviations used are: ROS, reactive oxygen species; HO, heme oxygenase; BRPC, bovine retinal pericytes; ZnPP, zinc protoporphyrin; FBS, fetal bovine serum; DMEM, dulbecco's modified eagle's medium; BSA, bovine serum albumin; BREC, bovine retinal endothelial cells; BRPE, bovine retinal pigment epithelial cells; GFP, green fluorescence protein; IRS, insulin receptor substrate; NF-κB, nuclear factor-kappa B; HG, high glucose concentration; ERK, extracellular signal-regulated kinase; MAPK, mitogen-activated protein kinase; PI3K, phosphoinositide 3-kinase; Nrf2, NF-E2-related factor 2; siRNA, small interfering RNA; PBS, phosphate-buffered saline; RT, reverse transcription.
P. Geraldes and G. L. King, unpublished observations.
References
- 1.Duckworth, W. C. (2001) Curr. Atherosclerosis Rep. 3 383-391 [DOI] [PubMed] [Google Scholar]
- 2.Giugliano, D., Ceriello, A., and Paolisso, G. (1996) Diabetes Care 19 257-267 [DOI] [PubMed] [Google Scholar]
- 3.Egan, B. M., Greene, E. L., and Goodfriend, T. L. (2001) Am. J. Hypertens. 14 116S-125S [DOI] [PubMed] [Google Scholar]
- 4.Brownlee, M. (2001) Nature 414 813-820 [DOI] [PubMed] [Google Scholar]
- 5.Boden, G., and Shulman, G. I. (2002) Eur. J. Clin. Investig. 32 (Suppl. 3) 14-23 [DOI] [PubMed] [Google Scholar]
- 6.Itani, S. I., Ruderman, N. B., Schmieder, F., and Boden, G. (2002) Diabetes 51 2005-2011 [DOI] [PubMed] [Google Scholar]
- 7.Author, A. B. and the DCCT Research Group (1993) N. Engl. J. Med. 329 977-9868366922 [Google Scholar]
- 8.The Diabetes Control and Complications Trial Research Group (2000) N. Engl. J. Med. 342 381-38910666428 [Google Scholar]
- 9.Kuwabara, T., and Cogan, D. G. (1963) Arch. Ophthalmol. 69 492-502 [DOI] [PubMed] [Google Scholar]
- 10.Kim, J., Kim, K. S., Shinn, J. W., Oh, Y. S., Kim, H. T., Jo, I., and Shinn, S. H. (2002) Biochem. Biophys. Res. Commun. 292 1010-1016 [DOI] [PubMed] [Google Scholar]
- 11.Mustata, G. T., Rosca, M., Biemel, K. M., Reihl, O., Smith, M. A., Viswanathan, A., Strauch, C., Du, Y., Tang, J., Kern, T. S., Lederer, M. O., Brownlee, M., Weiss, M. F., and Monnier, V. M. (2005) Diabetes 54 517-526 [DOI] [PubMed] [Google Scholar]
- 12.Kowluru, R. A. (2001) Acta Diabetol. 38 179-185 [DOI] [PubMed] [Google Scholar]
- 13.Gerstein, H. C., Bosch, J., Pogue, J., Taylor, D. W., Zinman, B., and Yusuf, S. (1996) Diabetes Care 19 1225-1228 [DOI] [PubMed] [Google Scholar]
- 14.Maines, M. D. (1988) FASEB J. 2 2557-2568 [PubMed] [Google Scholar]
- 15.Shibahara, S. (1988) Semin. Hematol. 25 370-376 [PubMed] [Google Scholar]
- 16.Stocker, R., Yamamoto, Y., McDonagh, A. F., Glazer, A. N., and Ames, B. N. (1987) Sciences (N. Y.) 235 1043-1046 [DOI] [PubMed] [Google Scholar]
- 17.McCoubrey, W. K., Jr., Huang, T. J., and Maines, M. D. (1997) Eur. J. Biochem. 247 725-732 [DOI] [PubMed] [Google Scholar]
- 18.Motterlini, R., and Macdonald, V. W. (1993) J. Appl. Physiol. 75 2224-2233 [DOI] [PubMed] [Google Scholar]
- 19.Keyse, S. M., and Tyrrell, R. M. (1989) Proc. Natl. Acad. Sci. U. S. A. 86 99-103 [DOI] [PMC free article] [PubMed] [Google Scholar]
- 20.Hara, E., Takahashi, K., Takeda, K., Nakayama, M., Yoshizawa, M., Fujita, H., Shirato, K., and Shibahara, S. (1999) Biochem. Pharmacol. 58 227-236 [DOI] [PubMed] [Google Scholar]
- 21.Willis, D., Moore, A. R., Frederick, R., and Willoughby, D. A. (1996) Nat. Med. 2 87-90 [DOI] [PubMed] [Google Scholar]
- 22.Immenschuh, S., and Ramadori, G. (2000) Biochem. Pharmacol. 60 1121-1128 [DOI] [PubMed] [Google Scholar]
- 23.Ryter, S. W., Alam, J., and Choi, A. M. (2006) Physiol. Rev. 86 583-650 [DOI] [PubMed] [Google Scholar]
- 24.Wagner, M., Cadetg, P., Ruf, R., Mazzucchelli, L., Ferrari, P., and Redaelli, C. A. (2003) Kidney Int. 63 1564-1573 [DOI] [PubMed] [Google Scholar]
- 25.Lee, T. S., and Chau, L. Y. (2002) Nat. Med. 8 240-246 [DOI] [PubMed] [Google Scholar]
- 26.Farhangkhoee, H., Khan, Z. A., Mukherjee, S., Cukiernik, M., Barbin, Y. P., Karmazyn, M., and Chakrabarti, S. (2003) J. Mol. Cell. Cardiol. 35 1439-1448 [DOI] [PubMed] [Google Scholar]
- 27.Hayashi, K., Haneda, M., Koya, D., Maeda, S., Isshiki, K., and Kikkawa, R. (2001) Diabetes Res. Clin. Pract. 52 85-96 [DOI] [PubMed] [Google Scholar]
- 28.Cukiernik, M., Mukherjee, S., Downey, D., and Chakabarti, S. (2003) Curr. Eye Res. 27 301-308 [DOI] [PubMed] [Google Scholar]
- 29.Abraham, N. G., Kushida, T., McClung, J., Weiss, M., Quan, S., Lafaro, R., Darzynkiewicz, Z., and Wolin, M. (2003) Circ. Res. 93 507-514 [DOI] [PubMed] [Google Scholar]
- 30.King, G. L., Goodman, A. D., Buzney, S., Moses, A., and Kahn, C. R. (1985) J. Clin. Investig. 75 1028-1036 [DOI] [PMC free article] [PubMed] [Google Scholar]
- 31.King, G. L., Berman, A. B., Bonner-Weir, S., and Carson, M. P. (1987) Diabetes 36 1460-1467 [DOI] [PubMed] [Google Scholar]
- 32.Lindahl, P., Johansson, B. R., Leveen, P., and Betsholtz, C. (1997) Sciences 277 242-245 [DOI] [PubMed] [Google Scholar]
- 33.Chung, S. W., Chen, Y. H., and Perrella, M. A. (2005) J. Biol. Chem. 280 4578-4584 [DOI] [PubMed] [Google Scholar]
- 34.Sekine, O., Nishio, Y., Egawa, K., Nakamura, T., Maegawa, H., and Kashiwagi, A. (2002) J. Biol. Chem. 277 36631-36639 [DOI] [PubMed] [Google Scholar]
- 35.Kitamura, T., Ogawa, W., Sakaue, H., Hino, Y., Kuroda, S., Takata, M., Matsumoto, M., Maeda, T., Konishi, H., Kikkawa, U., and Kasuga, M. (1998) Mol. Cell. Biol. 18 3708-3717 [DOI] [PMC free article] [PubMed] [Google Scholar]
- 36.Bronson, S. K., Reiter, C. E., and Gardner, T. W. (2003) J. Clin. Investig. 111 1817-1819 [DOI] [PMC free article] [PubMed] [Google Scholar]
- 37.Kobayashi, T., and Puro, D. G. (2007) Investig. Ophthalmol. Vis. Sci. 48 2350-2355 [DOI] [PubMed] [Google Scholar]
- 38.Reiter, C. E., Wu, X., Sandirasegarane, L., Nakamura, M., Gilbert, K. A., Singh, R. S., Fort, P. E., Antonetti, D. A., and Gardner, T. W. (2006) Diabetes 55 1148-1156 [DOI] [PubMed] [Google Scholar]
- 39.Hammes, H. P. (2005) Horm. Metab. Res. 37 (Suppl. 1) 39-43 [DOI] [PubMed] [Google Scholar]
- 40.Cross, C. E., Halliwell, B., Borish, E. T., Pryor, W. A., Ames, B. N., Saul, R. L., McCord, J. M., and Harman, D. (1987) Ann. Intern. Med. 107 526-545 [DOI] [PubMed] [Google Scholar]
- 41.Rolo, A. P., and Palmeira, C. M. (2006) Toxicol. Appl. Pharmacol. 212 167-178 [DOI] [PubMed] [Google Scholar]
- 42.Kutty, R. K., Nagineni, C. N., Kutty, G., Hooks, J. J., Chader, G. J., and Wiggert, B. (1994) J. Cell. Physiol. 159 371-378 [DOI] [PubMed] [Google Scholar]
- 43.Camhi, S. L., Alam, J., Wiegand, G. W., Chin, B. Y., and Choi, A. M. (1998) Am. J. Respir. Cell Mol. Biol. 18 226-234 [DOI] [PubMed] [Google Scholar]
- 44.Pugazhenthi, S., Akhov, L., Selvaraj, G., Wang, M., and Alam, J. (2007) Am. J. Physiol. 293 E645-E655 [DOI] [PubMed] [Google Scholar]
- 45.Martin, D., Rojo, A. I., Salinas, M., Diaz, R., Gallardo, G., Alam, J., De Galarreta, C. M., and Cuadrado, A. (2004) J. Biol. Chem. 279 8919-8929 [DOI] [PubMed] [Google Scholar]
- 46.Harrison, E. M., McNally, S. J., Devey, L., Garden, O. J., Ross, J. A., and Wigmore, S. J. (2006) FEBS J. 273 2345-2356 [DOI] [PubMed] [Google Scholar]
- 47.Alam, J., Wicks, C., Stewart, D., Gong, P., Touchard, C., Otterbein, S., Choi, A. M., Burow, M. E., and Tou, J. (2000) J. Biol. Chem. 275 27694-27702 [DOI] [PubMed] [Google Scholar]
- 48.Gong, P., Hu, B., and Cederbaum, A. I. (2004) Arch. Biochem. Biophys. 432 252-260 [DOI] [PubMed] [Google Scholar]
- 49.Masuya, Y., Hioki, K., Tokunaga, R., and Taketani, S. (1998) J. Biochem. 124 628-633 [DOI] [PubMed] [Google Scholar]
- 50.Arai-Gaun, S., Katai, N., Kikuchi, T., Kurokawa, T., Ohta, K., and Yoshimura, N. (2004) Investig. Ophthalmol. Vis. Sci. 45 4226-4232 [DOI] [PubMed] [Google Scholar]
- 51.Aikawa, R., Nitta-Komatsubara, Y., Kudoh, S., Takano, H., Nagai, T., Yazaki, Y., Nagai, R., and Komuro, I. (2002) Cytokine 18 179-183 [DOI] [PubMed] [Google Scholar]
- 52.Selby, J. V., FitzSimmons, S. C., Newman, J. M., Katz, P. P., Sepe, S., and Showstack, J. (1990) J. Am. Med. Assoc. 263 1954-1960 [PubMed] [Google Scholar]
- 53.Kubota, N., Kubota, T., Itoh, S., Kumagai, H., Kozono, H., Takamoto, I., Mineyama, T., Ogata, H., Tokuyama, K., Ohsugi, M., Sasako, T., Moroi, M., Sugi, K., Kakuta, S., Iwakura, Y., Noda, T., Ohnishi, S., Nagai, R., Tobe, K., Terauchi, Y., Ueki, K., and Kadowaki, T. (2008) Cell Metab. 8 49-64 [DOI] [PubMed] [Google Scholar]
- 54.Selman, C., Lingard, S., Choudhury, A. I., Batterham, R. L., Claret, M., Clements, M., Ramadani, F., Okkenhaug, K., Shuster, E., Blanc, E., Peper, M. D., Al-Qassab, H., Speakman, J. R., Carmignac, D., Robinson, I. C., Thornton, J. M., Gems, D., Partridge, L., and Withers, D. J. (2008) FASEB J. 22 807-818 [DOI] [PubMed] [Google Scholar]


