Abstract
It has been known for decades that red light pretreatment has complex effects on subsequent phototropic sensitivity of etiolated seedlings. Here, we demonstrate that brief pulses of red light given 2 h prior to phototropic induction by low fluence rates of blue light prevent the blue light–induced loss of green fluorescent protein–tagged phototropin 1 (PHOT1-GFP) from the plasma membrane of cortical cells of transgenic seedlings of Arabidopsis thaliana expressing PHOT1-GFP in a phot1-5 null mutant background. This red light effect is mediated by phytochrome A and requires ∼2 h in the dark at room temperature to go to completion. It is fully far red reversible and shows escape from photoreversibility following 30 min of subsequent darkness. Red light–induced inhibition of blue light–inducible changes in the subcellular distribution of PHOT1-GFP is only observed in rapidly elongating regions of the hypocotyl. It is absent in hook tissues and in mature cells below the elongation zone. We hypothesize that red light–induced retention of the PHOT1-GFP on the plasma membrane may account for the red light–induced increase in phototropic sensitivity to low fluence rates of blue light.
INTRODUCTION
Plants use light as an essential environmental cue. In the course of evolution they have acquired the capacity to respond to changes in light spectral quality, light intensity, light duration, and light direction. These responses regulate developmental and physiological processes in ways that maximize their photosynthetic potential and minimize the possibility of photodamage under unfavorable conditions. To this end, they use a remarkable array of known or putative photoreceptors. In the model plant Arabidopsis thaliana, there are five phytochromes, three cryptochromes, two phototropins, three members of the ZEITLUPE/ADAGIO family (one of them still a putative photoreceptor), and additional putative photoreceptors for both UV-B and green light. These photoreceptors can act alone, in a cooperative fashion, or in an antagonistic fashion depending on prevailing conditions and developmental stage (see Schäfer and Nagy, 2006). However, we know little about how these interactions might occur and at what level. Phototropism provides us with one of the very first interactions investigated: an interaction between one or more phytochromes and a blue light receptor.
It has been know for over half a century that red light treatment of etiolated seedlings can dramatically alter their subsequent phototropic sensitivity (Briggs, 1963a). Curry (1957) first noted that red light strongly reduced the sensitivity of first positive and first negative curvature of oat (Avena sativa) coleoptiles to unilateral blue light, an effect confirmed by Briggs (1963a) for both maize (Zea mays) and oat coleoptiles. Zimmerman and Briggs (1963) showed that red light treatment decreased phototropic sensitivity for first positive curvature of oat coleoptiles to blue light by a factor of about 10 but simultaneously increased the sensitivity of second positive curvature by a factor of about three. Briggs (1963a) provides a detailed review of these early experiments.
Chon and Briggs (1966) subsequently demonstrated the same complex red light effect for maize coleoptiles and showed that it could be reversed by low fluences of far-red light. Higher fluences of far-red light, by contrast, mimicked the effect of red light, a phenomenon likely mediated by a phyA-activated high-irradiance response (Bae and Choi, 2008). The extreme sensitivity of the system to red light also implicated a phyA-mediated response in the very low fluence response range (Mandoli and Briggs, 1981).
The response to red light in either maize or oat is not immediate. Although it starts with little lag, it does not reach its maximum effect for between 1 to 2 h either in continuous red light (Briggs, 1963a, maize and oat coleoptiles; Zimmerman and Briggs, 1963, oat coleoptiles) or following a red light pulse (Chon and Briggs, 1966, maize coleoptiles). Briggs (1963b) also noted that continuous red light treatment reduced the total amount of auxin transported from maize coleoptile tips into agar blocks to ∼50% of the dark control level. Thus, red light was either reducing auxin synthesis or auxin transport, or increasing auxin destruction, or some combination of the three processes. The decrease followed the same time course as the red light–induced changes in phototropic sensitivity. However, except for the temporal correlation, the physiological relationship between the light-induced changes in auxin levels and phototropic sensitivity was unclear.
It was over a quarter of a century later that the Poff laboratory did the first experiments on phototropism with the model plant Arabidopsis, describing mutants that showed impaired phototropic responses (Khurana and Poff, 1989). Two years later, Janoudi and Poff (1991) reported that blue light alone, given either from above or bilaterally, desensitized etiolated hypocotyls of seedlings to unilateral phototropic stimulation with blue light, followed by a refractory period of insensitivity to blue light that lasted between 10 and 20 min. Pretreatment with red light did not cause the desensitization, but either blue or red light pretreatment from above enhanced the subsequent phototropic response to unilateral blue light (an enhancement seen only after the recovery from desensitization if the preirradiation was with blue light).
Second positive curvature in dark-grown seedlings is induced only after a certain time threshold of unilateral blue light stimulation in dark-grown seedlings. Janoudi et al. (1992) showed that this time threshold (15 min of blue light stimulation for Arabidopsis and 60 min for tobacco [Nicotiana tabacum]) was greatly reduced if the seedlings were irradiated with red light 2 h prior to the onset of phototropic stimulation (to 4 min of blue light stimulation for Arabidopsis and to 15 min for tobacco). An action spectrum for the enhancement effect over the wavelength range from 350 to 731 nm clearly implicated phytochrome (Janoudi and Poff, 1992). As the appearance of enhancement was gradual (as were the red light–induced changes described by the earlier workers), they imposed a 120-min dark period between the preirradiation and the onset of phototropic induction. Janoudi and Poff (1993) then showed that red light not only enhanced the subsequent phototropic sensitivity of Arabidopsis hypocotyls to blue light but also hastened recovery of phototropic sensitivity following blue light–induced desensitization.
The availability of both phyA and phyB mutants of Arabidopsis allowed Parks et al. (1996) to demonstrate that it was phyA and not phyB that mediated the red light–induced enhancement of phototropic curvature to low fluences of blue light. As with Janoudi and Poff, they used a 2-h dark period between preirradiation and phototropic induction. More detailed studies (Janoudi et al., 1997a) uncovered a more complex picture by investigating the effect of different fluences of red light on enhancement of first positive curvature. They found that the responses to low red light fluences were exclusively attributable to phyA, whereas the responses to higher fluences of red light were mediated neither by phyA nor by phyB (Janoudi et al., 1997a). Janoudi et al. (1997b) then studied phototropic responses in Arabidopsis in the absence of preirradiation in the phytochrome mutants. Neither phyA nor phyB mutants showed a reduced magnitude for first positive curvature, but first positive curvature was barely detectable in the phyA phyB double mutant. Thus, even without red light preirradiation, one or the other of these two phytochromes was required for a normal first positive phototropic response. Neither the phyA nor phyB single mutants showed an altered time threshold for second positive curvature. However, the time threshold was increased sixfold in the double mutant, and the magnitude of the response decreased, again indicating a role for the phytochromes in phototropic responses with no preirradiation.
Whippo and Hangarter (2004) revisited the role of the various phytochromes in Arabidopsis phototropism. The picture that emerged was even more complex. These workers confirmed that phyA is required for normal phototropism in response to very low fluence rates of blue light. At somewhat higher fluences, phyB and phyD function redundantly with phyA to promote the phototropic response. At very high blue light fluence rates, phyA alone is responsible for attenuating the phototropic response.
Until the identification of phototropin 1 (PHOT1) as a photoreceptor for phototropism (Christie et al., 1998), there was no obvious way to investigate the relationship between the phytochromes and the blue light receptor(s) mediating phototropism. The opportunity arose, however, when Sakamoto and Briggs (2002) transformed the null mutant phot1-5 (nph1-5) with a PHOT1–green fluorescent protein (GFP) construct driven by the native PHOT1 promoter. The transgene restored phototropic sensitivity to low fluence rates of blue light and, at the same time, allowed a description of the cellular and subcellular distribution of the PHOT1-GFP protein under different experimental conditions. Sakamoto and Briggs (2002) also demonstrated that blue light treatment of the transformant caused the transformant to lose some of the PHOT1-GFP fluorescence from the plasma membrane, a relocalization phenomenon explored in more detail by Wan et al. (2008). These authors demonstrated the phenomenon in epidermal and mesophyll cells of the etiolated cotyledon, epidermal and cortical cells of the hypocotyl, both elongating and mature, cortical cells of the shoot–root transition region, and elongating cortical cells near the root tip. Only developing guard cells failed to show the response. Kong et al. (2006) described a similar phenomenon for PHOT2-GFP.
Preliminary experiments indicated that red light pretreatment might interfere with this loss. Thus, this study was designed to characterize this effect of red light and investigate how it might be related to the complex physiological changes that red light pretreatment induces in the subsequent phototropic responses of etiolated Arabidopsis hypocotyls. The working hypothesis was that retention of PHOT1 at the plasma membrane as a consequence of phytochrome photoconversion by red light could cause enhanced phototropic sensitivity by retaining the photoreceptor on the membrane system responsible for auxin transport.
RESULTS
Effect of Red Light Pretreatment on Blue Light–Induced Relocalization of PHOT1-GFP
As blue light induces a loss of PHOT1-GFP from the plasma membrane (Sakamoto and Briggs, 2002; Wan et al., 2008), and as red light sensitizes the phototropic response to low fluence rates of blue light, we investigated whether red light treatment would affect the blue light–activated phototropin relocalization we previously described (Sakamoto and Briggs, 2002; Wan et al., 2008). We first determined how much blue light is required to saturate the blue light–induced PHOT1-GFP relocalization. Using an external light source, we administered blue light fluences ranging from 20 to 2000 μmol m−2 (given at a constant fluence rate of 20 μmol m−2 s−1 with time varied). We then examined the cortical cells of the elongation region of etiolated hypocotyls of Arabidopsis seedlings using the confocal microscope for any changes in PHOT1-GFP distribution after a 1-h dark period. As shown in Supplemental Figure 1 online, the response was not induced by 200 μmol m−2 (10 s × 20 μmol m−2 s−1) but was clearly detectable after exposure to 600 or 2000 μmol m−2, in agreement with our previous results (Wan et al., 2008). Thus, when we used an external light source in subsequent experiments instead of the microscope laser, we used 2000 μmol m−2 (20 μmol m−2 s−1 for 100 s) of blue light to make certain that the blue light response was saturated.
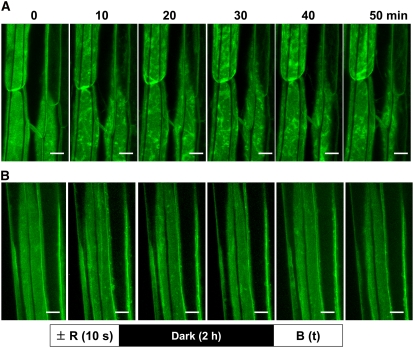
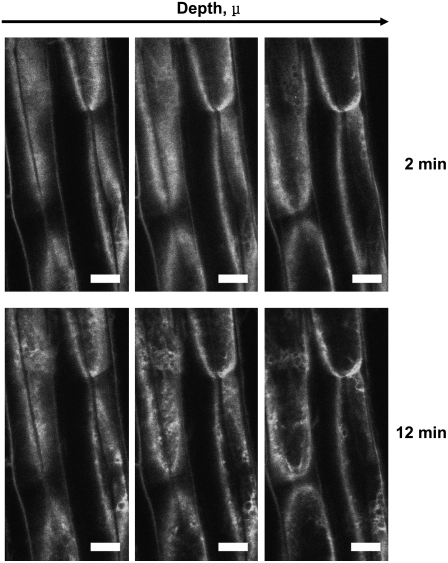
A time course showing the effect of blue light alone is shown by the projection images in Figure 1A. For this experiment, the blue light source was the laser in the confocal microscope (20 μmol m−2 s−1). At time zero, PHOT1-GFP is relatively evenly distributed at the plasma membranes of these cortical cells from the elongation region of an etiolated Arabidopsis hypocotyl. Within 10 min of the start of blue light irradiation, some reorganization and mottling of the label is evident, and this mottling increases over the course of an hour in all of the cells shown in the field. By 12 min after the onset of blue light, movement of PHOT1-GFP into the cytoplasm can be observed in single optical sections of the cortical cells (Figure 2). These results confirm our previous results (Wan et al., 2008) and provide a control for experiments investigating possible involvement of phytochrome(s) in the phenomenon (see below).
Figure 1.
Time Course for Blue Light–Induced Relocalization of PHOT1-GFP in Hypocotyl Cortical Cells of 3-d-Old Etiolated Arabidopsis Seedlings without or with Prior Red Light Treatment.
Projection images. Blue light (B) source is laser from confocal microscope. Fluence rate ∼20 μmol m−2 s−1. Bars = 20 μm.
(A) No red light (R) pretreatment. Note obvious PHOT1-GFP relocalization as early as 10 min after the onset of blue light exposure.
(B) Red light pretreatment (5 μmol m−2 s−1 of red light for 10 s followed by 2 h of darkness prior to blue light irradiation). Most of the blue light–induced PHOT1-GFP relocalization has been eliminated by the red light treatment.
Figure 2.
Blue Light–Induced Relocalization of PHOT1-GFP in Hypocotyl Cortical Cells from the Plasma Membrane into the Cytoplasm.
Seedlings as in Figure 1A, no red light pretreatment. At each time point, 3 z-series single optical sections were taken at three different depths starting just below the surface of the cells illustrated, and at 11-μ intervals to demonstrate that blue light–induced relocalization is at least partially movement into the cytoplasm and not just redistribution along the plasma membrane. Note obvious relocalization of PHOT1-GFP as early as 12 min after the onset of blue light treatment. Blue light exposure as in Figure 1. Blue light fluence rate: 20 μmol m−2 s−1. Bars = 20 μm.
The protein gel blot shown in Supplemental Figure 2 online indicates that a fraction of the PHOT1-GFP released to the cytoplasm on blue light treatment is in the supernatant following centrifugation of seedling extracts for 1 h at 135,000g and is likely soluble. The experiment does not eliminate the possibility that some of the cytoplasmic PHOT1-GFP may still be membrane associated, but the results confirm previous observations by Sakamoto and Briggs (2002) that a fraction of the released PHOT1-GFP cannot be sedimented under the above conditions.
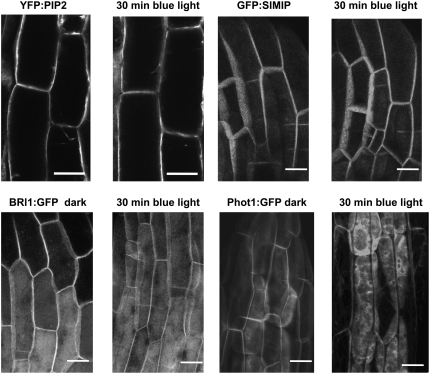
The blue light–induced movement of PHOT1-GFP into the cytoplasm is not a general property of plasma membrane proteins and is not indicative of a major endocytosis. Figure 3 shows the effect of blue light on three fluorescent-labeled plasma membrane proteins: YFP:PIP2 (yellow fluorescent protein:Plasma Membrane Intrinsic Protein 2), an aquaporin; BRI1-GFP (Brassinosteroid-Insensitive 1:green fluorescent protein), a brassinolide receptor; and GFP:SIMIP (Salt Stress-Induced Major Intrinsic Protein), an aquaporin. None of the three marker proteins shows a change in distribution even after 30 min of blue light treatment (20 μmol m−2 s−1) (Figure 3, top and lower left). These results are in sharp contrast with the dramatic effect of the same blue light treatment on PHOT1-GFP (Figure 3, lower right).
Figure 3.
Specificity of Blue Light–Induced PHOT1-GFP Relocalization.
Blue light–induced relocalization of PHOT1-GFP is not part of a general blue light–induced relocalization of plasma membrane proteins in the cortical cells of etiolated 3-d-old Arabidopsis seedlings. The localization of three fluorescent-labeled intrinsic plasma membrane proteins, YFP:PIP2, GFP:SIMIP, and BRI1:GFP, in cortical cells of Arabidopsis etiolated seedlings is unaffected by blue light treatment sufficient to cause major relocalization of PHOT1-GFP. The blue light source was the laser from a confocal microscope. Blue light fluence rate: 20 μmol m−2 s−1. Bars = 20 μm.
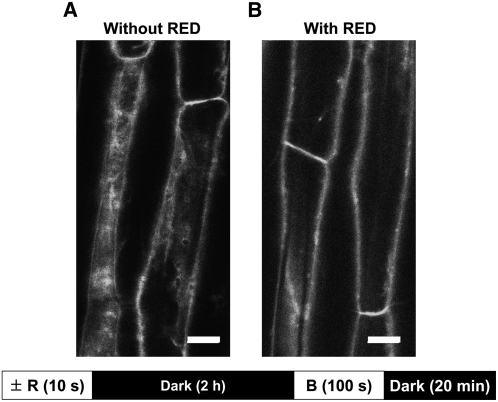
If a brief pulse of red light (50 μmol m−2) is given 2 h prior to the onset of blue light treatment, these dramatic changes in PHOT1-GFP distribution are almost completely eliminated (Figure 1B, projection images). The slight mottling seen in the red light–treated cells in Figure 1B after blue light treatment stands in sharp contrast with the extensive relocalization response seen without the prior red light treatment (Figure 1A). Thus, red light pretreatment appears to cause retention of PHOT1-GFP at the plasma membrane of these cells. The effect of red light in preventing the movement of PHOT1-GFP into the cytoplasm is illustrated in the single optical sections shown in Figure 4. The 2-h dark period was chosen as it was the time period used in virtually all of the physiological experiments cited in the Introduction investigating the effect of red light preirradiation on subsequent phototropic responses.
Figure 4.
Effect of Red Light Treatment 2 h before Blue Light Irradiation on Blue Light–Induced PHOT1-GFP Relocalization in 3-d-Old Arabidopsis Hypocotyl Cortical Cells.
Single z-series images taken from seedlings without (A) or with (B) red light (R) treatment 2 h before the blue light (B) pulse. Red light source as in Figure 1B. The blue light source (fluence rate 20 μmol m−2 s−1, exposure time 100 s) was LEDs. Single z-series optical sections obtained 20 min after the blue light pulse. Note minimal cytoplasmic PHOT1-GFP in red light–treated sample. Bar = 20 μm.
Effect of Red Light on Phototropism Mediated by PHOT1-GFP
To test whether a brief pulse of red light affected phototropism under our growth conditions, we tested the phototropic responses of the PHOT1-GFP, gl1, and phot1-5 lines with or without prior red light treatment (Table 1). A 2-h dark incubation period followed the red treatment. In the PHOT1-GFP line, PHOT1-GFP is the only functional phototropin. In the gl1 line, both PHOT1 and PHOT2 are functional. In the phot1-5 line, only PHOT2 is functional. Furthermore, a blue light fluence rate of 1 μmol m−2 s−1 can only activate PHOT1, whereas 20 μmol m−2 s−1 activates both PHOT1 and PHOT2 (Sakai et al., 2001).
Table 1.
Effect of Red Light (R) on Subsequent Blue-light (B)-Induced Phototropic Curvature
| Arabidopsis Line | Exposure Time (h) | R Fluence (μmol m−2) | B Fluence Rate (μmol m−2 s−1) | Degrees Curvature ± sea |
|---|---|---|---|---|
| PHOT1-GFP | 8 | 0 | 1 | 12.8 ± 1.7 |
| PHOT1-GFP | 8 | 100 | 1 | 20.8 ± 1.8 |
| g l1 | 11 | 0 | 1 | 41.0 ± 2.4 |
| gl1 | 11 | 100 | 1 | 48.0 ± 3.5 |
| phot1-5 | 11 | 0 | 1 | 3.7 ± 1.5 |
| phot1-5 | 11 | 100 | 1 | 1.2 ± 1.5 |
| PHOT1-GFP | 11 | 0 | 1 | 15.9 ± 1.7 |
| PHOT1-GFP | 11 | 100 | 1 | 23.2 ± 3.1 |
| gl1 | 11 | 0 | 20 | 45.7 ± 2.9 |
| gl1 | 11 | 100 | 20 | 60.4 ± 5.1 |
| phot1-5 | 11 | 0 | 20 | 20.1 ± 3.3 |
| phot1-5 | 11 | 100 | 20 | 35.7 ± 5.2 |
| PHOT1-GFP | 11 | 0 | 20 | 23.2 ± 2.0 |
| PHOT1-GFP | 11 | 100 | 20 | 35.1 ± 4.7 |
Dark incubation following R, 2 h.
Values for pairs (± R) in boldface indicate where R provides significant enhancement by R = 100 μmol m−2 over R = 0 μmol m−2 (t test, P < 0.05). For gl1, 1 μmol m−2 s−1 B (P < 0.08).
At blue light fluence rates of either 1 or 20 μmol m−2 s−1, red light significantly enhanced the response of the PHOT1-GFP line after both 8 and 11 h exposure (Table 1). When PHOT2 alone is functional (phot1-5, blue light = 20 μmol m−2 s−1) red light treatment also significantly enhanced the phototropic response. The gl1 line irradiated with 1 μmol m−2 s−1 of blue light (11 h) failed to show strong enhancement, possibly because both red light–treated and control seedlings had reached the saturation level for curvature. When the blue light fluence rate was 20 μmol m−2 s−1, some enhancement occurred, although the enhancement was less than seen in the other lines. The phot1-5 line failed to curve in response to 1 μmol m−2 s−1, as it lacked PHOT1, and the fluence rate was too low to activate PHOT2. We conclude that under the conditions we used to demonstrate a red light effect on blue light–induced PHOT1-GFP relocalization, the same red light treatment enhances the phototropic response mediated by PHOT1-GFP (and by PHOT2 alone).
Timing and Quantification of the Red Light Effect on PHOT1-GFP Relocalization
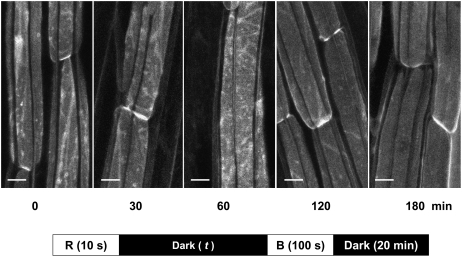
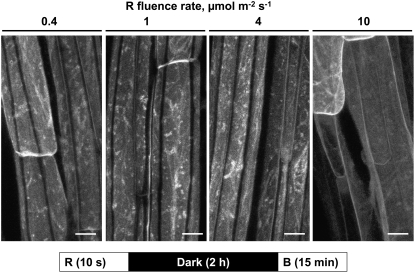
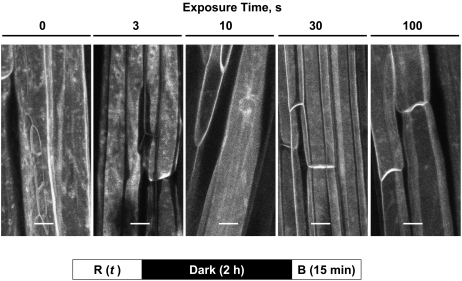
Since 50 μmol m−2 (5 μmol m−2 s−1 for 10 s) of red light administered 2 h prior to blue light treatment was sufficient to reduce blue light–induced relocalization dramatically (Figure 1B), we investigated how much dark time was required between red light pretreatment and a blue light pulse for the red light to be effective. PHOT1-GFP relocalization was then allowed to proceed for 20 min in darkness following the blue light pulse (2000 μmol m−2) prior to observation with the confocal microscope. The results are shown in Figure 5. Red light administered 0, 30, or 60 min prior to blue light was essentially ineffective. In all three cases, blue light induced movement of PHOT1-GFP into the cytoplasm. However, by 2 h after red light treatment, the effect of blue light was eliminated. This effect of red light persisted at least for an additional hour. We next asked how much red light was required to prevent the effect of blue light on the subcellular distribution of PHOT1-GFP in the elongating hypocotyl cells. The results are shown in Figure 6 (constant 10-s exposure time for red light with intensity varied) and Figure 7 (constant fluence rate at 10 μmol m−2 s−1 with time varied). The red light effect was saturated between 40 and 100 μmol m−2 in both experiments. This range is well within that to be expected for a classic low-fluence phytochrome response (Schäfer and Nagy, 2006). Furthermore, the reciprocity law (Bunsen and Roscoe, 1862) holds under these experimental conditions.
Figure 5.
Duration of Dark Incubation Period after Red Light Treatment Required for Red Light–Induced Inhibition of Blue Light–Induced PHOT1-GFP Relocalization.
Projection images of hypocotyl cortical cells from 3-d-old etiolated Arabidopsis seedlings. Red-light (R) treatment as in Figure 1B. Blue light (B) treatment as in Figure 4. Dark incubation times were 0, 30, 60, 120, and 180 min. A maximum effect of red light in preventing blue light–induced PHOT1-GFP relocalization is seen only after 2 or 3 h of dark incubation. Bars = 20 μm.
Figure 6.
Fluence Response Relationship for Red Light–Mediated Inhibition of Blue Light–Induced PHOT1-GFP Relocalization.
Exposure time constant (10 s), fluence rate varied (from 0.4 to 10 μmol m−2 s−1). Projection images of PHOT1-GFP in hypocotyl cortical cells from 3-d-old etiolated Arabidopsis seedlings. Note that 100 μ m−2 (10 s × 10 μmol m−2 s−1) of exposure to red light is sufficient to prevent blue light–induced PHOT1-GFP relocalization. The blue light source was the laser from a confocal microscope. Bars = 20 μm.
Figure 7.
Fluence Response Relationship for Red Light–Mediated Inhibition of Blue Light–Induced PHOT1-GFP Relocalization.
Red light fluence rate constant (10 μmol m−2 s−1), exposure time varied (between 0 and 100 s). Projection images of PHOT1-GFP in hypocotyl cortical cells from 3-d-old etiolated Arabidopsis seedlings. Images were obtained 15 min after blue light (B) exposure. Note that 100 μm−2 (10 s × 10 μmol m−2 s−1) red light is sufficient to prevent blue light–induced PHOT1-GFP relocalization. Blue light source (fluence rate 20 μmol m−2 s−1, exposure time 100 s), from LEDs. Bars = 20 μm.
Far-Red Reversal of the Red Light Effect
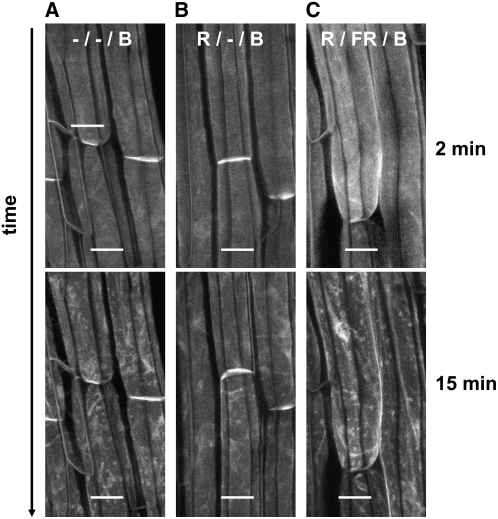
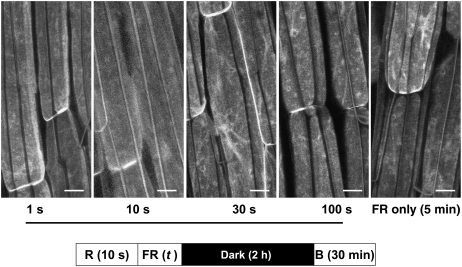
If the effect of red light is indeed a low-fluence phytochrome response, one would expect it to be fully far-red reversible. Indeed, 1260 μmol m−2 of far red completely reversed the effect of red light. Figure 8 shows that the effect of blue light (confocal laser) was diminished if 100 μmol m−2 of red light (administered 2 h before blue) was followed immediately by the far-red treatment (Figure 8, bottom right panel). The appearance of the cells 15 min after the blue light pulse is virtually identical to that of blue light without any red pretreatment (Figure 8, bottom left panel) and essentially indistinguishable from that seen in Figure 2A. As expected, red light alone almost eliminated the blue light response (Figure 8, middle panels). We next investigated how much far-red light is required to reverse the effect of red light. The results are shown in Figure 9, which presents cells near the bottom of the hypocotyl elongation zone. Far-red light (1260 μmol m−2) was sufficient to reverse the effect of red light (Figure 9, center panel).
Figure 8.
Far-Red Reversal of Red Light–Mediated Inhibition of Blue Light–Activated PHOT1-GFP Relocalization.
Projection images of PHOT1-GFP in hypocotyl cortical cells of 3-d-old etiolated Arabidopsis seedlings without (A) or with (B) red light (R) treatment (100 μmol m−2) or red light (100 μmol m−2) followed by far-red (FR) treatment (1260 μmol m−2) given immediately after red (C). A 2-h dark incubation period followed the red or red/far-red treatment prior to blue light (B) treatment. Note that far-red after red reduces the red light–induced inhibition of blue light–induced PHOT1-GFP relocalization (cf. [B] and [C]). Blue light source (20 μmol m−2 s−1), laser from confocal microscope. Top panels, 2 min of exposure to blue light; bottom panels, 15 min of exposure to blue light. Bars = 20 μm.
Figure 9.
Fluence Requirement for Far-Red Light to Reverse the Red Light–Induced Inhibition of Blue Light–Activated PHOT1-GFP Relocalization.
Projection images of PHOT1-GFP in hypocotyl cortical cells of 3-d-old etiolated Arabidopsis seedlings. Irradiation and dark incubation protocols as in Figure 8 but with far-red (FR) exposure time varied. Red light (R) fluence rate 10 μmol m−2 s−1, exposure time 10 s. Far-red (FR) fluence rate 42 μmol m−2 s−1. Blue light (B) source (20 μmol m−2 s−1), laser from confocal microscope. Note that 1260 μmol m−2 of far-red light (42 μmol m−2 s−1 × 30 s) is sufficient to reverse the red-light effect. Bars = 20 μm.
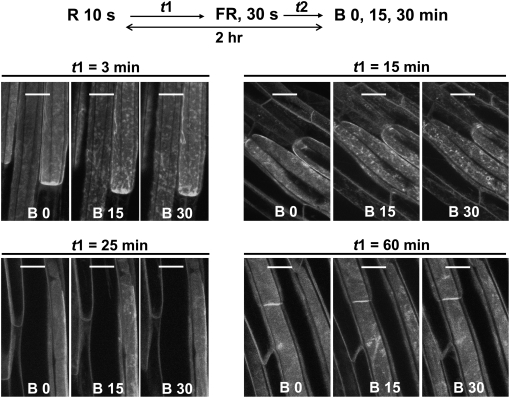
Finally, we investigated the time course for escape from far-red reversibility. The results are shown in Figure 10. Regardless of when far-red light was given, the total dark period was always 2 h. With a 15-min dark period between red and far-red treatment, the effect of far-red light in reversing the red-light effect was diminished, and with a 25-min dark period after red light, far-red light was completely ineffective. Hence, the consequences of red light treatment become fixed relatively rapidly, although they are not fully expressed until 2 h has passed following red light treatment (Figure 5).
Figure 10.
Escape from Far-Red Reversal of the Red Light Effect on Blue Light–Induced PHOT1-GFP Relocalization.
Projection images of PHOT1-GFP in hypocotyl cortical cells from etiolated 3-d-old Arabidopsis seedlings. Light sources and irradiation protocols as for Figure 9 except that the time between red light (R) and far-red (FR) pulses was varied from 3 to 60 min. t1, time, min, between red and far-red pulses; t2, time, min, between far-red pulse and beginning of blue light irradiation. t1 + t2 = 120 min. A time course for the B effect is shown for each red/far-red treatment. Note the strong blue light response at 3 and 15 min between red and far red, indicating far-red reversal of the red effect. At 25 and 60 min between red and far-red pulses, the red effect is only weakly reversed. Bars = 20 μm.
Localization of the Red Light Effect to the Elongation Zone
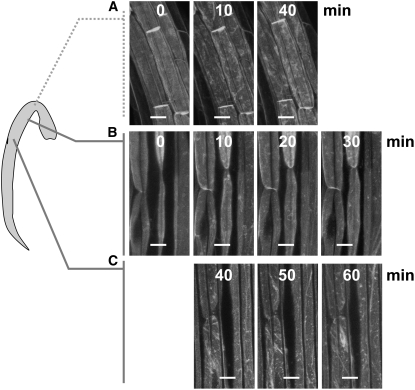
We were puzzled that we did not always obtain an effect of red light in preventing subsequent blue light–induced PHOT1-GFP relocalization. We identified two reasons for this variability: First, if the hypocotyls are handled a little roughly, some PHOT1-GFP relocalization occurred in the absence of any blue light treatment. We solved this problem by mounting the seedlings carefully on agar (see Methods). However, some variability still persisted. The effect of red light in blocking blue light–inducible PHOT1-GFP movement into the cytoplasm had a developmental component. We found that the standard red light fluence had little effect on blue light–induced PHOT1-GFP distribution in the hook (Figure 11A) or in the mature cells, below the elongation zone (Figure 11C), but prevented the blue light effect in the elongation zone (Figure 11B). It was logistically possible in these experiments to observe two regions from the same seedlings, but not three. Thus, the images shown in the center and bottom panels of Figure 11 were taken from the same seedlings, but those in the top panel were from a different seedling. Experiments shown in Figure 1A indicate that substantial blue light–induced PHOT1-GFP relocalization can be observed well before 30 min from the onset of blue light treatment. However, no effect is detectable after 30 min in the elongation zone cells given prior to red light treatment (Figure 11, center panels). By contrast, by 40 min there is a strong effect of blue light both above and below the elongation zone despite red light pretreatment. Thus, the interaction between phytochrome and PHOT1-GFP develops as cells enter their elongation phase and is lost when they are mature.
Figure 11.
Restriction of the Red Light Effect on Blue Light–Induced PHOT1-GFP Relocalization to the Hypocotyl Elongation Zone.
Projection images of cortical cells from the hypocotyl hook (A), the elongation zone (B), and mature hypocotyl zones (C) of etiolated 3-d-old Arabidopsis seedlings. Red light fluence rate 10 μmol m−2 s−1, an exposure time of 10 s followed by a 2-h dark incubation period prior to blue light treatment. The blue light source (20 μmol m−2 s−1) is the laser from the confocal microscope. Note that red light treatment eliminates the blue light effect only in the elongation zone. Bars = 20 μm.
Since the red light effect is restricted to the hypocotyl elongation zone, we were unable to detect a red light–induced decrease in the level of PHOT1-GFP in the soluble fraction. It is likely that a red-induced decrease in the amount of PHOT1-GFP released to the cytoplasm in the elongation zone in response to blue light treatment would be masked by its blue light–induced release in the cotyledons, hook, and mature hypocotyl tissues, especially given the large amount of PHOT1-GFP detectable in the cotyledons and hook (Wan et al., 2008). This latter release is unaffected by the red light treatment (see below).
Identification of the Phytochrome Mediating the Red Light Effect in Antagonizing Blue Light–Induced PHOT1-GFP Relocalization
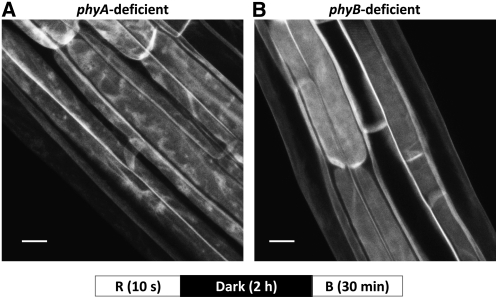
We made crosses for plants carrying the PHOT1-GFP transgene in the phot1-5 null background with strong mutant alleles of phyA (phyA-211, Reed et al., 1994) or phyB (phyB-9, Reed et al., 1993) and with the phyA-211 phyB-9 double mutant to identify the phytochrome(s) that mediated the red light response described above. The seedlings were given 50 μmol m−2 s−1 of red light, 2 h of darkness, a blue light pulse (total fluence 2000 μmol m−2), and 30 min of darkness prior to observation with the confocal microscope. In the phyB mutant, red light still blocks blue light–induced relocalization of PHOT1-GFP (Figure 12B), whereas in the phyA mutant, blue light induces normal relocalization despite the prior red light treatment (Figure 12A). As expected from these results, the response of the phyA phyB double mutant is no different from that of the phyA mutant: there is no red light effect (see Supplemental Figure 3 online). Thus, the red light–induced inhibition of blue light–activated PHOT1-GFP relocalization from the plasma membrane is mediated by phyA. From following subsequent generations, we identified the three classes of phytochrome mutant lines in which PHOT1-GFP was the only functioning PHOT1. Red light treatment still prevented the blue light–induced relocalization of PHOT1-GFP in the absence of wild-type phot1 (the null phot1-5 allele, Huala et al., 1997) as long as functional phyA protein was present (see Supplemental Figure 4 online).
Figure 12.
Red Light Inhibition of Blue Light–Induced PHOT1-GFP Is Mediated by phyA.
Projection images of cortical cells from hypocotyls of 3-d-old etiolated Arabidopsis seedlings. Red light (R) treatment (10 μmol m−2 s−1 for 10 s) was followed by 2 h of incubation in the dark prior to blue light (B) treatment (20 μmol m−2 s−1 for 100 s). Blue light source from LEDs. Bars = 20 μm.
(A) In the absence of phyA, red light fails to prevent blue light–induced PHOT1-GFP relocalization.
(B) In the absence of phyB, red light is fully effective in preventing PHOT1-GFP relocalization.
DISCUSSION
The action of red light in preventing subsequent blue light–induced relocalization of PHOT1-GFP from the plasma membrane in etiolated Arabidopsis hypocotyls has the characteristics of a classic phytochrome effect. The response happens in the low fluence range, is fully far-red reversible, and shows typical escape from far-red photoreversibility during ∼30 min of darkness. The above results show that this response is mediated by phyA and not phyB (Figure 12; see Supplemental Figure 3 online). Although phyA phototransformation must bring about some changes at the plasma membrane to cause the retention of PHOT1-GFP, it is premature to ascribe this effect to a cytoplasmic action of phyA. The changes are gradual, requiring 2 h to go to completion, which is more than enough time for the intervention of changes in the transcription of nuclear genes and subsequent proteome changes at the plasma membrane.
PHYTOCHROME KINASE SUBSTRATE1 (PKS1) is a cytoplasmic protein that can interact with phytochrome and is phosphorylated by phytochrome (Fankhauser et al., 1999). Lariguet et al. (2006) recently demonstrated that the protein interacts physically with both PHOT1 and plasma membrane–associated NONPHOTOTROPIC HYPOCOTYL3 (NPH3) both in vivo and in vitro. Both NPH3 (Liscum and Briggs, 1995) and PKS1 (Lariguet et al., 2006) are essential for Arabidopsis hypocotyl phototropism. PKS1 is fairly uniformly expressed in the hypocotyls of dark-grown seedlings but becomes concentrated in the root tip and hypocotyl elongation zone after 4 h in the light (Lariguet et al., 2003). Both red and far-red light induce an overall increase in PKS1 protein over a 4-h period, and a few short pulses of far-red light are sufficient to produce a measurable increase. These results suggest that the increase is a very low fluence reaction.
It is tempting to postulate that the light-induced increase in PKS1 in the elongation zone is related to the red light–induced retention of PHOT1-GFP at the plasma membrane after blue light treatment. Both occur over a few hours, both are mediated exclusively by phyA, and both are localized to the elongation zone. The correlation appears to break down, however, in the case of far-red reversibility. The PKS increase is actually induced by far-red light, either continuous or pulsed, whereas the red light effect on PHOT1-GFP localization after blue light is far-red reversible (Figures 8 and 9), and 5 min of far-red light alone 2 h prior to blue light treatment had no effect on PHOT1-GFP relocalization (Figure 9). However, Lariguet et al. (2003) regularly used longer light treatments than those in this study and did not report any results on the effect of single red light pulses or red/far-red reversibility. Hence, the role of PKS1 in the phenomenon described here remains open.
The conditions used here for the experiments in which the red light effect had gone to completion were very similar to those used by Parks et al. (1996), who exposed etiolated Arabidopsis hypocotyls to a brief pulse of red light followed by 2 h of darkness prior to phototropic induction with blue light. A reasonable hypothesis to explain the phototropism enhancement by red light is that by causing PHOT1-GFP to remain at the plasma membrane where blue light–induced lateral auxin transport is presumably taking place, there is more phototropin to impact auxin transport and hence a stronger phototropic response. However, there are other conditions where this hypothesis is not sufficient or where the results actually eliminate it as a possibility. For example, although the changes in phototropic sensitivity of etiolated maize (Chon and Briggs, 1966) or oat (Zimmerman and Briggs, 1963) coleoptiles induced by red light are exquisitely sensitive to red light, it is only the sensitivity of second positive curvature that is increased by red light. That of first positive curvature is actually decreased in both cases by almost an order of magnitude. It is not known at present, however, whether the effect of red light on the subcellular distribution of PHOT1 in Arabidopsis is also seen in maize and oat coleoptiles or indeed whether any PHOT1 moves from the plasma membranes in these organs.
The results of Whippo and Hangarter (2004) also suggest a far more complex picture: Even without red light pretreatment, a normal phototropic response to low-fluence-rate blue light requires the presence of either phyA or phyB. Presumably the small fraction of the far-red-absorbing form of phytochrome induced by the blue light is needed for a normal phototropic response. While phyA is essential for a normal phototropic response when the blue light fluence rate is 0.01 μmol m−2 s−1, for higher blue light fluence rates (above 1.0 μmol m−2 s−1), phyB or phyD can serve redundantly. Furthermore, under very high fluence rates of blue light (e.g., 100 μmol m−2 s−1), phyA actually attenuates the phototropic response. In addition, other work by Whippo and Hangarter (2003) indicates involvement of cryptochromes in modulating phototropic responses as well as phytochromes. Thus, PHOT1 and PHOT2 can both modulate phototropic responses directly and phyA, phyB, PhyD, cry1, and cry2 can do so indirectly. No simple model can account for this complexity.
A surprising finding is that the regulation of PHOT1-GFP localization and phyA, whether direct or indirect, is regulated during development. Red light has little or no effect on the subcellular distribution or redistribution of PHOT1-GFP in the hook tissues or in the mature cells below the elongation zone. The association develops just below the hook and is fully expressed only in the elongation zone. Hence, it occurs only in the phototropically sensitive tissue and not elsewhere in the hypocotyl. Since PHOT1 is well known to mediate a number of other responses (stomatal opening, chloroplast accumulation, chloroplast avoidance, rapid growth inhibition, leaf expansion, and leaf position), it will be interesting to determine whether phyA can play a role in modulating one or more of these responses mediated by PHOT1. If so, are these interactions developmentally regulated?
The light gradient across an Arabidopsis hypocotyl is steeper in the blue light than in the red region of the spectrum because of both stronger absorption of blue light (e.g., from flavins, carotenoids, and the Soret bands of cytochromes) and greater loss through light scattering. Hence, red light excitation of phyA should be more uniform across a hypocotyl than blue light excitation of PHOT1 if both are given unilaterally. Thus, red light–induced retention of PHOT1 at the plasma membrane is not likely to show a strong gradient across the tissue regardless of direction of the exciting light. If a small gradient exists for red light, PHOT1 retention at the plasma membrane would be slightly favored on the illuminated side. The response to subsequent blue light might then be enhanced if the blue light came from the same direction (i.e., more PHOT1 at the plasma membrane to excite and drive lateral auxin transport on the illuminated side than on the shaded side) and slightly inhibited if it came from the opposite direction (i.e., less PHOT1 at the plasma membrane on the illuminated side than the shaded side). Whether this hypothesis is correct would depend on whether the red light effect was cell specific or spread uniformly throughout the hypocotyl tissue. There is physiological evidence for at least a weak gradient of phytochrome photoexcitation across etiolated maize mesocotyls (Iino et al., 1984) and pea (Pisum sativum) epicotyls (Parker et al., 1988). In both cases, phytochrome itself was shown to mediate a weak phototropic response to red light, which suggests some cell specificity. These larger organs would be more suitable for testing the possible role of a gradient in phytochrome photoexcitation on phototropic blue light sensitivity than the Arabidopsis hypocotyl provided that the same relationship between phytochrome and phototropin exists in these species.
This work establishes a potential mechanism by which phytochrome might enhance phototropic sensitivity when both red and blue light fluences are low. The mechanism might be advantageous for seedlings exposed to the very first light as they break through the soil, maximizing growth toward the light source. Future study will be required to determine the nature and complexity of the pathways involved in the interaction of the two photoreceptors, PHOT1 and phyA. The possible physiological roles of the complicated interactions seen with higher fluence rates both of red and blue light also await further exploration to determine their cellular basis.
METHODS
Plant Materials and Growth Conditions
We used the phot1-5 mutant of Arabidopsis thaliana (Columbia ecotype, gl1 background) transformed with PHOT1-GFP, constructed by Sakamoto and Briggs (2002). Seeds were surface sterilized and plated onto half-strength Murashige and Skoog medium containing 0.8% agar and 1% sucrose. The plates were held in darkness for 3 d at 4°C and then exposed to red light (22°C, fluence rate of 15 μmol m−2 s−1) for 2 h to induce uniform germination. The seedlings were then grown in complete darkness at 22°C for ∼2.5 d. The mutants phyA-211, phyB-9, and phyA-211 phyB-9, kindly provided by Peter H. Quail, were crossed with PHOT1-GFP plants. F2 seeds were selected under red (8 μmol m−2 s−1) or far-red (2 μmol m−2 s−1) light, and seedlings with long hypocotyls were screened for PHOT1-GFP fluorescence. To confirm the phot1-5 mutant background, we performed PCR genotyping with forward primer 5′-GCAGGTACATAGAGCTAGAGC-3′ and reverse primer 5′-GCTGTGAGTAATTAGTCCTCC-3′. The phot1-5 mutation deleted the primary site for the forward primer and therefore produced no PCR product. The wild-type PHOT1 gene yielded a PCR product of ∼1.8 kb, while the PHOT1-GFP fusion produced a band of ∼2.4 kb. We selected plants that only produced the 2.4-kb product.
Light Sources
The red light source to induce germination consisted of two 20-W red fluorescent tubes (Sylvania F20T12/R) filtered through one layer of Rohm and Haas 2444 red Plexiglas. The red light source used to treat the seedlings was a bank of LEDs (630 nm). The source of far-red light was a 12-V, 20-W tungsten halogen lamp filtered through a Rohm and Haas FRF Plexiglas filter. The different fluence rates used in the individual experiments are provided above. For certain experiments, the source of blue light was the laser in the confocal microscope (488 nm). For other experiments, except phototropism, it was a bank of LEDs (470 nm). Unless otherwise indicated, the fluence rate from blue light sources was 20 μmol m−2 s−1. For phototropism experiments, the blue light sources were either two fluorescent lamps (Philips F20T12/CW), with the light passed through a blue Plexiglas filter (Rohm and Haas) (1 μmol m−2 s−1), or a Kodak Carousel 4400 slide projector equipped with a Corning blue filter (20 μmol m−2 s−1).
Sample Preparation for Microscopy
As mentioned above, even slight physical damage could cause the loss of some PHOT1-GFP from the plasma membrane to the cytoplasm. To avoid this physical damage, a layer of 1.5% agar dissolved in distilled water was allowed to solidify between two cover slips (22 × 22 mm). When it had hardened, the upper cover slip was slid off and the seedlings were gently placed on the remaining agar bed on the lower cover slip. A cover slip was then gently placed over the seedling and the assembly was turned over and transferred to the microscope upside down. Uniform plasma membrane distribution of PHOT1-GFP on initial observation with the confocal microscope was taken as evidence that no damage had occurred.
Microscopy
All images were acquired with a Nikon inverted fluorescence microscope equipped with appropriate Nikon water immersion objective lenses and a Bio-Rad MRC confocal head. All experiments were repeated three or more times with results similar to those presented above.
Phototropism Experiments
Phototropism experiments were performed as described elsewhere (Cho et al., 2007). Three-day-old seedlings were treated with red light (total fluence 100 μmol m−2) and returned to darkness for 2 h prior to blue light treatment. Blue fluence rates were either 1 or 20 μmol m−2 s−1, and exposure times were either 8 or 11 h. The plates of seedlings were scanned and the hypocotyl images were analyzed with NIH ImageJ 1.62 software. Representative data from four different experiments are shown. In all phototropism experiments, the curvatures of 20 or more seedlings were measured for each data point with similar results.
Protein Gel Blotting and Gel Electrophoresis
Total protein was extracted from control or blue light–treated seedlings under dim red light as described elsewhere (Cho et al., 2007). The extract was centrifuged for 10 min at 10,000 rpm in an Eppendorf 5415C tabletop centrifuge to sediment cell walls, larger organelles, and cellular debris not fully broken up. The supernatant was then centrifuged for 1 h at 135,000g .0 to obtain soluble and membrane fractions. Subsequent steps were as described (Cho et al., 2007).
Accession Numbers
Sequence data from this article can be found in the Arabidopsis Genome Initiative or GenBank/EMBL databases under the following accession numbers: BRI1 (NM 120100), FKF1 (NM 105475), LKP2 (NM 179652), PIP2A (NM 115202), PHOT1 (NM 114447), PHOT2 (NM 180881), PHYA (001,123,784), PHYB (NJM 127435), and SIMIP (NM 119676).
Supplemental Data
The following materials are available in the online version of this article.
Supplemental Figure 1. Fluence Requirement for Blue Light–Induced Relocalization of PHOT1-GFP from the Plasma Membrane into the Cytoplasm in Cortical Cells of the Hypocotyl of Etiolated Arabidopsis Seedlings.
Supplemental Figure 2. Protein Gel Blots Demonstrating Blue Light–Induced Release of Both PHOT1 and PHOT1-GFP from the Membrane to the Soluble Fraction of Etiolated Arabidopsis Seedlings.
Supplemental Figure 3. In the phyA phyB Double Mutant, as in the phyA Single Mutant, Red Light Does Not Prevent Blue Light–Induced PHOT1-GFP Relocalization.
Supplemental Figure 4. In phyA but Not phyB Mutants, Red Light Pretreatment Does Not Prevent Blue Light–Induced Relocalization of PHOT1-GFP in Lines Lacking Wild-Type PHOT1.
Acknowledgments
We thank Peter H. Quail for providing the three Arabidopsis phytochrome mutants and David Ehrhardt for providing the YFP:PIP2, GFP:SIMIP, and BRI1:GFP lines and for his help with the confocal microscopy. We also thank Margaret Olney for her careful review of the manuscript. I.-S.H. was supported by the Research Fund of Ulsan University. This work was supported by National Science Foundation Grant 0444504 to W.R.B. The authors are grateful for this support.
The author responsible for distribution of materials integral to the findings presented in this article in accordance with the policy described in the Instructions for Authors (www.plantcell.org) is: Winslow R. Briggs (briggs@stanford.edu).
Online version contains Web-only data.
References
- Bae, G., and Choi, G. (2008). Decoding of light signals by plant phytochromes and their interacting proteins. Annu. Rev. Plant Biol. 59 281–311. [DOI] [PubMed] [Google Scholar]
- Briggs, W.R. (1963. a). The phototropic responses of higher plants. Annu. Rev. Plant Physiol. 14 311–352. [Google Scholar]
- Briggs, W.R. (1963. b). Red light, auxin relationships, and the phototropic responses of corn and oat coleoptiles. Am. J. Bot. 50 196–207. [Google Scholar]
- Bunsen, R., and Roscoe, H. (1862). Photochemische Untersuchungen. Ann. Physiol. Chem. 117 529–562. [Google Scholar]
- Cho, H.-Y., Tseng, T.-S., Kaiserli, E., Sullivan, S., Christie, J.M., and Briggs, W.R. (2007). Physiological roles of the Light, Oxygen, or Voltage domains of phototropin 1 and phototropin 2 in Arabidopsis. Plant Physiol. 143 517–529. [DOI] [PMC free article] [PubMed] [Google Scholar]
- Chon, H.P., and Briggs, W.R. (1966). Effect of red light on the phototropic sensitivity of corn coleoptiles. Plant Physiol. 41 1715–1724. [DOI] [PMC free article] [PubMed] [Google Scholar]
- Christie, J.M., Raymond, P., Powell, G.K., Bernasconi, P., Raibekas, A.A., Lisum, E., and Briggs, W.R. (1998). Arabidopsis NPH1: A flavoprotein with the properties of a photoreceptor for phototropism. Science 282 1698–1701. [DOI] [PubMed] [Google Scholar]
- Curry, G.M. (1957). Studies on the Spectral Sensitivity of Phototropism. PhD dissertation (Cambridge, MA: Harvard University).
- Fankhauser, C., Yeh, K.C., Lagarias, J.C., Zhang, H., Elich, T.D., and Chory, J. (1999). PKS1, a substrate phosphorylated by phytochrome that modulates light signaling in Arabidopsis. Science 284 1539–1541. [DOI] [PubMed] [Google Scholar]
- Huala, H., Oeller, P.W., Liscum, E., Han, I.-S., Larsen, E., and Briggs, W.R. (1997). Arabidopsis NPH1: A protein kinase with a putative redox-sensing domain. Science 278 2120–2123. [DOI] [PubMed] [Google Scholar]
- Iino, M., Briggs, W.R., and Schäfer, E. (1984). Phytochrome-mediated phototropism in maize seedling shoots. Planta 160 41–51. [DOI] [PubMed] [Google Scholar]
- Janoudi, A.-K., Gordon, W.R., Wagner, D., Quail, P., and Poff, K.L. (1997. a). Multiple phytochromes are involved in red-light-induced enhancement of first positive phototropism in Arabidopsis thaliana. Plant Physiol. 113 975–979. [DOI] [PMC free article] [PubMed] [Google Scholar]
- Janoudi, A.-K., Konjević, R., Apel, P., and Poff, K.L. (1992). Time threshold for second positive phototropism is decreased by a pre-irradiation with red light. Plant Physiol. 99 1422–1425. [DOI] [PMC free article] [PubMed] [Google Scholar]
- Janoudi, A.-K., Konjević, R., Whitelam, G., Gordon, W., and Poff, K.L. (1997. b). Both phytochrome A and phytochrome B are required for normal expression of phototropism in Arabidopsis thaliana. Physiol. Plant. 101 278–282. [Google Scholar]
- Janoudi, A.-K., and Poff, K.L. (1991). Characterization of adaptation in phototropism of Arabidopsis thaliana. Plant Physiol. 95 517–521. [DOI] [PMC free article] [PubMed] [Google Scholar]
- Janoudi, A.-K., and Poff, K.L. (1992). Action spectrum for enhancement of phototropism by Arabidopsis thaliana seedlings. Photochem. Photobiol. 56 655–659. [Google Scholar]
- Janoudi, A.-K., and Poff, K.L. (1993). Desensitization and recovery of phototropic responsiveness in Arabidopsis thaliana. Plant Physiol. 191 1175–1180. [DOI] [PMC free article] [PubMed] [Google Scholar]
- Khurana, J.P., and Poff, K.L. (1989). Mutants of Arabidopsis thaliana with altered phototropism. Planta 178 400–406. [PubMed] [Google Scholar]
- Kong, S.-G., Suzuki, T., Tamura, K., Mochizuki, N., Hara-Nishimura, I., and Nagatani, A. (2006). B-induced association of phototropin 2 with the Golgi apparatus. Plant J. 45 994–1005. [DOI] [PubMed] [Google Scholar]
- Lariguet, P., Boccalandro, H.E., Alonso, J.M., Ecker, J.R., Chory, J., Casal, J.J., and Fankhauser, C. (2003). A growth regulatory loop that provides homeostasis to phytochrome A signaling. Plant Cell 15 2966–2978. [DOI] [PMC free article] [PubMed] [Google Scholar]
- Lariguet, P., Schepens, I., Hodgson, D., Pedmale, U.V., Trevisan, M., Kami, C., de Carbonnel, M., Alonso, J.M., Ecker, J.R., Liscum, E., and Fankhauser, C. (2006). PHYTOCHROME KINASE SUBSTRATE 1 is a phototropin 1 binding protein required for phototropism. Proc. Natl. Acad. Sci. USA 103 10134–10139. [DOI] [PMC free article] [PubMed] [Google Scholar]
- Liscum, E., and Briggs, W.R. (1995). Mutations in the NPH1 locus of Arabidopsis disrupt the perception of phototropic stimuli. Plant Cell 7 473–485. [DOI] [PMC free article] [PubMed] [Google Scholar]
- Mandoli, D.F., and Briggs, W.R. (1981). Phytochrome control of two low-irradiance responses in etiolated oat seedlings. Plant Physiol. 67 733–739. [DOI] [PMC free article] [PubMed] [Google Scholar]
- Parker, K., Baskin, T.I., and Briggs, W.R. (1988). Evidence for a phytochrome-mediated phototropism in etiolated pea seedlings. Plant Physiol. 89 493–497. [DOI] [PMC free article] [PubMed] [Google Scholar]
- Parks, B.M., Quail, P.H., and Hangarter, R.P. (1996). Phytochrome A regulates red-light induction of phototropic enhancement in Arabidopsis. Plant Physiol. 110 155–162. [DOI] [PMC free article] [PubMed] [Google Scholar]
- Reed, J.W., Nagatani, A., Elich, T.D., Faggan, M., and Chory, J. (1994). Phytochrome A and phytochrome B have overlapping but distinct functions in Arabidopsis development. Plant Physiol. 104 1139–1149. [DOI] [PMC free article] [PubMed] [Google Scholar]
- Reed, J.W., Nagpal, P., Poole, D.S., Furuya, M., and Chory, J. (1993). Mutations in the gene for the red/far-red light receptor phytochrome B alter cell elongation and physiological responses throughout Arabidopsis development. Plant Cell 5 147–157. [DOI] [PMC free article] [PubMed] [Google Scholar]
- Sakai, T., Kagawa, T., Kasahara, M., Swartz, T.W., Christie, J.M., Briggs, W.R., Wada, M., and Okada, K. (2001). Arabidopsis nph1 and npl1: Blue-light receptors that mediate both phototropism and chloroplast relocation. Proc. Natl. Acad. Sci. USA 98 6969–6974. [DOI] [PMC free article] [PubMed] [Google Scholar]
- Sakamoto, K., and Briggs, W.R. (2002). Cellular and subcellular localization of phototropin 1. Plant Cell 14 1723–1735. [DOI] [PMC free article] [PubMed] [Google Scholar]
- Schäfer, E., and Nagy, F., eds (2006). Photomorphogenesis in Plants and Bacteria, 3rd ed: Function and Signal Transduction Mechanisms. (Dordrecht, The Netherlands: Springer).
- Wan, Y., Eisinger, W., Ehrhardt, D., Kubitschek, U., Baluska, F., and Briggs, W.R. (2008). The subcellular localization and blue-light-induced movement of phototropin 1-GFP in etiolated seedlings of Arabidopsis thaliana. Mol. Plant 1 103–117. [DOI] [PubMed] [Google Scholar]
- Whippo, C.W., and Hangarter, R.P. (2003). Second positive phototropism results from coordinated co-action of the phototropins and cryptochromes. Plant Physiol. 132 1499–1507. [DOI] [PMC free article] [PubMed] [Google Scholar]
- Whippo, C.W., and Hangarter, R.P. (2004). Phytochrome modulation of blue-light-induced phototropism. Plant Cell Environ. 27 1223–1228. [Google Scholar]
- Zimmerman, B.K., and Briggs, W.R. (1963). Phototropic dosage-response curves for oat coleoptiles. Plant Physiol. 38 248–253. [DOI] [PMC free article] [PubMed] [Google Scholar]


