

Abstract
The Fatigue Symptom Inventory (FSI) has been used extensively to assess and measure fatigue in a number of clinical populations. The purpose of the present study was to further establish its utility by examining its operating characteristics and determining the optimal cutoff score for identifying clinically meaningful fatigue. The SF-36 Vitality scale, a measure widely used to identify individuals with significant fatigue-related disability, was used to determine the sensitivity and specificity of the FSI. Results indicate that a score of 3 or greater on those items assessing fatigue in the past week is the optimal cutoff score for identifying clinically meaningful fatigue. Individuals who scored at or above the cutoff also reported significantly greater fatigue interference, more days of fatigue on average, and fatigue a greater proportion of each day in the past week. Findings suggest that the FSI can be used to discriminate effectively between individuals with and without clinically meaningful fatigue.
Keywords: Fatigue, Fatigue Symptom Inventory
Introduction
Fatigue is generally defined as a sense of persistent tiredness or exhaustion that is often distressing to the individual. It is a common symptom of many diseases, including cancer [1], neurological disorders such as multiple sclerosis [2], and psychiatric disorders such as depression [3]. Among adult cancer patients, fatigue is often the most common symptom reported [4-6]. Fatigue also is common in the general population [7,8]. One epidemiological study of working adults found that 98% reported some degree of fatigue and one in five reported substantial fatigue [9].
Fatigue is a subjective phenomenon and is thus assessed most accurately by individual self-report. To this end, researchers have published a plethora of self-report instruments designed to assess and measure fatigue. A recent survey of fatigue measurement scales published between 1975 and 2004 identified a total of 71 scales focusing specifically on fatigue used in 416 studies [10]. The information obtained via these measures depends on the developer's conceptualization of fatigue and the respondents' interpretation of the questions being asked [11]. The utility of any one scale rests ultimately on its reliability and validity. A review by Dittner et al. [11] of 30 published fatigue scales noted that many fatigue scales have been published without basic data about their reliability or evidence of sensitivity to change. Further, few scales have demonstrated an ability to discriminate clinical cases of fatigue from noncases, with acceptable levels of sensitivity and specificity [11]. That is, few scales have established cutoff scores to determine clinically meaningful fatigue.
The FSI, first published in 1998 [12], has been used extensively to assess fatigue, especially among cancer patients. Its psychometric properties were originally established in women undergoing treatment for breast cancer, women who have completed treatment for breast cancer, and women with no history of cancer [12]. It was further validated in a study of males and females with a variety of different cancer diagnoses [13]. The scale has been used since to assess fatigue in a number of clinical populations including breast cancer patients [14], patients undergoing hematopoietic stem cell transplantation [15], hepatocellular cancer patients undergoing stereotactic radiotherapy [16], and patients with chronic fatigue syndrome [17]. The FSI has proven to be a valid and reliable measure of fatigue in medically ill patients and healthy individuals, and reviewers have suggested that it is a useful tool for the assessment of fatigue [11].
The purpose of the present study was to further establish the usefulness of the FSI by examining its operating characteristics and determining the optimal cutoff score for identifying clinically meaningful fatigue. To accomplish this, we recruited a relatively large sample of women with no history of cancer who completed both the FSI and the SF-36 Vitality scale [18]. We used receiver operating characteristic (ROC) curve analyses of FSI scores to determine the optimal FSI cutoff score relative to the established SF-36 Vitality scale. ROC analysis has been used previously to establish cutoff scores on general measures of fatigue including the Schedule of Fatigue and Anergia [19] and the Checklist Individual Strength [20], and on disease-specific measures such as the Bath Ankylosing Spondylitis Disease Activity Index [21]. Although there is not an accepted standard for the assessment of fatigue, the SF-36 Vitality scale is commonly used to validate instruments designed to assess fatigue in the general population and in patient samples (see for example, Kleinman et al. [22]). Thus researchers have suggested that using the SF-36 Vitality scores of the general population as reference data is a valid approach for establishing cutoff scores on measures of fatigue [21]. In order to indicate significant health-related limitations, previous studies [23-25] dichotomized the Vitality scale based on the 25th percentile. That is, individuals scoring at or below the 25th percentile were considered to be experiencing limitations due to fatigue while those scoring above the 25th percentile were not considered to be suffering such limitations. Once the optimal FSI cutoff score was identified, we sought to explore whether interference related to fatigue, the duration of fatigue, and demographic factors differentiated individuals who scored above or below this cutoff score.
Methods
Participants
Participants were recruited as part of a larger study comparing quality of life in women being treated for early stage breast cancer and women with no history of cancer. Eligibility criteria for women with no history of cancer were that they must: a) be within five years of the age of the breast cancer patient to whom they would be matched in the larger study; b) reside within the same zip code as the patient to whom they would be matched; c) have no discernable psychiatric or neurological disorders that would interfere with study participation; d) be able to speak and read standard English; e) report no history of cancer (other than basal cell skin carcinoma) or other potentially life-threatening diseases (e.g., AIDS); and f) report no history of a condition in which fatigue is a prominent symptom (e.g., multiple sclerosis or chronic fatigue syndrome).
Procedure
Potential participants were identified using a database maintained by Marketing Systems Group, Inc. (Fort Washington, PA) that draws from all listed telephone households in the United States and is estimated to include demographic and contact information for approximately two-thirds of the U.S. population. For each patient who completed the six-month assessment in the larger study, up to 25 women who resided in the same zip code and were within five years of the patient's age were selected randomly from the database. One of these women was selected at random and sent a letter of introduction describing the study. If this woman did not opt out by calling a toll-free telephone number or returned a postcard expressing interest in the study, telephone contact was initiated to further determine eligibility. If she met all eligibility criteria and verbally agreed to participate, an appointment was set up to obtain written informed consent and conduct an assessment. If the first woman selected could not be reached, was ineligible, refused to participate, or did not keep the appointment, another woman on the list was selected randomly until a woman matched to the patient was recruited and completed the assessment.
Measures
Demographic data were obtained via a standardized self-report questionnaire. Variables assessed were age, race/ethnicity, marital status, annual household income, educational level, height, weight, and menopausal status.
The FSI [12] is a 14-item measure that assesses the frequency and severity of fatigue and its perceived interference. The measure includes three items specific to fatigue severity in the past week. Participants rate on 11-point scales (0 = not at all fatigued, 10 = as fatigued as I could be) their level of fatigue: 1) on average in the past week (FSI average), 2) on the day they felt most fatigued in the past week (FSI most), and 3) on the day they felt least fatigued in the past week (FSI least). A composite fatigue score (FSI composite) was derived by calculating the average across the three severity items. This composite fatigue score showed high internal consistency (alpha = 0.84). Analyses focused on the operating characteristics of the FSI average score and FSI composite score. Analyses also were conducted using participants' average rating of the degree (0 = no interference, 10 = extreme interference) to which fatigue interfered with their general activity, ability to bathe and dress, normal work activity, ability to concentrate, relations with others, enjoyment of life, and mood (FSI interference); participants' ratings of the number of days in the past week (0 to 7) they felt fatigued (FSI days); and participants' ratings of what percent of each day (0 to 100), on average, they felt fatigued in the past week (FSI percent).
The Acute (past week) Version of the MOS 36-Item Short Form [18,26] (SF-36) is a widely used self-report measure designed to assess perceived health and functioning. The instrument consists of eight scales: Physical Functioning, Role-Physical; Bodily Pain; General Health; Vitality; Social Functioning; Mental Health; and Role-Emotional. Each scale is standardized on a 0 to 100 metric with higher scores indicating better functioning. Analyses focused on the Vitality scale which consists of four items assessing how much of the time in the past week participants felt “full of pep,” had “a lot of energy,” felt “worn out,” and felt “tired.” The latter two items are reverse coded prior to scoring. Responses range from “all of the time” to “none of the time.” In analyses focused on the operating characteristics of the FSI, participants were classified as fatigued if their Vitality scale score was less than or equal to 45. This score corresponds to the 25th percentile for females in the U.S. general population [18], and is consistent with previous research demonstrating that the 25th percentile is the most appropriate dichotomous indicator of health-related limitations [23]. Although previous research has demonstrated that a score of 50 is indicative of biologic and psychologic differences in fatigue [27-32], we chose the more stringent score of 45 as the criterion to increase the robustness of our results.
Results
Demographic Characteristics
The demographic characteristics of the sample are presented in Table 1. The mean age of the women was 56 years (range 28 - 79). The vast majority was white, married, and nearly half had a college degree. More than two-thirds had annual household incomes > $40,000. The average body mass index was 27 and 72% of the women were post-menopausal.
Table 1.
Demographic Characteristics of the Sample (n = 265)
| Age in years (mean ± SD) | 56.34 ± 9.42 |
|---|---|
| Race/ethnicity | |
| White | 252 (95.1) |
| Non-white | 13 (4.9) |
| Marital status | |
| Married or marriage-like | 184 (69.4) |
| Not married | 81(30.6) |
| Education | |
| College degree | 126 (47.5) |
| Less than college degree | 139 (52.5) |
| Household income | |
| < $40,000 per year | 72 (27.2) |
| ≥ $40,000 per year | 193 (72.8) |
| Menopausal status | |
| Pre-menopausal | 70 (27.9) |
| Peri- or post-menopausal | 181 (72.1) |
| Body mass index (mean ± SD) | 27.69 ± 6.85 |
Establishment of a Fatigue Cutoff Score
Tables 2 and 3 list the frequency distribution of FSI average scores and FSI composite scores, respectively. The mean FSI average score for the sample was 2.40 (standard deviation = 2.01) and the mean FSI composite score was 2.51 (standard deviation = 1.84). ROC curves were constructed for sensitivity and 1-specificity for the range of possible scores on FSI average and FSI composite compared with normative data for females in the U.S. general population (Figures 1 and 2). Based on established norms, the cutoff for fatigue-related disability was defined as a Vitality score > 45 [18,23]. The ROC curves are graphic representations of the trade-off between the sensitivity (true-positive rate) and specificity (true-negative rate) for every possible cutoff score on FSI average and FSI composite. The area under the curve (AUC) in each ROC curve provides an estimate of the overall discriminative accuracy of these items relative to the established cutoff score for the Vitality scale. In ROC analysis, an AUC of 1 represents a test with perfect accuracy relative to the established criterion, whereas an AUC of 0.5 represents a test with no apparent accuracy relative to the established criterion. In the current study, the AUC for each FSI fatigue measure was 0.75 using the 25th percentile on the Vitality scale as the criterion. This value is in the range typically characterized as representing good overall accuracy. Visual inspection of the ROC curves for FSI average and FSI composite suggests that a score ≥ 3 is the optimal cutoff for identifying significant fatigue using the Vitality scale as the criterion.
Table 2.
Frequency Distribution of FSI Average Scores
| Score | Frequency | % | Cumulative % |
|---|---|---|---|
| 0 | 43 | 16.2 | 16.2 |
| 1 | 65 | 24.5 | 40.8 |
| 2 | 48 | 18.1 | 58.9 |
| 3 | 40 | 15.1 | 74.0 |
| 4 | 31 | 11.7 | 85.7 |
| 5 | 18 | 6.8 | 92.5 |
| 6 | 7 | 2.6 | 95.1 |
| 7 | 6 | 2.3 | 97.4 |
| 8 | 6 | 2.3 | 99.6 |
| 10 | 1 | 0.0 | 100.0 |
Table 3.
Frequency Distribution of FSI Composite Scores
| Score | Frequency | % | Cumulative % |
|---|---|---|---|
| 0 | 27 | 10.2 | 10.2 |
| > 0 ≤ 1 | 47 | 17.7 | 27.9 |
| > 1 ≤ 2 | 54 | 20.4 | 48.3 |
| > 2 ≤ 3 | 48 | 18.1 | 66.4 |
| > 3 ≤ 4 | 41 | 15.5 | 81.9 |
| > 4 ≤ 5 | 25 | 9.4 | 91.3 |
| > 5 ≤ 6 | 11 | 4.2 | 95.5 |
| > 6 ≤ 7 | 8 | 3.0 | 98.5 |
| > 7 | 4 | 1.5 | 100.0 |
Figure 1.
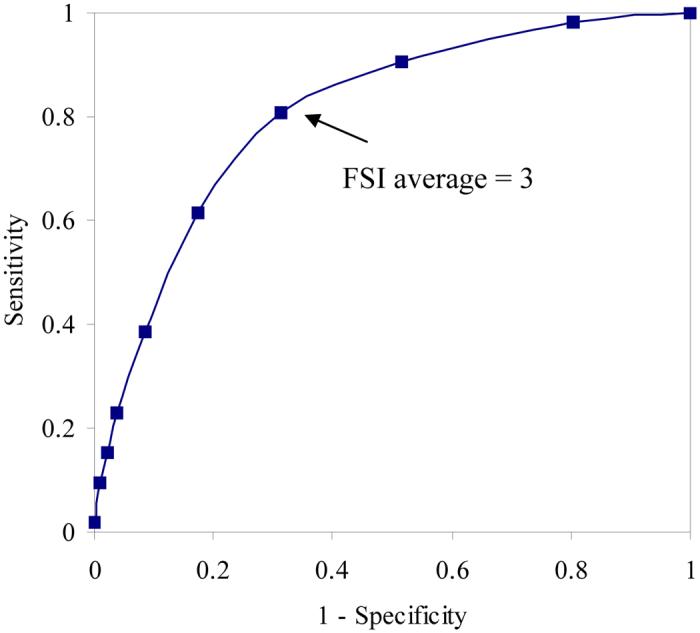
Receiver operating characteristic curve analysis comparing FSI average scores with established Vitality cutoff score of > 45.
Figure 2.
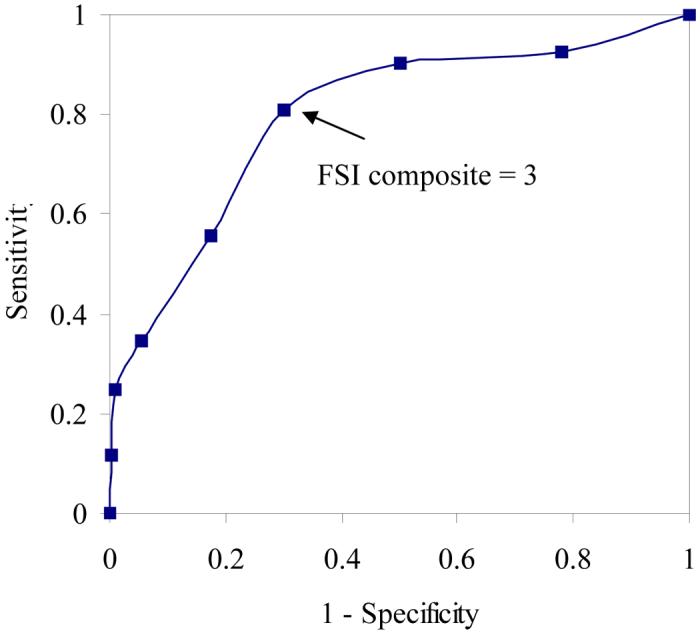
Receiver operating characteristic curve analysis comparing FSI composite scores with established Vitality cutoff score of > 45.
The classification of participants based on a cutoff score of 3 on FSI average and FSI composite relative to the 25th percentile of the Vitality scale is illustrated in Table 4. This cutoff score on FSI average yielded a sensitivity of 0.81 and a specificity of 0.69 relative to the 25th percentile of the Vitality scale. On FSI composite it yielded a sensitivity of 0.81 and specificity of 0.70 relative to the 25th percentile of the Vitality cutoff score. Other cutoff scores yielded less optimal results. For example, a cutoff score of 4 on FSI average yielded a sensitivity of 0.62 and a specificity of 0.83 relative to the 25th percentile of the Vitality scale. On FSI composite it yielded a sensitivity of 0.56 and specificity of 0.83 relative to the 25th percentile of the Vitality cutoff score.
Table 4.
Correspondence of FSI Average and FSI Composite with the Vitality Scale of the SF-36
| SF-36 Vitality Scale Frequency (%) | ||
|---|---|---|
| > 45 | ≤ 45 | |
| FSI averagea | ||
| < 3 | 146 (55.1) | 10 (3.8) |
| ≥ 3 | 67 (25.3) | 42 (15.9) |
| FSI compositeb | ||
| < 3 | 149 (56.2) | 10 (3.8) |
| ≥ 3 | 64 (24.2) | 42 (15.9) |
Chi-squared = 41.98, P < 0.0001.
Chi-squared = 44.80, P < 0.0001.
Relation of Fatigue ≥ 3 Cutoff Score to Demographic Characteristics
Chi-squared analyses and analysis of variance were conducted to explore the relation of the FSI average and FSI composite cutoff score of 3 to demographic characteristics. As shown in Table 5, none of the demographic characteristics assessed were related significantly to the FSI average cutoff score. Similarly, none of the demographic characteristics were associated with the FSI composite cutoff score of 3.
Table 5.
Relation of the FSI Average and Composite Cutoff Score of 3 to Demographic Characteristics. Number of participants (%).
| FSI average | FSI composite | |||||
|---|---|---|---|---|---|---|
| < 3 | ≥ 3 | P | < 3 | ≥ 3 | P | |
| Age in years (mean ± SD) | 56.5 ± 9.6 | 56.2 ± 9.2 | .82 | 57.1 ± 9.6 | 55.3 ± 9.0 | .13 |
| Race/ethnicity | ||||||
| White | 7 (2.6) | 6 (2.3) | .71 | 6 (2.3) | 7 (2.6) | .30 |
| Non-white | 149 (56.2) | 103 (38.9) | 153 (57.7) | 99 (37.4) | ||
| Marital status | ||||||
| Married | 110 (41.5) | 74 (27.9) | .65 | 112 (42.3) | 72 (27.2) | .66 |
| Not married | 46 (17.4) | 35 (13.2) | 47 (17.7) | 34 (12.8) | ||
| Education | ||||||
| College degree | 78 (29.4) | 48 (18.1) | .34 | 81 (30.6) | 45 (17.0) | .18 |
| Less than college degree | 78 (29.4) | 61 (23.0) | 78 (29.4) | 61 (23.0) | ||
| Household income | ||||||
| < $40,000 per year | 40 (15.1) | 32 (12.1) | .50 | 42 (15.9) | 30 (11.3) | .74 |
| ≥ $40,000 per year | 116 (43.8) | 77 (29.1) | 117 (44.2) | 76 (28.7) | ||
| Menopausal status | ||||||
| Pre-menopausal | 43 (17.1) | 27 (10.8) | .62 | 43 (17.1) | 27 (10.8) | .80 |
| Peri- or post-menopausal | 105 (41.8) | 76 (30.3) | 108 (43.0) | 73 (29.1) | ||
| Body mass index (mean ± SD) | 27.7 ± 5.9 | 27.6 ± 8.0 | .92 | 27.5 ± 6.3 | 28.0 ± 7.6 | .60 |
Relation of Fatigue ≥ 3 Cutoff Score to Fatigue Interference
Analyses of variance indicated that women who scored above the FSI average cutoff reported significantly greater FSI interference compared to women who scored below the cutoff (2.29 ± 1.80 versus 0.41 ± 0.58, P < 0.0001). Similarly, women who scored above the FSI composite cutoff reported significantly greater fatigue interference compared to women who scored below the cutoff (2.31 ± 1.82 versus 0.42 ± 0.61, P < 0.0001).
Relation of Fatigue ≥ 3 Cutoff Score to Fatigue Duration
Analyses of variance also indicated that the FSI average cutoff score of 3 was significantly associated with differences in both FSI days and FSI percent. Women who scored above the FSI average cutoff reported that they felt fatigued an average of 4.11 ± 1.97 days in the past week versus 1.56 ± 1.65 days for women below the cutoff (P < 0.0001). Compared to women below the cutoff, women above the cutoff also reported significantly greater FSI percent; they felt fatigued a significantly greater proportion of the day in the past week: an average of 36.9% versus 14.0%, (P < 0.0001).
Similar results were obtained for the FSI composite cutoff. Compared to women below the cutoff, women above the cutoff reported significantly more days of fatigue on average: 4.06 ± 2.03 versus 1.6 ± 1.70 (P< 0.0001). Women above the cutoff also reported that they felt fatigued a significantly greater proportion of the day in the past week: an average of 37.5% versus 14.2% (P < 0.0001).
Relation of Fatigue ≥ 3 Cutoff Score to Vitality
Finally, analysis of variance was conducted to examine whether there were differences in the Vitality continuous score between women below and above the FSI average and FSI composite cutoff score of 3. With respect to the FSI average cutoff, women above the cutoff reported significantly higher average Vitality scores than women below the cutoff: 71.8 ± 15.27 compared to 49.27 ± 19.40, (P < 0.0001). Likewise, women above the FSI composite cutoff reported significantly higher average Vitality scores: 71.64 + 15.06 compared to 48.82 ± 19.60, (P < 0.0001).
Discussion
The results of the current study indicate that a score of 3 or greater for FSI average or the FSI composite is the optimal cutoff for identifying clinically meaningful fatigue using the FSI. That is, this score yielded the optimal sensitivity and specificity relative to the established cutoff score on the SF-36 Vitality scale. There were no demographic characteristics associated with scoring at or above the cutoff of 3. Individuals who scored at or above the cutoff reported significantly greater fatigue interference, more days of fatigue on average, and fatigue a greater proportion of each day. As expected, individuals who reported a 3 or greater fatigue score also had significantly higher Vitality scores.
The FSI compares favorably with the SF-36 Vitality scale. This conclusion is based on the AUC statistics obtained when comparing the full range of FSI average and FSI composite scores with the established cutoff score on the Vitality scale (AUC = 0.75 in both cases). These results show that the FSI, specifically those items concerning fatigue severity in the past week, can discriminate between those individuals with and without clinically meaningful fatigue.
As noted previously, few published measures of fatigue include a cutoff score by which to determine the presence or absence of clinically meaningful fatigue [11]. Thus, study findings make the FSI relatively unique among fatigue assessment measures. The establishment of a cutoff score on the FSI greatly expands the instrument's utility. For example, researchers may find it useful to dichotomize samples based on a cutoff score of 3 into groups with and without clinically meaningful fatigue. Subsequent analyses would then focus on elucidating those physiological and psychosocial factors that contribute to the development and persistence of fatigue. A score of 3 or greater also might be used as an eligibility criterion for participation in intervention trials focused on treating clinically meaningful fatigue. Finally, the cutoff score may be useful clinically in screening for fatigue among medically ill patients. A “positive” screen for clinically meaningful fatigue could initiate a more comprehensive work up or assessment and the identification of contributing factors or treatable causes of the fatigue.
Strengths of the current study should be noted. The sample size was relatively large and was recruited using an outreach procedure designed to limit participation bias. We compared the FSI to the SF-36 Vitality scale, a measure that has been widely used with both healthy and medically ill populations and has established norms for identifying individuals with significant fatigue. In addition, we used statistical methods appropriate for the identification of an optimal cutoff score. The current study also has several noteworthy limitations. Only women were included in the study sample and the majority was peri- or post-menopausal. There also was limited diversity within the sample with respect to ethnicity, education, and socioeconomic status. Thus, the operating characteristics of the FSI cutoff score are unknown in men and in minority populations and low-literacy populations of women. Finally, the finding that a cutoff score of 3 on FSI average or the FSI composite measure yielded the optimal combination of sensitivity and specificity was not cross-validated in a second sample of individuals. Findings that a similar cutoff score was obtained in another sample of healthy individuals would increase confidence in our findings.
In conclusion, the present study further establishes the usefulness of the FSI by determining that an FSI average or FSI composite score of 3 or greater is indicative of clinically meaningful fatigue. This cutoff score yielded the optimal sensitivity and specificity relative to the widely used SF-36 Vitality scale. The cutoff score also classified effectively those individuals with greater fatigue-related interference and fatigue duration. These findings support the continued use of the FSI not only as a means of assessing fatigue but also as a means of distinguishing those individuals with clinically meaningful fatigue.
Acknowledgments
This work was supported by National Cancer Institute Grant R01 CA82822.
Footnotes
Publisher's Disclaimer: This is a PDF file of an unedited manuscript that has been accepted for publication. As a service to our customers we are providing this early version of the manuscript. The manuscript will undergo copyediting, typesetting, and review of the resulting proof before it is published in its final citable form. Please note that during the production process errors may be discovered which could affect the content, and all legal disclaimers that apply to the journal pertain.
References
- 1.Prue G, Rankin J, Allen J, Gracey J, Cramp F. Cancer-related fatigue: A critical appraisal. Eur J Cancer. 2006;42(7):846–863. doi: 10.1016/j.ejca.2005.11.026. [DOI] [PubMed] [Google Scholar]
- 2.MacAllister WS, Krupp LB. Multiple sclerosis-related fatigue. Phys Med Rehabil Clin N Am. 2005;16:483–502. doi: 10.1016/j.pmr.2005.01.014. [DOI] [PubMed] [Google Scholar]
- 3.Baldwin DS, Papakostas GI. Symptoms of fatigue and sleepiness in major depressive disorder. J Clin Psychiatry. 2006;67:9–15. [PubMed] [Google Scholar]
- 4.Andrykowski MA, Cordova MJ, Hann DH, et al. Patients' psychosocial concerns following stem cell transplantation. Bone Marrow Transplant. 1999;24:1121–1129. doi: 10.1038/sj.bmt.1702022. [DOI] [PubMed] [Google Scholar]
- 5.Baker F, Denniston M, Smith T, West MM. Adult cancer survivors: How are they faring. Cancer. 2005;104:2565–2576. doi: 10.1002/cncr.21488. [DOI] [PubMed] [Google Scholar]
- 6.Fox SW, Lyon DE. Symptom clusters and quality of life in survivors of lung cancer. Oncol Nurs Forum. 2006;33:931–936. doi: 10.1188/06.ONF.931-936. [DOI] [PubMed] [Google Scholar]
- 7.Loge JH, Ekeberg O, Kaasa S. Fatigue in the general Norwegian population: Normative data and associations. J Psychosom Res. 1998;45:53–65. doi: 10.1016/s0022-3999(97)00291-2. [DOI] [PubMed] [Google Scholar]
- 8.Watt T, Groenvold M, Bjorner JB, et al. Fatigue in the Danish general population. Influence of sociodemographic factors and disease. J Epidemiol Community Health. 2000;54:827–833. doi: 10.1136/jech.54.11.827. [DOI] [PMC free article] [PubMed] [Google Scholar]
- 9.Bültmann U, Kant I, Kasl SV, Beurskens AJ, van den Brandt PA. Fatigue and psychological distress in the working population: Psychometrics, prevalence, and correlates. J Psychosom Res. 2002;52:445–452. doi: 10.1016/s0022-3999(01)00228-8. [DOI] [PubMed] [Google Scholar]
- 10.Hjollund NH, Andersen JH, Bech P. Assessment of fatigue in chronic disease: a bibliographic study of fatigue measurement scales. Health Qual Life Outcomes. 2007;5:12. doi: 10.1186/1477-7525-5-12. [DOI] [PMC free article] [PubMed] [Google Scholar]
- 11.Dittner AJ, Wessely SC, Brown RG. The assessment of fatigue: a practical guide for clinicians and researchers. J Psychosom Res. 2004;56:157–170. doi: 10.1016/S0022-3999(03)00371-4. [DOI] [PubMed] [Google Scholar]
- 12.Hann DM, Jacobsen PB, Azzarello LM, et al. Measurement of fatigue in cancer patients: development and validation of the Fatigue Symptom Inventory. Qual Life Res. 1998;7:301–310. doi: 10.1023/a:1024929829627. [DOI] [PubMed] [Google Scholar]
- 13.Hann DM, Denniston MM, Baker F. Measurement of fatigue in cancer patients: further validation of the Fatigue Symptom Inventory. Qual Life Res. 2000;9:847–854. doi: 10.1023/a:1008900413113. [DOI] [PubMed] [Google Scholar]
- 14.Donovan KA, Jacobsen PB, Andrykowski MA, et al. Course of fatigue in women receiving chemotherapy and/or radiotherapy for early stage breast cancer. J Pain Symptom Manage. 2004;28:373–380. doi: 10.1016/j.jpainsymman.2004.01.012. [DOI] [PMC free article] [PubMed] [Google Scholar]
- 15.Hacker ED, Ferrans CE. Ecological momentary assessment of fatigue in patients receiving intensive cancer therapy. J Pain Symptom Manage. 2007;33:267–275. doi: 10.1016/j.jpainsymman.2006.08.007. [DOI] [PubMed] [Google Scholar]
- 16.Lai YH, Shun SC, Hsiao YL, et al. Fatigue experiences in hepatocellular carcinoma patients during six weeks of stereotactic radiotherapy. Oncologist. 2007;12:221–230. doi: 10.1634/theoncologist.12-2-221. [DOI] [PubMed] [Google Scholar]
- 17.Siegel SD, Antoni MH, Fletcher MA, et al. Impaired natural immunity, cognitive dysfunction, and physical symptoms in patients with chronic fatigue syndrome: preliminary evidence for a subgroup. J Psychosom Res. 2006;60:559–566. doi: 10.1016/j.jpsychores.2006.03.001. [DOI] [PubMed] [Google Scholar]
- 18.Ware JE. SF-36 Health Survey: Manual and interpretation guide. The Health Institute, New England Medical Center; Boston, MA: 1993. [Google Scholar]
- 19.Hadzi-Pavlovic D, Hickie IB, Wilson AJ, et al. Screening for prolonged fatigue syndromes: Validation of the SOFA scale. Soc Psychiatry Psychiatr Epidemiol. 2000;35:471–479. doi: 10.1007/s001270050266. [DOI] [PubMed] [Google Scholar]
- 20.Bültmann U, de Vries M, Beurskens AJHM, et al. Measurement of prolonged fatigue in the working population: determination of a cutoff point for the Checklist Individual Strength. J Occup Health Psychol. 2000;5:411–416. doi: 10.1037//1076-8998.5.4.411. [DOI] [PubMed] [Google Scholar]
- 21.Dagfinrud H, Vollestad NK, Loge JH, Kvien TK, Mengshoel AM. Fatigue in patients with ankylosing spondylitis: a comparison with the general population and associations with clinical and self-reported measures. Arthritis Rheum. 2005;53:5–11. doi: 10.1002/art.20910. [DOI] [PubMed] [Google Scholar]
- 22.Kleinman L, Zodet MW, Hakim Z, et al. Psychometric evaluation of the Fatigue Severity Scale for use in chronic hepatitis C. Qual Life Res. 2000;9:499–508. doi: 10.1023/a:1008960710415. [DOI] [PubMed] [Google Scholar]
- 23.Rose SR, Koshman ML, Spreng S, Sheldon R. Statistical issues encountered in the comparison of health-related quality of life in diseased patients to published general population norms: problems and solutions. J Clin Epidemiol. 1999;52(5):405–412. doi: 10.1016/s0895-4356(99)00014-1. [DOI] [PubMed] [Google Scholar]
- 24.Torres MS, Calderón SM, Díaz IR, et al. Health-related quality of life in coronary heart disease compared to norms in Spanish population. Qual Life Res. 2004;13:1401–1407. doi: 10.1023/B:QURE.0000040783.94127.a3. [DOI] [PubMed] [Google Scholar]
- 25.Préau M, Marcellin F, Carrieri MP, et al. Health-related quality of life in French people living with HIV in 2003: results from the national ANRS-EN12-VESPA Study. AIDS. 2007;21(suppl 1):S19–S27. doi: 10.1097/01.aids.0000255081.24105.d7. [DOI] [PubMed] [Google Scholar]
- 26.Ware JE. The SF-36 Physical and Mental Health Summary Scales: A user's manual. The Health Institute: New England Medical Center; Boston, MA: 1994. [Google Scholar]
- 27.Bower JE, Ganz PA, Desmond KA, et al. Fatigue in breast cancer survivors: occurrence, correlates, and impact on quality of life. J Clin Oncol. 2000;18:743–753. doi: 10.1200/JCO.2000.18.4.743. [DOI] [PubMed] [Google Scholar]
- 28.Bower JE, Ganz PA, Aziz N, Fahey JL. Fatigue and proinflmammatory cytokine activity in breast cancer survivors. Psychosom Med. 2002;64:604–611. doi: 10.1097/00006842-200207000-00010. [DOI] [PubMed] [Google Scholar]
- 29.Bower JE, Ganz PA, Aziz N, Fahey JL, Cole SW. T-cell homeostatis in breast cancer survivors with persistent fatigue. J Natl Cancer Inst. 2003;95:1165–1168. doi: 10.1093/jnci/djg0019. [DOI] [PubMed] [Google Scholar]
- 30.Bower JE, Ganz PA, Aziz N. Altered cortisol response to psychologic stress in breast cancer survivors with persistent fatigue. Psychosom Med. 2005;67:277–280. doi: 10.1097/01.psy.0000155666.55034.c6. [DOI] [PubMed] [Google Scholar]
- 31.Bower JE, Ganz PA, Dickers SS, et al. Diurnal cortisol rhythm and fatigue in breast cancer survivors. Psychoneuroendocrinology. 2005;30:92–100. doi: 10.1016/j.psyneuen.2004.06.003. [DOI] [PubMed] [Google Scholar]
- 32.Bower JE, Ganz PA, Desmond KA, et al. Fatigue in long-term breast carcinoma survivors. Cancer. 2006;106:751–758. doi: 10.1002/cncr.21671. [DOI] [PubMed] [Google Scholar]