Abstract
The role of target salience in crowding has remained controversial largely because salience usually escapes objective measurement. Here we address this problem using search efficiency as a measure of target salience. In separate experiments, observers determined whether parafoveal arrays of vertical Gabor patterns contained targets having a unique colour, a unique direction of motion and a unique temporal frequency. We analysed search efficiency in the conventional manner using reaction-time gradients, with units s/item. We also considered accuracy gradients, with units percent correct/item. Crowding is typically quantified by comparing the acuity for a target within an array to the acuity for a target presented alone. We measured orientation acuity for determining whether a slightly tilted target was clockwise or anticlockwise of vertical. Targets with a unique colour or direction of motion were found to pop out, i.e. (with one exception) reaction-time and accuracy gradients were insignificantly different from zero. Acuity for these targets was significantly greater than acuity for targets whose neighbours had the same colour and direction of motion. Manipulation of temporal frequency produced a wide range of search efficiencies. For three of four observers, we found a linear relationship between acuity and the accuracy gradient; shallow gradients being associated with high acuity. In general, we find that crowding is weakened when observers can find a parafoveally presented target quickly and accurately.
INTRODUCTION
The deterioration of our ability to identify targets in the presence of distractors is referred to as crowding (Bouma 1970; Stuart and Burian 1962). Crowding tends to be greatest when target and distractors have similar stimulus properties, such as colour, shape and depth (Felisberti et al 2005; Kooi et al 1994; Nazir 1992). These studies appear to support Korte’s opinion (1923; quoted by Pelli et al, 2004) that distractors ‘squash’ less salient targets. However, with one exception (discussed below), none of these previous studies actually quantified target salience.
In this study we compare crowding with an independent measure of salience: search efficiency (Wolfe 1998). Salient targets are those that can be found quickly and accurately, regardless how many distractors there are. We sought to determine whether the extent of crowding could be predicted from target salience. Salience was manipulated by changing the target’s direction of motion, colour and temporal frequency. To determine the extent of crowding, we asked observers to discriminate between small changes in the target’s tilt.
Previous research (Nakayama & Silverman 1986) has shown that a target moving in one direction will “pop-out” from distractors moving in the opposite direction; that is, such targets are demonstrably salient. Therefore, in order to be consistent with our hypothesis, such targets should be resistant to crowding.
Searches for a unique colour are also very efficient, given a sufficient difference between target and distractors (Green & Anderson 1956; Nagy & Sanchez 1990; Nagy et al, 1990). Two of Kooi et al’s (1994) six observers suffered crowding even when the target had a unique colour. Kooi et al suggested that these two observers might not have experienced as strong a perceptual difference between target and distractors. Thus we decided to re-examine whether a uniquely coloured target can be crowded, this time with an independent measure of target salience.
Finally, we sought to systematically manipulate target/distractor differences, thereby allowing for a whole range of search efficiencies. For this purpose, we selected a stimulus property, temporal frequency, that had not hitherto been investigated with respect to crowding.
GENERAL METHODS
Experiments were written in MATLAB, using the Psychophysics Toolbox (Brainard 1997; Pelli 1997). The stimuli were displayed with a Dell monitor (1024 × 768 pixels; display area 36.7 cm × 27.5 cm; frame rate 75 Hz; mean luminance 70 cd/m2). Observations were carried out in a lighted room.
All observers had normal or corrected-to-normal visual acuity; three were the authors (CG, MM, JAS), the others were naive to the aim of the experiments (JK, MRC, SP, VA, GW, MOB). All data from each observer are shown below.
On each trial of each experiment, between one and nine stimulus items appeared in an array (see Fig. 1), randomly on the right or left of a point at the centre of the display. Observers were encouraged to maintain fixation on this point. At a viewing distance of 55 cm, the central item of each array appeared at 6.5 degrees of eccentricity. The stimulus configuration was a square. Outer items were centred either 1.09 or 1.53 degrees away from the centre of the central item.
FIG 1.
Sample stimuli used to measure acuity in Experiments 1 (a), 2 (b) and 3 (c). Observers had to identify the direction of the central target’s tilt, viewed at 6.5 degrees of eccentricity. In some conditions, the surrounding, distractors were absent. When present, the distractors could have the same or different colour, direction of drift or temporal frequency as the target. When search efficiency was measured, all elements were parallel. Observers decided whether any one of them had a unique colour, direction of drift or temporal frequency.
Acuity and search efficiency were measured in separate blocks. When the latter was measured, all items were parallel. On half the trials, an odd-man-out appeared at a random position. For example, this target item could have been green; the others (distractors) would have been white. The observer was required to decide “quickly and accurately,” whether an odd-man-out was displayed. In Experiment 2, the display remained visible until the observer pressed a key to indicate his or her choice. In Experiments 1 and 3, the displays remained visible for fixed durations (2 s in Experiment 1; either 1.6 or 3.2 s in Experiment 3, see below), which were longer than the longest reaction time recorded.
When acuity was measured, all items except the central target item were parallel. On half the trials, this target was also an odd-man-out. The observer was required to decide whether it was tilted clockwise or anti-clockwise. In Experiments 1 and 2, the display remained visible for 200 ms. In Experiment 3, the display was longer (see below). Observers were encouraged to be accurate as possible, without time constaints.
When acuity was measured, the target appeared with one of six tilts (three CW, three ACW), preselected to produce well-sampled psychometric functions relating the probability of a CW response to the size of the tilt, with ACW tilts counting as negative. The data were (maximum-likelihood) fit with two-parameter cumulative Gaussian functions. Analysing the data in this way made it possible to separate orientation acuity (1/σ) from bias (-μ). Confidence intervals were estimated by a bootstrap procedure (Efron 1979, 1982). That is, maximum-likelihood estimates of μ and σ were used to define a simulated observer who performed the same experiment as our human observers 120 times. After each simulation, threshold and sensitivity were estimated anew, and the 95% confidence interval for threshold is bounded by the fourth largest and fourth smallest of these new threshold estimates.
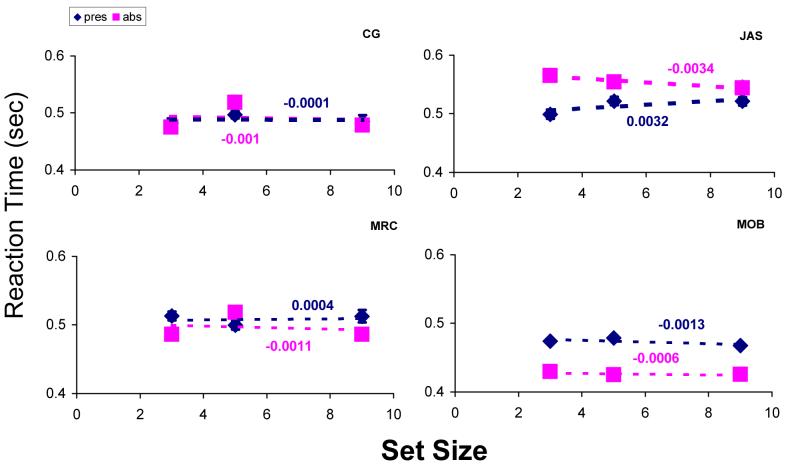
When search efficiency was measured, accuracy and reaction time were estimated separately for target-present and target-absent trials at three set-sizes i.e. arrays containing three, five and nine stimulus items. Gradients were then estimated by regressing accuracy and reaction-time estimates against set size (e.g. Figs. 2 and 4).
FIG 2.
Reaction times in searches for a unique direction of drift. Blue and pink symbols reflect target-present and target-absent conditions, respectively. Each data point summarises a minimum of 200 trials. Error bars contain the standard error. There was no significant increase in reaction time with set size for none of the four observers. Regression gradients are shown (in seconds per item).
FIG 4.
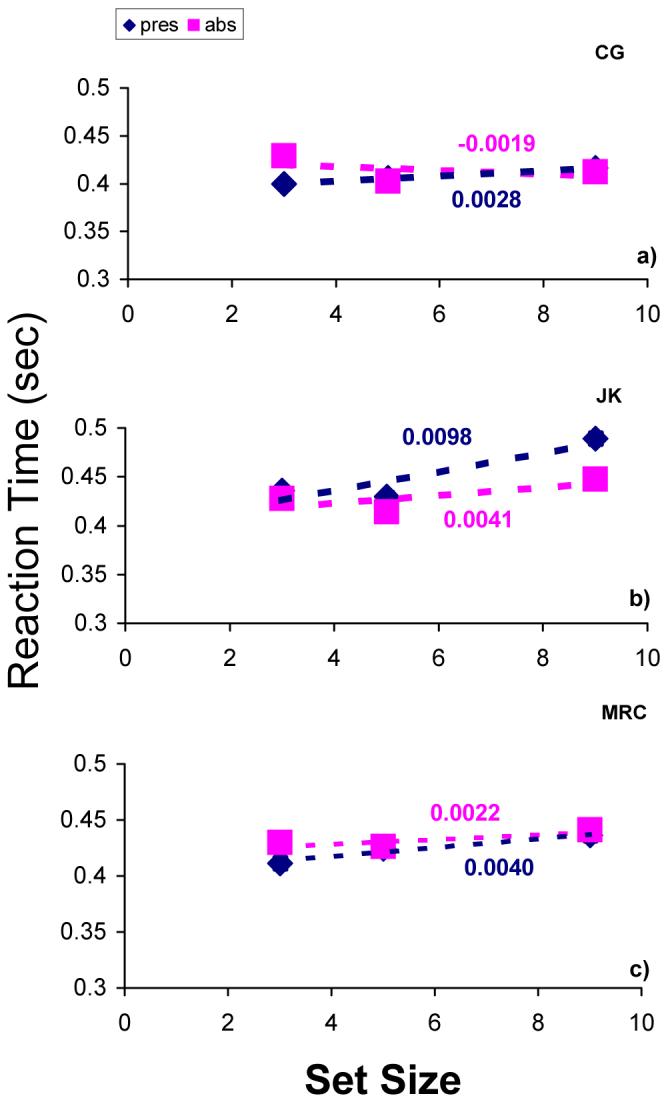
Reaction times in searches for a unique colour. Blue and pink symbols reflect target-present and target-absent conditions, respectively. Each data point summarises a minimum of 220 trials. Error bars contain the standard error. Reaction time increased significantly with set size in one condition only (CG, target present; panel a).
EXPERIMENT 1 (MOTION)
In Experiment 1, each stimulus item was a maximum-contrast (88%) drifting Gabor patch with spatial wavelength λx = 0.33°, temporal wavelength λt = 0.067 s and space constants σx = σy = 0.21°. Targets moving in a unique direction were found to pop-out. Specifically, neither reaction-time gradients nor percent-correct gradients were significantly different from zero for any observer (p > 0.5 except for JAS in the target-absent condition p = 0.1478; see Fig. 2). Accuracy exceeded 90% in all conditions.
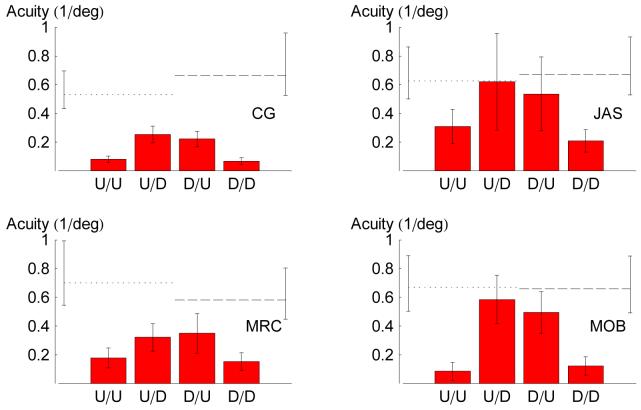
Acuities are illustrated in Fig. 3. Without distractors, baseline acuities ranged from 0.5 to 0.7 deg-1. For each observer, acuity was significantly reduced (p < 0.025) when the target appeared with distractors moving in the same direction. When the target appeared with oppositely moving distractors, acuity improved significantly (p < 0.05), in some cases (JAS and MOB) reaching the baseline value.
FIG 3.
Orientation acuities for CW/ACW judgments with respect to horizontal for CG (a) and JAS (b). Dotted and dashed lines reflect acuities for upward and downward drifting targets, respectively, without distractors. Different columns reflect different conditions, e.g. “U/D” is the condition in which the target drifted up and the distractors drifted down. Each column summarises a minimum of 120 trials. Error bars contain 95% confidence intervals. Acuity was worst when target and distractors shared the same direction of drift.
EXPERIMENT 2 (COLOUR)
In Experiment 2, each stimulus item was a white or green elongated Gaussian blob with large and small space constants σy = 0.47° and σx = 0.31°, respectively. No attempt was made to look for an isoluminance point. The peak of the white blob had an RGB value of [255 255 255]. The peak of the green blob had an RGB value of [127 254 127]. The background had an RGB value of [127 127 127].
As in the previous experiment, uniquely coloured targets were found very efficiently. The largest reaction-time gradient was < 10 ms/item and only one gradient was significantly different from zero (CG, target present: p = 0.037; all others: p > 0.5; see Fig. 4). No percent-correct gradients were significantly different from zero (p > 0.5), and accuracy exceeded 90% in all conditions.
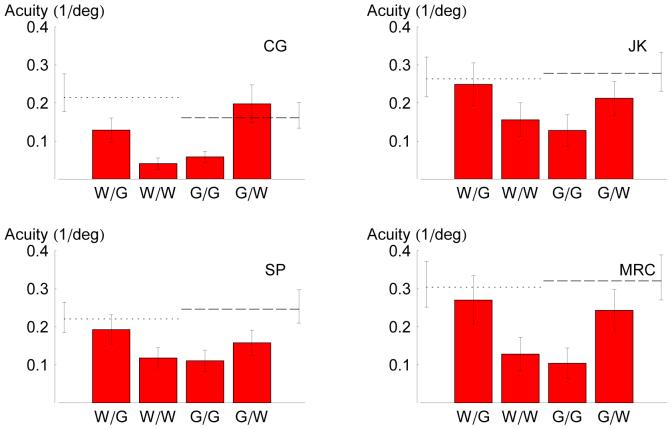
Acuities are illustrated in Fig. 5. Without distractors, baseline acuities ranged from 0.2 to 0.3 deg-1. For each observer, acuity was significantly reduced (p < 0.025) when the target appeared with identically coloured distractors. When the target appeared with differently coloured distractors, acuity improved significantly (p < 0.05), in some cases reaching the baseline values.
FIG 5.
Orientation acuities for CW/ACW judgments with respect to vertical for four observers. Dotted and dashed lines reflect acuities for white and green targets, respectively, without distractors. Different columns reflect different conditions, e.g. “W/G” indicates a green target and white distractors. Each column summarises a minimum of 360 trials. Error bars contain 95% confidence intervals. Acuity was worst when target and distractors shared the same colour.
EXPERIMENT 3 (TEMPORAL FREQUENCY)
In Experiment 3, each stimulus item was a (stationary, achromatic) Gabor patch (λx = 0.53°, σx = σy = 0.21°), whose contrast varied sinusoidally between 0 and w, at either 2.5, 7.5, 15 or 30 Hz. When acuity was measured, w was a Gaussian window, with time constant σt = 200 ms and a peak contrast of 88%. The Gaussian was curtailed at μ ± 2σ, giving a total display duration of 800 ms. In this phase of the experiment, JAS performed a total of 2,742 trials. Each of the other observers performed more than 4,000.
When search efficiency was measured, the temporal window w was a concatenated pair of the curtailed Gaussians described above. All observers except JAS were able to respond within the 1.6-s display. For JAS, four concatenated, curtailed Gaussians were used, producing a 3.2-s display. There were four target-absent conditions, one for each frequency; and twelve target-present conditions, one for each possible combination of target and distractor. All sixteen conditions were presented with equal frequency. Thus, when search efficiency was measured, the probability of a target in any given trial was 3/4. In this phase of the experiment, each observer performed a minimum of 576 trials.
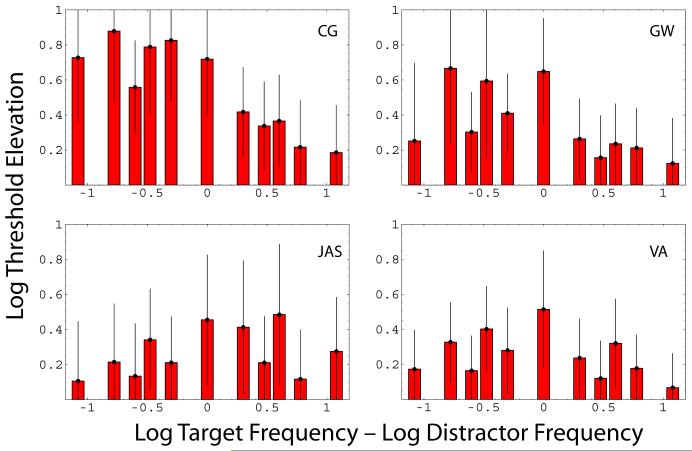
Without distractors, baseline acuities ranged from 0.4 to 0.7 deg-1. For each observer, acuity was significantly reduced (i.e. thresholds were significantly elevated; p < 0.05) when the target appeared with distractors having the same frequency. We expected acuity to improve with the difference between target and distractor frequencies. As can be seen in Fig. 6, the results from observer VA are consistent with this prediction. However, for CG and GW, acuity improvement (i.e. threshold reduction) was consistent only when the target frequency exceeded the distractor frequency. For JAS, acuity improvement was consistent only when the distractor frequency exceeded the target frequency.
FIG 6.
Log threshold elevations for four observers. A value of 1 indicates that distractors produce, on average, a 10-fold drop in orientation acuity. Different columns reflect different ratios of target frequency to distractor frequency. Error bars contain 95% confidence intervals.
In Experiments 1 and 2, search accuracy exceeded 90% correct in all conditions. Experiment 3 was different in this respect. Some observers seem to have sacrificed accuracy for speed, failing to achieve even 50% correct in some conditions. For example, when the target frequency was 7.5 Hz and the distractor frequency was 15, CG’s reaction-time gradient was a mere 1 ms/item; insignificantly greater than zero (p > 0.6244) and suggestive of a very efficient search. However, her accuracy significantly declined with set size (p < 0.0367), dropping approximately 4% with each additional distractor.
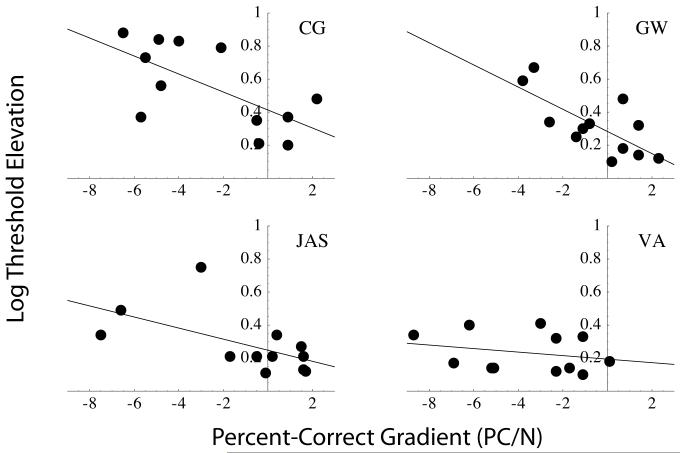
To get a better picture of the relationship between visual search and acuity, we simultaneously regressed log threshold elevations against reaction-time and percent-correct gradients. Specifically, we found the parameters b0, br and bp that minimized the sum of the squared errors in:
where ri, pi and Ei are the reaction-time gradient, percent-correct gradient and threshold elevation estimated from target-present condition i. The parameter br was not different from zero for any observer (CG: p = 0.99; GW: p = 0.34; VA: p = 0.83; JAS: p = 0.53). Therefore, we fixed the parameter br = 0, and once again regressed threshold elevations against percent-correct gradients for each observer. The data are shown with the regression lines in Fig. 7. For three of four observers, the parameter bp was significantly less than zero (CG: p = 0.021; GW: p = 0.008; JAS: p = 0.049), but for the fourth subject, bp was not significantly different from zero (p = 0.436).
FIG 7.
The relationship between distractor-induced threshold elevation (i.e. crowding) and salience, for four observers. In each panel, each point represents one combination of target and distractor frequencies. Conditions in which target and distractor frequencies were equal have be excluded from this figure. Log threshold elevation (i.e. the ratio between acuities for targets with and without distractors) has been regressed against the effects of set size (N) on reaction time percent correct (PC). Regression lines are shown. There was no significant relationship between threshold elevation and reaction-time gradient for any observer (not shown), but threshold elevation did increase significantly with the percent-correct gradient for observers CG,GW and JAS.
DISCUSSION
The results of Experiment 1 demonstrate that a target made highly salient because of its direction of drift is less suceptible to crowding than one in an array of similarly moving distractors. The results of Experiment 2 confirm a previous report (Kooi et al 1994) that uniquely coloured targets can be made similarly resistant to crowding. Kooi et al also reported results from observers for whom target colour made no difference. Had we found such an observer, it would have been interesting to see whether his or her search efficiency was comparable to that of the other observers, but we did not. Experiment 3 did allow us to compare tilt acuities for targets of various saliences. Using a perhaps somewhat novel index of search efficiency (the percent-correct gradient), we found a strong relationship between target salience and suceptibility to crowding in three of our four observers. On the basis of these results, it seems safe to concur with Korte; more salient targets are resistant to being “squashed” by distractors.
There is at least one exception to this rule, so glaring that it forced Felisberti et al (2005) to conclude that target salience had “at best, modest effects on crowding.” Distractors having a 22.5-deg tilt with respect to the (vertical) target could more than double tilt thresholds for CW/ACW judgments with regard to vertical (Solomon et al 2004). Prima facie, these results seem to suggest that even very salient targets can be crowded.
However, further experiments have revealed a unique mechanism for grossly-oblique-distractor-induced acuity loss (cf. the threshold and sub-threshold distractor tilts used by Parkes et al. 2001), which may be impervious to manipulations of target salience. Because of the tilt illusion (Gibson 1937), targets must be tilted toward oblique distractors in order to appear vertical. Gibson suggested that the labels “horizontal” and “vertical” shift from mechanisms preferring these orientations to those aligned with the visual context. Elsewhere (Solomon & Morgan 2006) we suggest that acuity suffers when the extent of this shift fluctuates from trial to trial.
We conclude that there may be several mechanisms responsible for crowding. One kind, seen with tilted distractors, depends upon the tilt illusion, and is found even when the target is highly salient. Another kind, seen with non-tilted distractors, depends on a different mechanism, such as obligatory pooling (Parkes et al 2001) and is reduced by increasing the salience of the target.
Acknowledgment
This research was supported by The Cognitive Systems Foresight Project, grant BB/E000444/1.
References
- Andriessen JJ, Bouma H. Eccentric vision: adverse interactions between line segments. Vision Res. 1976;16:71–8. doi: 10.1016/0042-6989(76)90078-x. [DOI] [PubMed] [Google Scholar]
- Appelle S. Pattern and discrimination as a function of stimulus orientation: The ‘oblique effect’ in man and animals. Psychol Bull. 1972;78:266–278. doi: 10.1037/h0033117. [DOI] [PubMed] [Google Scholar]
- Bouma H. Interaction effects in parafoveal letter recognition. Nature. 1970;226:177–178. doi: 10.1038/226177a0. [DOI] [PubMed] [Google Scholar]
- Brainard DH. The Psychophysics Toolbox. Spatial Vision. 1997;10:433–436. [PubMed] [Google Scholar]
- Chung STL, Levi DM, Legge GE. Spatial-frequency and contrast proprieties of crowding. Vision Research. 2001;41:1833–50. doi: 10.1016/s0042-6989(01)00071-2. [DOI] [PubMed] [Google Scholar]
- Efron B. Bootstrap methods: another look at the jackknife. The Annals of Statistics. 1979;7:1–26. [Google Scholar]
- Efron B. The jackknife, the bootstrap and other resampling plans. Philadelphia: Society for industrial and Applied Mathematics; 1982. [Google Scholar]
- Felisberti FM, Solomon JA, Morgan MJ. The role of target salience in crowding. Perception. 2005;34:823–833. doi: 10.1068/p5206. [DOI] [PubMed] [Google Scholar]
- Gibson JJ. Adaptation, after-effect, and contrast in the perception of tilted lines II. Simultaneous contrast and the areal restriction of the after-effect. Journal of Experimental Psychology. 1937;20:553–569. [Google Scholar]
- Green BF, Anderson LK. Color coding in a visual search task. J. Exp. Psychol. 1956;51:19–24. doi: 10.1037/h0047484. [DOI] [PubMed] [Google Scholar]
- Kooi FL, Toet A, Tripathy SP, Levi DM. The effect of similarity and duration on spatial interaction in peripheral vision. Spatial Vision. 1994;9:255–279. doi: 10.1163/156856894x00350. [DOI] [PubMed] [Google Scholar]
- Korte W. Über die Gestaltauffassung im indirekten Sehen. Zeitschrift für Psychologie. 1923;93:17–82. [Google Scholar]
- Nakayama K, Silverman GH. Serial and parallel processing of visual feature conjunctions. Nature. 1986;320:264–265. doi: 10.1038/320264a0. [DOI] [PubMed] [Google Scholar]
- Nagy AL, Sanchez RR. Critical color differences determined with a visual search task. J. Opt. Soc. Am. - A. 1990;7(7):1209–1217. doi: 10.1364/josaa.7.001209. [DOI] [PubMed] [Google Scholar]
- Nagy AL, Sanchez RR, Hughes TC. Visual search for color differences with foveal and peripheral vision. J. Opt. Soc. Am. - A. 1990;7(10):1995–2001. doi: 10.1364/josaa.7.001995. [DOI] [PubMed] [Google Scholar]
- Nazir TA. Effect of lateral masking and spatial precueing on gap-resolution in central and peripheral vision. Vision Research. 1992;32:771–777. doi: 10.1016/0042-6989(92)90192-l. [DOI] [PubMed] [Google Scholar]
- Parkes L, Lund J, Angelluci A, Solomon J, Morgan M. Compulsory averaging of crowded orientation signals in human vision. Nature Neuroscience. 2001;4:739–744. doi: 10.1038/89532. [DOI] [PubMed] [Google Scholar]
- Pelli DG. The VideoToolbox software for visual psychophysics: transforming numbers into movies. Spatial Vision. 1997;10:437–442. [PubMed] [Google Scholar]
- Pelli DG, Palomares M, Majaj NJ. Crowding is unlike ordinary masking: distinguishing feature detection and integration. Journal of Vision. 2004;4:1136–69. doi: 10.1167/4.12.12. [DOI] [PubMed] [Google Scholar]
- Solomon JA, Felisberti FM, Morgan M. Crowding and tilt illusion: toward a unified account. Journal of Vision. 2004;4:500–8. doi: 10.1167/4.6.9. [DOI] [PubMed] [Google Scholar]
- Solomon JA, Morgan MJ. Stochastic re-calibration: contextual effects on perceived tilt. Proceedings of the Royal Society B: Biological Sciences. 273:2681–6. doi: 10.1098/rspb.2006.3634. [DOI] [PMC free article] [PubMed] [Google Scholar]
- Stuart JA, Burian HM. A study of separation difficulty: its relationship to visual acuity in normal and amblyopic eyes. American Journal of Ophthalmology. 1962;53:471. [PubMed] [Google Scholar]
- Treisman AM, Gelade G. A Feature-integration theory of attention. Cognitive Psychology. 1980;12:97–136. doi: 10.1016/0010-0285(80)90005-5. [DOI] [PubMed] [Google Scholar]
- Treisman AM, Sato S. Conjunction search revisited. Journal of Experimental Psychology, Human Perception and Performance. 1990;16:459–478. doi: 10.1037//0096-1523.16.3.459. [DOI] [PubMed] [Google Scholar]
- Tripathy PS, Cavanagh P. The extent of crowding in peripheral vision does not scale with target size. Vision Research. 2002;42:2357–2360. doi: 10.1016/s0042-6989(02)00197-9. [DOI] [PubMed] [Google Scholar]
- Watson AB, Solomon JA. Psychophysica: Mathematica notebooks for psychophysical experiments (cinematica--psychometrica--quest) Spat Vis. 1997;10:447–66. doi: 10.1163/156856897x00384. [DOI] [PubMed] [Google Scholar]
- Wolfe JM. Visual Search. In: Pashler H, editor. Attention. Hove England: Psychology Press; 1998. pp. 13–74. [Google Scholar]


