Abstract
Structure is only the first step in understanding the interactions and functions of proteins. In this paper, we explore the flexibility of proteins across a broad database of over 250 solvated protein molecular dynamics simulations in water for an aggregate simulation time of ∼6 μs. These simulations are from our Dynameomics project, and these proteins represent approximately 75% of all known protein structures. We employ principal component analysis of the atomic coordinates over time to determine the primary axis and magnitude of the flexibility of each atom in a simulation. This technique gives us both a database of flexibility for many protein fold families and a compact visual representation of a particular protein's native-state conformational space, neither of which are available using experimental methods alone. These tools allow us to better understand the nature of protein motion and to describe its relationship to other structural and dynamical characteristics. In addition to reporting general properties of protein flexibility and detailing many dynamic motifs, we characterize the relationship between protein native-state flexibility and early events in thermal unfolding and show that flexibility predicts how a protein will begin to unfold. We provide evidence that fold families have conserved flexibility patterns, and family members who deviate from the conserved patterns have very low sequence identity. Finally, we examine novel aspects of highly inflexible loops that are as important to structural integrity as conventional secondary structure. These loops, which are difficult if not impossible to locate without dynamic data, may constitute new structural motifs.
Keywords: protein, flexibility, folding, stability, families
Much scientific effort has been spent attempting to catalog, describe, observe, and understand protein structure and function. Even when the structure of a protein is known, this knowledge is often not sufficient to elucidate details of the protein's function or its mode of action, both of which are pieces of information that are frequently of much greater importance to biologists than structure. As biologists increasingly seek to understand and modify aspects of cellular behavior and as protein databases gather more high-resolution three-dimensional structures, the ability to understand key features of a protein's dynamic behavior becomes more important.
Flexibility is critical in determining protein behavior and function. Because proteins are not static entities (as they are represented in structural databases) and because crystal structures do not necessarily represent a protein in its active conformation, any attempt to determine potential biochemical interactions of a protein from these data suffers from a lack of information about its motion. A quantitative description of a protein's flexibility provides a summary of its dominant dynamical modes and significant information about potential conformations available to it. Flexibility may also provide insight into unfolding and folding pathways because a protein is most likely to start unfolding, and to finish folding, at a site that is highly mobile. Thus, flexibility may affect not only function but also unfolding and stability.
Molecular dynamics (MD) is a common method for determining protein motion over time. MD provides the researcher with snapshots of a protein's conformation at regular time intervals. These data, when saved at frequent enough intervals, behave as a stop-motion photography film and can be analyzed by mathematical and statistical techniques to further explore protein motion.
The Dynameomics project (Beck et al. 2008) is a large-scale effort to simulate a protein from every protein fold family (Day and Daggett 2003). The Dynameomics database (Kehl et al. 2008; Simms et al. 2008) currently contains ∼450 proteins, each of which has been simulated for at least 21 ns at a temperature of 298 K. Additionally, it contains at least two unfolding simulations of each protein at 498 K for 31 ns and at least three short (2 ns) simulations at 498 K. These simulated target proteins form a data set that spans a considerable portion of the protein universe, representing >75% of all known protein folds.
Here we focus on the analysis of general features of protein flexibility of the native-state proteins in the Dynameomics project, resulting in a database of protein flexibilities. For three of these highly populated folds, we compared 36 family members to determine if flexibility is conserved across a fold family. Then we compare native-state flexibility with unfolding behavior to explore the relationship between flexibility and the mechanism of early unfolding. Finally, we searched our database of flexibilities for unstructured regions whose flexibility was uncharacteristically low, and we use these findings to demonstrate how flexibility may be useful for determining intrinsic properties of structure that are difficult to elucidate with other techniques.
Results
Here, we focus on the use of principal components of atomic trajectories to analyze the main chain Cα flexibility of proteins in MD simulations using a technique formally described by Teodoro et al. (2003). This technique provides the magnitude and primary axis of an atom's movements. We performed the analysis on all targets in our Dynameomics project for which we had completed at least 21 ns of simulation at 298 K and for which all of our standard analyses had been run, a total of 253 proteins when this project began.
General properties of flexibility
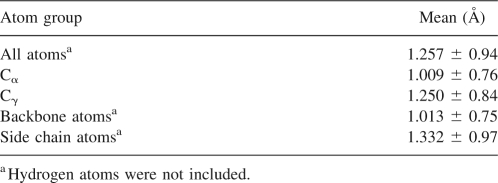
The data collected in the analysis of the 253 solvated protein MD simulations yielded several broad statistics concerning flexibility (Table 1). The distribution of flexibilities of all simulations can be seen in Figure 1A. Approximately 85% of the first principal components covered more than half of the variance of a given atom's trajectory. The distribution of the portion of variance covered by the first principal component is shown in Figure 1B. If atoms with very low flexibilities (<0.5 Å) are excluded, 91% of the first principal components cover more than half of the variance. If only those atoms with higher than average flexibility are examined, this percentage climbs to 98%, and among the upper outliers (flexibility > 1.7 Å) the flexibility covers a mean of 76 ± 10% of the variance. The distribution of the flexibility of all atoms can be seen in Figure 1C. Less than a third of the variance in all atoms is covered by the final two principal components together. The ellipsoid formed by the standard deviations along each principal component for an atom represents that atom's probable occupancy. The mean anisotropy of these ellipsoids, defined as the ratio of the shortest to the longest semi-axes of the ellipsoid, for Cα atoms in our simulation was 0.48, excluding upper outliers. This indicates that the atoms in our data set have distributions about their mean positions that are marginally less spherical than the experimentally derived data set from 68 proteins examined by Kondrashov et al. (2007), whose mean anisotropy was 0.51.
Table 1.
Flexibilities for various atom groups over all simulations analyzed
Figure 1.
General properties of protein flexibility. (A) Histogram of proteins by average flexibility (square root of the variance represented by the first principal component of an atom's trajectory). (B) Histogram of the portion of the variance covered by the first principal component of each atom's trajectory. High coverage means that most of the movement of that atom is encapsulated by its flexibility. (C) A histogram of the flexibilities of all atoms analyzed.
The average correlation of a protein's flexibility to the mean Cα root-mean-square fluctuation (RMSF) about the average was 0.74. The correlation between the average Cα root-mean-square deviation (RMSD) and the average flexibility was 0.75. The average correlation between Cα, Cγ, and Cζ flexibility and mean solvent-accessible surface area (SASA) by residue was 0.25, 0.33, and 0.47, respectively. The Spearman correlation between flexibility and hydrophobicity (Black and Mould 1991) by amino acid type was 0.58; if Pro is excluded, this correlation rises to 0.65.
Properties of secondary structure flexibility
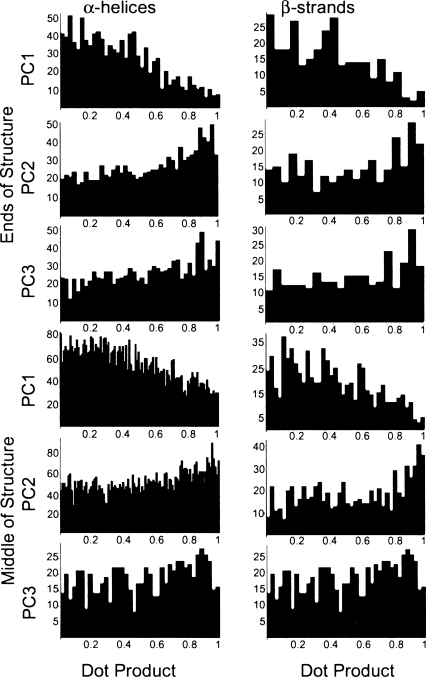
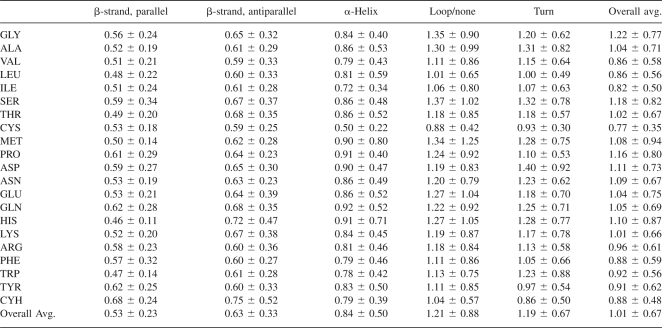
In general, both β-strands and α-helices have flexibility vectors that are more parallel to their principal axes (i.e., stretching/compressing the structure) at their termini than in the middle. Histograms of the absolute values of the dot products of the flexibility vectors with the principal components of the secondary structure units, representing the degree of alignment of the vectors to the principal axes (1 indicating parallel vectors and 0 indicating perpendicular vectors), are shown in Figure 2. In the case of α-helices with at least two turns, the principal axis (the first principal component of the Cα atoms) of the helix is approximately parallel to the axis of the helix while the secondary and tertiary axes point outward toward the loops. In the case of β-strands, the principal axis of the strand lies along the backbone of the strand. A summary of the flexibilities of Cα atoms by residue and secondary structure can be found in Table 2.
Figure 2.
Histograms of the absolute values of the dot products of the principal axes of secondary structure elements with the end or middle residues of each. A dot product of 1 indicates parallel vectors while a dot product of 0 indicates perpendicular vectors. The y-axis of each graph is the number of proteins, while the x-axis is the dot product.
Table 2.
Flexibility of Cα atoms by secondary structure and residue
Fold family flexibility
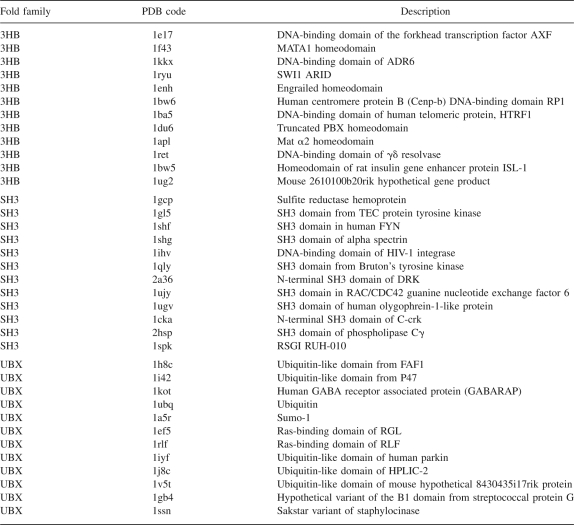
We examined 12 proteins from each of three fold families: one all α-helical—the three-helix bundle fold (3HB), one all β-sheet—the SH3 fold family, and one with both an α-helix and β-sheet—the ubiquitin fold family (UBX) (Table 3).
Table 3.
Proteins that were analyzed and compared by fold family
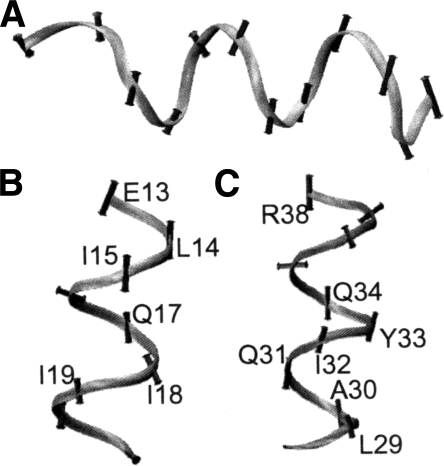
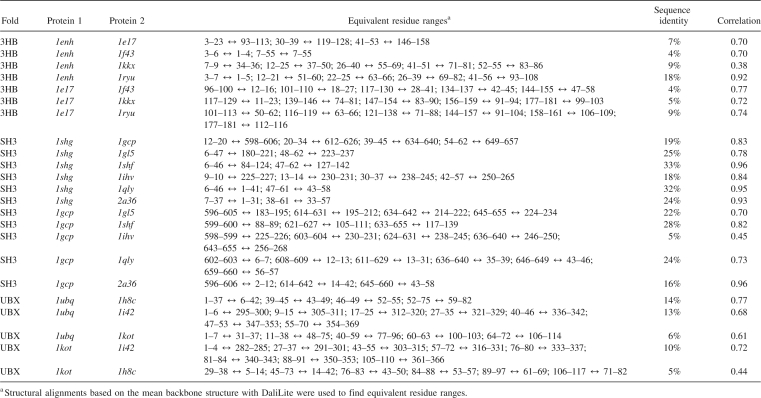
The three-helix bundle fold (3HB) contains members that are among the fastest folding and unfolding proteins. Each protein contains relatively rigid α-helices and flexible loop regions. The mean Cα flexibility for the α-helices and loops is 0.76 ± 0.31 Å and 1.43 ± 0.83 Å, respectively. Residues of the α-helices flex perpendicular to the axis of the helix (Fig. 3A) in all cases except two helices of 1e17. The residues flexing highly parallel in 1e17 are E13, L14, I15, Q17, A18, and I19 in the first helix (Fig. 3B) and L29, A30, Q31, I32, Y33, E34, and R38 in the second (Fig. 3C). Other helices in the 3HB family tend to contain Glu, Lys, Val, and Phe residues but fewer Leu and Ile residues. Table 4 shows the comparison of a collection of 3HB proteins with an average correlation of the magnitude of the flexibility of 0.76 with values ranging from 0.70 to 0.92. The final member is a significant outlier (1kkx vs. 1enh) with R = 0.38.
Figure 3.
Protein backbones with flexibility vectors shown as vectors with lengths equal to the Cα flexibility in angstroms. (A) An α-helix of 1f43 with flexibility vectors perpendicular to the principal axis of the helix. (B) First α-helix of 1e17 with flexibilities parallel to the principal axis of the helix. (C) Second α-helix of 1e17 with flexibilities parallel to the principal axis of the helix. Backbones are colored black to white by flexibility with darker regions being the least flexible.
Table 4.
Flexibility correlation between various fold family members
The SH3 fold family consists of highly inflexible β-strands in barrel-like orientations. The mean flexibility of these β-strands is 0.47 ± 0.21 Å and of the loop regions is 1.29 Å ± 0.68 Å. No obvious global patterns exist in the directions of the flexibilities. Table 4 shows a collection of the SH3 family members compared to each other with an average correlation of flexibility magnitudes of 0.81 with values ranging from 0.73 to 0.96. There is a significant outlier with R = 0.45 (1gcp vs. 1ihv).
The UBX fold contains both β-sheets and an α-helix; all of the UBX members studied have the helix docked against the β-sheet except for 1kot, which additionally contains several external helices. The mean flexibility of the β-strands is 0.53 ± 0.27 Å, and 0.53 ± 0.24 Å for α-helices. In each of the UBX proteins, the residues of the helix and strands exposed to each other flex more readily along the axis between them. Table 4 shows a collection of UBX family members compared to each other with an average correlation of flexibility magnitudes of 0.72 with values ranging from 0.61 to 0.77. A significant outlier with R = 0.44 (1kot vs. 1h8c) is also included.
Overall, the correlation in flexibility between family members is highest when the sequence identity is high. The correlation between sequence identity and per-residue flexibility correlation is 0.76. The 3HB family members studied here have the lowest average sequence identity (Table 4). In addition to the comparisons provided, correlations were calculated between every possible pair of simulated proteins in a given family. The correlations tended to be high, with a small number of outlying low values. Of the 198 intrafamily protein pairs, only 11 had correlations below 0.1; excluding these, the average correlation between the flexibility magnitudes of two proteins in the same family was 0.62. Of the 11 pairs with low correlation, all belonged to either the 3HB or UBQ family, and their average sequence identity was 9% ± 6%.
Native-state flexibility and early unfolding events
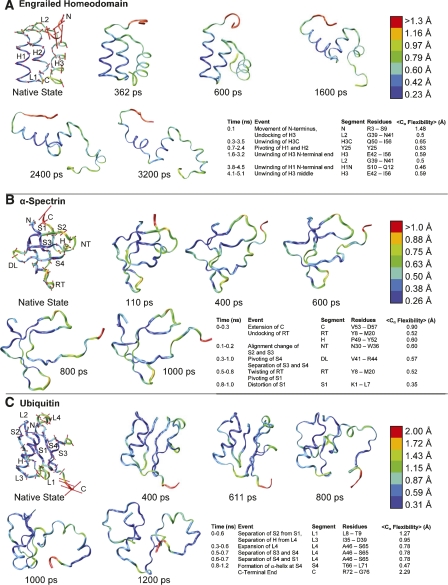
The native-state flexibility of the engrailed homeodomain (1enh), of the 3HB family, was compared to early events in its thermal unfolding pathway (Fig. 4A). The protein can be broken down into segments in order of decreasing flexibility: its N terminus (1.48 Å); (H3C) the C-terminal end of H3; (L1) the flexible residue Y25 between H1 and H2; H3; (L2) the joint between H2 and H3; H2; and H1 (0.31 Å). The first significant unfolding event (within the first 0.1 ns) is the undocking of H3 in conjunction with the lifting of the flexible N-terminal tail (regions N and L2). This is followed by unwinding of the flexible C terminus (H3C). These events begin very early, around 0.3 ns, with a stretching of the helix toward the C terminus, and they are complete by 3.5 ns, before the other two helices have begun to unwind significantly. Another early unfolding event is the movement of H1 from a position parallel to H2 to a skew position at approximately a right angle. The helices pivot around Y25 between 0.7 ns and 2.4 ns. The N-terminal end of H3 begins to unwind around 1.6 ns (H3 and L2) and is complete by 3.2 ns; the N-terminal end of H1 does not begin to unwind until 3.8 ns.
Figure 4.
Flexibility representation, unfolding snapshots, and significant unfolding events of three proteins. All proteins are colored blue–green–red by flexibility magnitudes. Flexibility vectors are shown in red. Vectors are displayed at twice their length for clarity. (A) Engrailed homeodomain (1enh); the transition state is at 362 ps. (B) α-Spectrin (1shg); the transition state is at 110 ps. (C) Ubiquitin (1ubq); the transition state is at 611 ps.
The native-state flexibility of the SH3 domain of alpha spectrin (1shg) was similarly compared to early events in its thermal unfolding (Fig. 4B). This protein is very inflexible overall (0.5 Å) and, in order of decreasing main-chain flexibility, consists of the C terminus (0.9 Å); (H) a single α-helical turn near the C terminus; (NT) the NT Src Loop; (DL) the Distal Loop; (RT) the RT Loop; and (S) four β-strands. The flexibility vectors of the end of the C terminus and of the helical turn have very strong components in the direction away from and toward the protein. The first event in the unfolding pathway of 1shg (in the first 0.3 ns) is an extension of the C terminus (region C) away from the protein in the direction that the flexibility vectors point, accompanied by the undocking of RT (H and RT). From 0.1 to 0.2 ns, S2 and S3 (separated by NT) shift alignment. Around 0.3 ns, S4 pivots on DL and separates from S3. This is accompanied, around 0.5 ns, by the twisting of RT and the pivoting of S1 around RT. It is not until 0.8 ns that any of the β-strands bend significantly (S).
The protein ubiquitin (1ubq) is an inflexible protein (0.5 Å) consisting of four β-strands (S) and an α-helix (between S2 and S3) connected by four loops. Its most flexible regions are the four C-terminal residues (2.29 Å), (L1) Loop1, (L3) Loop3, and (L4) Loop4. The flexibility vectors of the C terminus point away from the body of the protein (Fig. 4C). By 0.6 ns of the simulation, the entire protein expands via the separation of S2 from S1 and the undocking of the helix from L4 via movement of L1 and L3. Although the C terminus is highly flexible and moves considerably, it does not play a significant role in unfolding. Around 0.3 ns, L4 extends, eventually leading to the separation of S4 from S3 and S1 (between 0.5 and 0.7 ns).
Inflexible loops
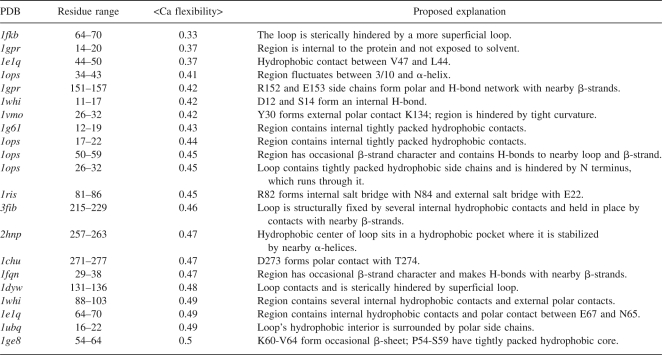
There are 21 loops or unstructured regions consisting of ≥6 residues in the ensemble of targets with an average Cα flexibility of ≤0.5 Å and an additional 353 moderately flexible unstructured regions with an average of <1.0 Å. Seven of the highly inflexible loops are buried or partially buried in a protein, but 14 of them are exposed to solvent. Table 5 details these 21 regions; we highlight three of these regions below.
Table 5.
Inflexible loop regions of proteins
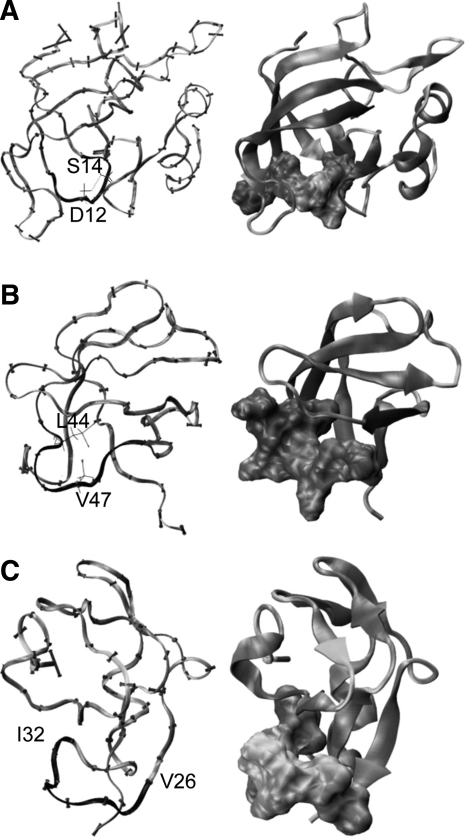
The ribosomal protein L14 (1whi) has a highly inflexible loop (mean flexibility is 0.47 Å) with sequence A11, D12, N13, S14, G15, A16, and R17 (Fig. 5A). A domain from bovine mitochondrial F1-ATPase (1e1q, residues 24–93), of the α/β-subunits F1 ATPase/thrombin family, has a highly inflexible region (0.37 Å) exposed to solvent with sequence L44, R45, N46, V47, Q48, A49, and E50 (Fig. 5B). A loop near the ice-binding surface of type III antifreeze protein from ocean pout (1ops, residues 2–65), of the β-clips II family, has a highly inflexible region with a mean flexibility of 0.45 Å and with sequence V26, T27, N28, P29, I30, G31, and I32 (Fig. 5C).
Figure 5.
Three proteins with inflexible regions with each inflexible region colored in black. In each row, the right column contains the protein with the surface of the inflexible region shown colored black to white by Cα flexibility with darker regions being the least flexible. (A) The ribosomal protein L14. The inflexible loop begins with residue 11 on the left and loops around to residue 17 on the right. Side chains for S12 and D14 are shown and colored by atom. Hydrogen bonds are shown by dotted lines. (B) Bovine mitochondrial F1-ATPase. Side chains for residues L44 and V47 are displayed. (C) Ocean pout antifreeze III protein.
Discussion
General properties of flexibility
Large-scale MD flexibility analysis has never been applied to data mining on the scale of hundreds of proteins. By employing the basic technique of Teodoro et al. (2003) with our database of MD simulations, we have collected considerable information regarding the general flexibility of proteins, as well as uncovered both anomalies and patterns concerning protein dynamics.
The distribution of the variance captured by the first principal components of the Cα trajectories and the correlation with the more conventional Cα RMSF supports the validity of using the first principal component of the trajectory as a measurement of an atom's flexibility. The most flexible Cα atoms have first principal components that cover the greatest portion of their total variance, and very inflexible Cα atoms have principal components that cover less of their variance. This observation suggests that the atoms for which flexibility analysis is most like RMSF are those that are least flexible. This observation additionally suggests that highly rigid atoms, such as those found in β-strands, undergo small fluctuations with less directed distributions about a mean position, while very flexible atoms, such as those in loops, oscillate along predictable trajectories. The primary difference between flexibility and RMSF is encapsulated in these observations; while RMSF measures all fluctuations from a mean structure, flexibility analysis isolates the key features of the motion of an atom. In addition to giving a direction to the atom's motion, flexibility filters out an atom's less significant and noisy motions and gives a measure of the fluctuation of an atom along its most significant mode. The distribution of flexibility shows that very few atoms are highly rigid compared to the number that are slightly flexible (≥1 Å) and that a small number of atoms are very flexible (≥5 Å), which occurs primarily in tails and loops.
The correlation between average Cα RMSD and flexibility shows that highly flexible proteins are very poorly captured by a small number of static structures and supports the notion that flexibility should be taken into account in docking and other structure analyses. The correlation between average Cα RMSF and flexibility is expected because of the underlying similarity in what they measure. This correlation supports the fact that they are related without suggesting that they are the same. One might expect a high correlation to SASA, because surface residues would seem to be more mobile than buried residues. However, the correlations between SASA and flexibility are low because SASA is a very noisy measurement, although there is a higher correlation for side chain atoms.
The agreement of the anisotropy of atomic flexibilities to the anisotropy derived from crystallographic anisotropic displacement parameters, as examined by Kondrashov et al. (2007), strongly supports the validity of this flexibility metric. The slight decrease in the anisotropy of our simulations (0.48 vs. 0.51) may be due either to differences in the sampling of the data sets (68 vs. 253 proteins) or to the dynamical differences between atoms in solution and in crystals.
Properties of secondary structure flexibility
The flexibility of individual amino acids by secondary structure tends to be highly variable due to the large data set and effects of averaging. A few exceptions to this emerge, however, notably the rigidity of His and Trp in β-strands or Ile in α-helices. These data suggest that the insertion of, for example, His into a β-strand or Ile into an α-helix would cause it to be more rigid. Additionally, it is apparent that the flexibilities of hydrophilic and polar residues are slightly higher on average than those of hydrophobic and nonpolar residues (Table 2), with a few exceptions. This trend can be easily explained by the tendency of nonpolar residues to cluster tightly with other nonpolar residues as opposed to polar and hydrophilic residues, which often interact with solvent. The correlation (Rs = 0.65, excluding Pro) between hydrophobicity and flexibility additionally supports this explanation. The appearance of cystine (Cys) as the least flexible amino acid is not surprising because we separated reduced cysteine (Cyh) and oxidized cystine.
The dot products of the Cα atoms with the principal axes of their secondary structure measure the angle that the motion of the atom makes with the secondary structure element. Both the principal axis of a secondary structure unit and the flexibility vector for any given Cα atom are unit vectors; thus the dot product will always range from 0 (perpendicular vectors) to 1 (parallel vectors). The distributions of these dot products are noisy due to the relative rigidity of secondary structure combined with the previous observation that rigid atoms have less ordered distributions about a mean than highly flexible atoms, which tend to flex more strongly along a single axis. Nonetheless, slight trends are apparent. In both α-helices and β-strands, there is a slight tendency for the flexibility vectors of a secondary structure unit's Cα atoms to be perpendicular to its primary axis and for its second principal component to be parallel to the flexibility vectors. In the case of α-helices, this trend indicates that the flexibility vectors point most strongly outward/inward, away from and toward the center of the helix. In the case of β-strands, this trend indicates that flexibility vectors point least strongly along the backbone of the strand and more strongly in the direction of the bends of the backbone (the direction of the second principal axis) than from side to side. The trend is more pronounced in α-helices than β-strands, which can be predicted by the higher flexibility of α-helices as well as the tendency of β-strands to curve and bend (thereby preventing the principal axis from being as consistent). Additionally, in the case of α-helices, the trend is slightly more pronounced at the ends of helices than for the middle residues, showing that the ends of helices flex more readily outward from the central axis.
Trends in fold family flexibility
The examination of the flexibilities of fold families begs the question of whether there are fundamental rules that tie sequence and local structure to flexibility. The average flexibilities of secondary structure within a fold family differ from the overall averages, suggesting that some trends between the flexibilities of members of various fold families exist. The secondary structure of the 3HB and SH3 fold families consist only of α-helices and only of β-sheets, respectively. In both 3HB and SH3, the flexibilities of their secondary structures are lower than expected from the overall averages. The lack of trends in the flexibility vectors in the SH3 fold family, which is rich in β-strands, agrees with the previous observation that β-strands are highly inflexible and therefore tend to have less directed fluctuations. These data, along with the observations concerning the trends in the directions of the flexibility vectors in the 3HB and UBX families and the high correlations between fold family members, suggest that there are motifs in the specific flexibilities of fold families, though these trends may be subtle. Additionally, the correlation between a protein's sequence identity and the closeness of its flexibility to other family members suggests that sequence modulates the flexibility. For example, 1e17, whose helical flexibility vectors varied from the other members of the 3HB family, has helical sequences that are quite different from the other family members; features such as the lack of Lys and presence of Ile, a highly inflexible residue in α-helices, explain some of these differences.
Additionally, the high correlations of the magnitude of the flexibility between equivalent structural regions of family members suggest that families have characteristic flexibility patterns. Notably, comparison of arbitrary α-helices to each other and arbitrary β-strands to each other produces very low correlations (mean correlation <0.2), so the relationship observed here is not dependent only on the makeup of secondary structure in each family. Not every member of a fold family adheres strictly to these flexibility patterns, however, as shown by the small number of pairs of proteins with low flexibility correlations. This is not surprising considering the structure and sequence diversity of the fold families examined and demonstrates that the local chemical environment of a residue, and not just its local backbone configuration and chain topology, determine its flexibility. Nonetheless, the high correlation between most pairs of fold family members indicates that the similarity between two proteins' flexibilities correlates with the similarity of their structures and sequences. Future work will extend this observation to examine in detail how the local chemical environment of a residue influences its flexibility.
Native-state flexibility and early unfolding events
The comparison to unfolding simulations shows a relationship between the flexibility of a residue at 298 K and the early steps in the thermal unfolding pathway in the proteins examined here. There is a nearly step-by-step correlation between high flexibility and the order of unfolding. These data suggest that native-state dynamics are closely related to unfolding and folding dynamics, in agreement with our findings in the first simulations of protein unfolding (Daggett and Levitt 1992). Later, Hespenheide et al. (2002) explored the relationship between flexibility and unfolding pathways in simulations of 10 monomeric proteins and compared the results to hydrogen–deuterium exchange experiments (Li and Woodward 1999). They found that the folding cores of proteins with the greatest structural stability against denaturation could be determined by flexibility. Here we extend this work to the level of hundreds of proteins, further tying flexibility to instability by showing that flexible Cα sites are the most likely candidates for early unfolding.
Inflexible loops
The sheer number of inflexible loops (21 with flexibility ≤0.5 Å and 353 with flexibility <1.0 Å) is surprising and suggests that there may be a number of structured loops that are not recognized as secondary structure, although they are as rigid as conventional secondary structure. Because the inflexible secondary structure units that form a protein's backbone and core generally determine its structure, it is useful to consider the possibility of additional rigid structural units that may be important in the determination of structure. This hypothesis was examined before by Leszczynski and Rose (1986) in their study of Ω-loops. While many of the loops examined here have occasional Ω character, partially due to the broad definition of Ω-loops, many of them do not share the motif of being tightly packed internally. The three cases examined here are each interesting for different reasons. The second loop in 1whi (ribosomal protein L14 family) contains a pair of hydrogen bonds between the side chains of Asp 12 and Ser 14. Notably, this loop is highly conserved among species and is responsible for mediating interactions between the neighboring loops in the β-barrel of this protein (Davies et al. 1996). The loop in 1e1q (α/β subunits of F1 ATPase family) sits at the interface between α and β subunits of ATPase (Abrahams et al. 1994) and contains a pair of hydrophobic residues (Leu 44 and Val 47) in close proximity, forming a small hydrophobic cluster. Such interactions indicate that sequence is an important predictor of flexibility. The loop in 1ops (antifreeze protein III-like family) does not contain hydrogen bonds or sites for potential hydrophobic interactions, though it is highly hydrophobic. The C-terminal end of the protein runs through it, however, which may lock it down. This loop provides rigid support for the ice-binding surface of this antifreeze protein (Yang et al. 1998).
Each of the 21 least flexible regions fit into one of five categories: (1) those that are sterically hindered, (2) those with internal hydrophobic contacts, (3) those with internal polar contacts, (4) those with partial secondary structure character, and (5) those with external contacts. Internal hydrophobic contacts between side chains appear to play a stabilizing role in many of these, and such contacts represent the most commonly appearing motif. These loops specifically coincide with the Ω-loop motif. The regions with hydrophobic internal contacts often had backbones with characteristic and very high curvature such that close contacts could be made between side chains at the center. The distribution of amino acids in all of the inflexible loop regions, as well as in only the 21 least flexible regions, contained no significant deviations from the distribution of amino acids in all proteins; however, the distribution of amino acids in those regions with internal hydrophobic contacts was heavily skewed toward Leu and Pro and moderately skewed toward Val and Ile. Gly and Thr are the only other amino acids with a high frequency in this set. Pro appears near the point of highest curvature in several of these regions and may be important for forming this motif by introducing a kink in the segment. Future analysis will explore the extent to which these observations are examples of structural motifs that imply a predictable quality to flexibility based on sequence and structure and whether these potential motifs can further be tied to structural stability.
Conclusions
Protein flexibility is a useful means of extracting information from individual protein trajectories as well as related sets of trajectories. Protein flexibility bears a strong relationship to unfolding and can be used to predict early steps in unfolding. The ability of flexibility to elucidate regions of interesting structure has been demonstrated by the identification of inflexible loops that constitute new structural motifs. Finally, the correlation of flexibility with structure and the inherent flexibility differences between fold families are potentially very useful for understanding how different arrangements of structure can lead to different dynamics and function.
Materials and Methods
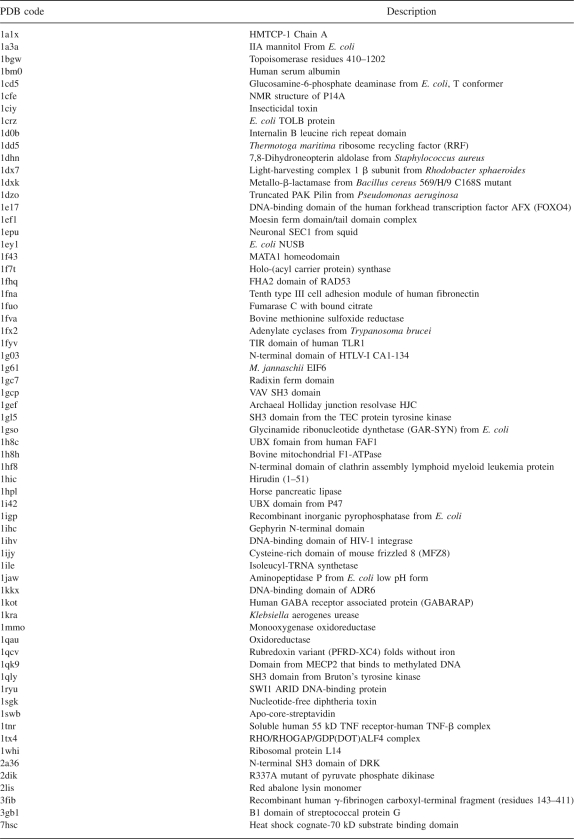
Simulations were performed with explicit water using our in-house developed simulation package in lucem molecular mechanics (Beck et al. 2000–2008; Beck and Daggett 2004) and our previously described protein and water force fields (Levitt et al. 1995, 1997). Simulation details can be found elsewhere (Beck et al. 2008). For each simulation, atomic coordinates from all but the first nanosecond of our trajectories were downloaded from our in-house developed data warehouse (Simms et al. 2008) into Mathematica Version 5.2 (Wolfram Research, Inc.) for analysis. The first nanosecond was omitted to allow for equilibration. For each picosecond of the simulation, the protein structure was aligned to the initial structure using a rigid least squares fitting of Cα atoms with the structure's center of mass held at the origin (Kearsley 1989). The coordinates of each nonhydrogen atom were centered by subtracting the atom's mean position. Principal component analysis (PCA) was performed on these centered coordinates via singular value decomposition of their correlation matrix. This procedure yields, for each atom, three principal component vectors, u1, u2, and u3, each of which encapsulates a variance s1, s2, and s3, respectively, the sum of which is the total variance of the atom's trajectory. These values were placed back into our database for further analysis. The first principal component, u1, which encapsulates the largest portion of the variance in the trajectory, was taken as the primary axis of flexibility while the standard deviation of the trajectory along that axis,  , was taken as the primary measure of the flexibility in angstroms (Å). The flexibility vector for a given atom was thus taken to be bu1, the vector in the direction of the first principal component whose length is the standard deviation of the movement along that axis. The total number of proteins/simulations analyzed was 253 (5.56 μs total) and the total number of atoms analyzed was 505,702 in 32,306 residues. These 253 targets include the 188 targets described in Table S1 of Beck et al. (2008), as well as the 65 targets listed in Table 6 here.
Table 6.
Sixty-five protein targets analyzed in addition to the 188 targets in Table S1 of Beck et al. (2008)
Once this flexibility information was collected and placed in the data warehouse, various statistical analyses and visual inspections of the trajectories were performed. Flexibility was visualized in two ways. The first involved plotting the flexibility vector (bu1) for each atom onto the mean structure of the simulation; the vectors were also plotted in reverse because the principle component represents a trend along an axis with the atom at the origin. The second method involved coloring the reference structure based on its calculated flexibility (b) along the sequence.
Analysis of secondary structure
Each secondary structure element was separated and categorized for analysis. Atoms were considered part of a secondary structure element if they existed in that element for at least 75% of the simulation according to the DSSP algorithm (Kabsch and Sander 1983). Turns were determined according to the criteria outlined by Kuntz (1972) and labeled as such if the residue was not previously part of another secondary structure element and was in a turn conformation for at least 75% of the simulation. In the case of α-helices and β-sheets, the directions of the flexibility vectors were compared to the principal components of the Cα atoms of their respective secondary structure units (i.e., the consecutive Cα atoms belonging to a β-strand or α-helix).
Comparisons of fold family flexibility
Three fold families were examined to compare the flexibilities of family members: engrailed homeodomain three-helix bundles (3HB), Src homology 3 (SH3) domains, and ubiquitin-like folds (UBX). Twelve proteins from each family were analyzed, details of which can be found in Table 3. Correlations of flexibility were calculated for each pair of proteins in a single family using equivalent residue ranges based on the DaliLite server's alignment of the mean structures (Holm and Park 2000).
Comparison of native-state flexibility to early unfolding events
Unfolding trajectories were simulated at 498 K for at least 31 ns (Day and Daggett 2005). Three proteins were chosen (1enh, 1shg, and 1ubq), one from each fold family, each of whose native-state flexibility vectors were compared to their unfolding pathways.
Acknowledgments
This work was partially supported by NIH grant GM 50789 (to V.D.) and by NIH Training Grant 3 T15 LM007442-04S1 from the National Library of Medicine (to N.C.B.). We are especially grateful for support from Microsoft through the Technical Computing @ Microsoft Program, www.microsoft.com/science (to V.D.). Additional thanks go to Richard Schaeffer for assistance with the fold family simulations.
Footnotes
Reprint requests to: Valerie Daggett, Department of Bioengineering, Box 355013, University of Washington, Seattle, WA 98195-5013, USA; e-mail: daggett@u.washington.edu; fax: (206) 685-3300.
Article and publication are at http://www.proteinscience.org/cgi/doi/10.1110/ps.037473.108.
References
- Abrahams J.P., Leslie A.G., Lutter R., Walker J.E. Structure at 2.8 Å resolution of F1-ATPase from bovine heart mitochondria. Nature. 1994;370:621–628. doi: 10.1038/370621a0. [DOI] [PubMed] [Google Scholar]
- Beck D.A.C., Daggett V. Methods for molecular dynamics simulations of protein folding/unfolding in solution. Methods. 2004;34:112–120. doi: 10.1016/j.ymeth.2004.03.008. [DOI] [PubMed] [Google Scholar]
- Beck D.A.C., Alonso D.O.V., Daggett V. University of Washington; Seattle, WA: 2000–2008. ilmm, in lucem molecular mechanics . [Google Scholar]
- Beck D.A.C., Jonsson A.L., Schaeffer R.D., Scott K.A., Day R., Toofanny R.D., Alonso D.O., Daggett V. Dynameomics: Mass annotation of protein dynamics and unfolding in water by high-throughput atomistic molecular dynamics simulations. Protein Eng. Des. Sel. 2008;21:353–368. doi: 10.1093/protein/gzn011. [DOI] [PubMed] [Google Scholar]
- Black S.D., Mould D.R. Development of hydrophobicity parameters to analyze proteins which bear post- or cotranslational modifications. Anal. Biochem. 1991;193:72–82. doi: 10.1016/0003-2697(91)90045-u. [DOI] [PubMed] [Google Scholar]
- Daggett V., Levitt M. A model of the molten globule state from molecular dynamics simulations. Proc. Natl. Acad. Sci. 1992;89:5142–5146. doi: 10.1073/pnas.89.11.5142. [DOI] [PMC free article] [PubMed] [Google Scholar]
- Davies C., White S.W., Ramakrishnan V. The crystal structure of ribosomal protein L14 reveals an important organizational component of the translational apparatus. Structure. 1996;4:55–66. doi: 10.1016/s0969-2126(96)00009-3. [DOI] [PubMed] [Google Scholar]
- Day R., Daggett V. All-atom simulations of protein folding and unfolding. Adv. Protein Chem. 2003;66:373–403. doi: 10.1016/s0065-3233(03)66009-2. [DOI] [PubMed] [Google Scholar]
- Day R., Daggett V. Ensemble versus single-molecule protein unfolding. Proc. Natl. Acad. Sci. 2005;102:13445–13450. doi: 10.1073/pnas.0501773102. [DOI] [PMC free article] [PubMed] [Google Scholar]
- Hespenheide B.M., Rader A.J., Thorpe M.F., Kuhn L.A. Identifying protein folding cores from the evolution of flexible regions during unfolding. J. Mol. Graph. Model. 2002;21:195–207. doi: 10.1016/s1093-3263(02)00146-8. [DOI] [PubMed] [Google Scholar]
- Holm L., Park J. DaliLite workbench for protein structure comparison. Bioinformatics. 2000;16:566–567. doi: 10.1093/bioinformatics/16.6.566. [DOI] [PubMed] [Google Scholar]
- Kabsch W., Sander C. Dictionary of protein secondary structure: Pattern recognition of hydrogen-bonded and geometrical features. Biopolymers. 1983;22:2577–2637. doi: 10.1002/bip.360221211. [DOI] [PubMed] [Google Scholar]
- Kearsley S.K. On the orthogonal transformation used for structural comparisons. Acta Crystallogr. A. 1989;45:208–210. [Google Scholar]
- Kehl C., Simms A.M., Toofanny R.D., Daggett V., Fersht A. Dynameomics: A multi-dimensional analysis-optimized database for dynamic protein data. Protein Eng. Des. Sel. 2008;21:379–386. doi: 10.1093/protein/gzn015. [DOI] [PubMed] [Google Scholar]
- Kondrashov D.A., Van Wynsberghe A.W., Bannen R.M., Cui Q., Phillips G.N., Jr Protein structural variation in computational models and crystallographic data. Structure. 2007;15:169–177. doi: 10.1016/j.str.2006.12.006. [DOI] [PMC free article] [PubMed] [Google Scholar]
- Kuntz I.D. Protein folding. J. Am. Chem. Soc. 1972;94:4009–4012. doi: 10.1021/ja00766a060. [DOI] [PubMed] [Google Scholar]
- Leszczynski J.F., Rose G.D. Loops in globular proteins: A novel category of secondary structure. Science. 1986;234:849–855. doi: 10.1126/science.3775366. [DOI] [PubMed] [Google Scholar]
- Levitt M., Hirshberg M., Sharon R., Daggett V. Potential-energy function and parameters for simulations of the molecular-dynamics of proteins and nucleic acids in solution. Comput. Phys. Commun. 1995;91:215–231. [Google Scholar]
- Levitt M., Hirshberg M., Sharon R., Laidig K.E., Daggett V. Calibration and testing of a water model for simulation of the molecular dynamics of proteins and nucleic acids in solution. J. Phys. Chem. B. 1997;101:5051–5061. [Google Scholar]
- Li R., Woodward C. The hydrogen exchange core and protein folding. Protein Sci. 1999;8:1571–1590. doi: 10.1110/ps.8.8.1571. [DOI] [PMC free article] [PubMed] [Google Scholar]
- Simms A.M., Toofanny R.D., Kehl C., Benson N.C., Daggett V. Dynameomics: Design of a computational lab workflow and scientific data repository for protein simulations. Protein Eng. Des. Sel. 2008;21:369–377. doi: 10.1093/protein/gzn012. [DOI] [PubMed] [Google Scholar]
- Teodoro M.L., Phillips G.N., Jr, Kavraki L.E. Understanding protein flexibility through dimensionality reduction. J. Comput. Biol. 2003;10:617–634. doi: 10.1089/10665270360688228. [DOI] [PubMed] [Google Scholar]
- Yang D.S., Hon W.C., Bubanko S., Xue Y., Seetharaman J., Hew C.L., Sicheri F. Identification of the ice-binding surface on a type III antifreeze protein with a “flatness function” algorithm. Biophys. J. 1998;74:2142–2151. doi: 10.1016/S0006-3495(98)77923-8. [DOI] [PMC free article] [PubMed] [Google Scholar]


