

Abstract
There is indirect evidence that the amino acid composition of proteins depends on their dimension. The amino acid composition of a nonredundant set of about 550,000 proteins was determined and it was observed that, in the range of 50–200 residues, the percentage of occurrence of most of the residue types significantly depends on protein dimension. This result should prove useful in analyzing protein sequences and genomics.
Keywords: amino acids, amino acid composition, protein dimension, protein sequence, UniProt database
Recently, we designed a computational technique for predicting, on the basis of the amino acid composition, if a protein is monomeric or if it forms permanent homo- or hetero-oligomers, together with other polypeptide chains (Carugo 2007). We observed that better predictions were possible by considering the protein dimension, measured by the number of residues (Carugo 2007). In practice, a query of 50 residues was processed by using learning sets of proteins containing less than 100 residues and a query of 150 residues was handled with learning sets of protein containing 100–200 residues, and so forth.
The dependence of the prediction reliability on the protein dimension was not unexpected. At least for relatively small proteins, containing only one globular structural domain, the volume increases more than the solvent-accessible surface if the radius of the globule increases (Rose and Wetlaufer 1977). Enlarging the protein, by adding a residue, implies that the protein core increases more than the protein surface. Since the core is essentially apolar, while the surface is essentially polar, it must be expected that the amino acid composition is not independent of the number of residues.
Despite that, amino acid composition was often used to describe protein sequences and to design predictive algorithms, like, for example, the tendency of proteins to crystallize (Chen et al. 2007), for the protein structural class (Chen et al. 2006), for membrane proteins (Shen and Chou 2005), or for protein contact numbers (Yuan 2005).
However, despite early observations (Fisher 1964; Cornish-Bowden 1983), the dependence of the amino acid composition on the number of residues of proteins was not examined in detail. This is done here, where unexpected trends are described.
Results and Discussion
The percentage of occurrence pcaa,i of the amino acid aa in the ith protein was computed for each of the 20 types of amino acids in each protein as
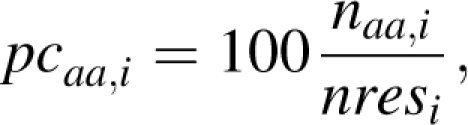 |
where naa,i and nresi are the number of residues of type aa observed in protein i and the total number of residues in protein i, respectively. Then, the pcaa,i values were averaged for all protein that contains the same number of residues R, by computing
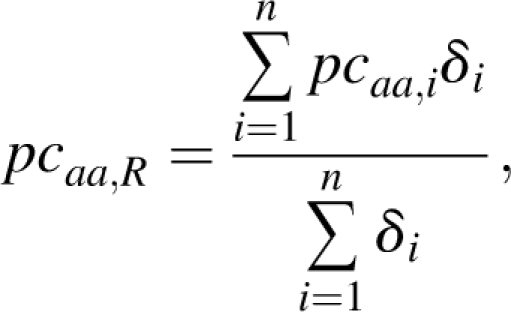 |
where δi = 1 if nresi = R, δi = 0 if nresi ≠ R, and R is the number of residues. The resulting quantity pcaa,R is thus the percentage with which residue aa (aa = A, C, D, …, V, W, Y) is observed in proteins containing R residues. All integer values of R from 50 to 200 were examined. On average, there are 3640 protein sequences for each value of R (standard deviation = 28; minimum = 2805 for R = 52; maximum = 4271 for R = 121). Larger values were disregarded since R = 200 is close to the natural domain size upper limit (Krishnan et al. 2007). It is the optimal value that allows one to discriminate single-domain proteins from multidomain proteins (as can be verified by considering the domain databases CATH [Orengo et al. 1997] and SCOP [Murzin et al. 1995]; data not shown). We did not want to consider multidomain proteins, the amino acid composition of which reflects the fact that they are constituted by a series of smaller structural domains interconnected by linkers, the amino acid composition of which are expected to be different (Coeytaux and Poupon 2005). R-values smaller than 50 were also disregarded, since extremely small proteins are rather infrequent. A total of 549,616 proteins were analyzed.
Figure 1A shows, for example, how the percentage of alanines (pcA,R) varies by increasing R from 50 to 200. Clearly, it is not constant. It increases from ∼7% to nearly 9%. The analogous results for cysteine are shown in Figure 1B. The values of pcC,R are larger for small proteins and tend to decrease, nearly linearly, from ∼2.3% to ∼1.5% in going from 50-residue to 200-residue proteins.
Figure 1.

Dependence of pcaa,R on R for alanines (A) and cysteines (B). Standard deviations of the mean values are shown by the vertical bars.
Clearly, the percentage of observation of alanines and cysteines depends on the dimension of the protein, and, also, the type of dependence is different for these two types of residues.
The dependence of pcaa,R on R for all the 20 types of residues is summarized in Figure 2. It clearly appears that different types of amino acids show different trends. Moreover, it is rather surprising that these trends are not very serrated, with large oscillations from one R-value to the next. On the contrary, they delineate quite well continuous curves.
Figure 2.

Dependence of pcaa,R on R for all the 20 types of amino acids. Standard deviations of the mean are not shown for clarity. Percentages are on the y-axis, and the number of residues are on the x-axis.
In order to get a quantitative estimation of the statistical significance of the data shown in Figure 2, we compared each pcaa,N value for 50 ≤ N ≤ 199 with the pcaa,R value for R = 200, through a t-test like
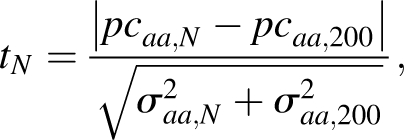 |
where 50 ≤ N ≤ 199 is the number of residues, σaa,N is the standard deviation of the mean value of pcaa,N, and σaa,200 is the standard deviation of the mean value of pcaa,200. For example, pcaa,200 for alanine is equal to 8.74 (standard deviation = 0.08) and pcaa,50 is equal to 7.06 (standard deviation = 0.10); therefore, t 50 is equal to 13.12, indicating that the values of pcaa,50 and of pcaa,200 are significantly different. The tN values of all the 20 types of amino acids are shown in Figure 3. It appears that in the large majority of the cases, they are very large and prove that the amino acid composition really depends on the protein dimension. Exceptions are tryptophan, glutamine, and threonine, where the t-values are very close to zero for the entire range of protein dimensions. For all the other residues, there is at least one region, along the x-axis, where the t-values are extremely large. For example, they are much larger than zero for protein shorter than 120 residues in the case of alanine, or they are much higher than zero in the case of tyrosine for protein containing 75–150 residues.
Figure 3.

T-values computed by comparing the percentage of observation of a residue in proteins of different dimensions with that observed in proteins containing 200 residues. T-values are on the y-axis, and the number of residues are on the x-axis.
Obviously, if the percentage of some residues decreases, the percentage of other residues must increase. However, different trends are observed for different residues. For some amino acids (A, D, E, G, P, and V) the percentage of occurrence tends to increase with the protein dimension until a plateau is reached, where the percentage does not increase any more. For other residues (C, F, H, I, K, M, N, and S), on the contrary, the percentage tends to decrease if the protein dimension increases. Two residues (L and Y) show higher percentages for small and large proteins, with a minimum for middle-sized proteins. One residue, R, on the contrary, is observed more frequently in middle-sized proteins.
Some of the trends shown in Figure 2 can be understood on the basis of simple considerations. For example, the fact that cysteines are more commonly observed in small protein might depend on the fact that these molecules are too small to form a hydrophobic core and often require disulfide bonds to stabilize their native fold (Carugo et al. 2001). Moreover, the fact that large aromatic amino acids (like phenylalanine) are frequently observed in small protein, more than small aliphatic residues (like alanine), might depend on the fact that the small hydrophobic core of small proteins is better stabilized by aromatic–aromatic interactions, like the parallel stacking, which are stronger than van der Waals interactions between aliphatic groups (Marsili et al. 2008).
Other trends of Figure 2 are, on the contrary, absolutely unexpected. For example, lysine and arginine—both positively charged residues—show different behaviors. While the first is more frequent in very small proteins, less frequent around R = 80, and more frequent if R increases, the frequency of arginine has a maximum around R = 80.
In order to verify that these results are not biased by some unexpected feature of the data present in the uniref50 fasta file, from which the protein sequences were taken, we randomly divided it into 10 subsets of 55,000 entries each and repeated all the computations 10 times, by using separately each subset. In this way, we expect to observe different dependencies of pcaa,R on R for different subsets of proteins if the uniref50 data set is biased. As an example, Figure 4 shows the dependence of pcaa,R on the number of residues for methionine. The 10 curves, each obtained by examining one of the 10 subsets, are clearly very similar and superposed to each other.
Figure 4.

Dependence of pcaa,R on R for methionine. Ten very similar curves are shown, each obtained by examining a subset of the data.
In order to monitor quantitatively the differences among different trends, we computed the Pearson correlation coefficients between all pairs of curves pcaa,R versus R, obtained on the 10 different subsets of data. This implies that for each of the 20 types of amino acids, 45 values of the correlation coefficient were computed. They are actually very similar, ranging, on average, from 0.6 to 0.9, and smaller values are observed only for the residue types, the percentage of which is substantially independent of the protein dimension, demonstrating that the dependence of pcaa,R on R is actually unbiased and genuine.
The percentage of occurrence of the amino acids in proteins depends, at least for some of the residues, on the protein dimension. This is not really unexpected, though it cannot be easily understood. Further studies seem to be necessary. It might be interesting to examine if the dependence of the amino acid composition on the protein dimension is different for different living species/phyla or for different types of proteins (enzymes, cytoskeleton components, metal storage systems, etc.). It must, eventually, be mentioned that these results might be extremely helpful in improving gene-finding algorithms, by restraining the gene triplet composition variance.
Methods
Protein sequences were taken from the UniProt database (The UniProt Consortium 2007), by downloading the uniref50 fasta file, which does not contain pairs of proteins with sequence identity >50%. Sequences containing residues unresolved or different from the 20 types of natural amino acids were ignored. About 550,000 sequences were retained, and their amino acid composition was computed with locally written computer programs.
Acknowledgments
This work was financially supported by the Austrian GEN-AU funding agency (BIN-II networks) and by the NAR funds of the Pavia University. S. Kumar, S. Kirillova, B. Sjoeblom, and K. Djinovic are gratefully acknowledged for helpful discussions.
Footnotes
Reprint requests to: Oliviero Carugo, Department of Biomolecular Structural Chemistry, Structural and Computational Biology Programme, Max F. Perutz Laboratories, Vienna University, Campus Vienna Biocenter 5, A-1030 Vienna, Austria; e-mail: oliviero.carugo@univie.ac.at; fax: 43-1-4277-9522.
Article and publication are at http://www.proteinscience.org/cgi/doi/10.1110/ps.037762.108.
References
- Carugo O. A structural proteomics filter: Prediction of the quaternary structural type of hetero-oligomeric proteins on the basis of their sequences. J. Appl. Crystallogr. 2007;40:986–989. [Google Scholar]
- Carugo O., Lu S., Luo J., Gu X., Liang S., Strobl S., Pongor S. Structural analysis of the free and enzyme-bound amaranth α-amylase inhibitor: Classification within the knottin fold superfamily and analysis of the functional flexibility. Protein Eng. 2001;14:639–646. doi: 10.1093/protein/14.9.639. [DOI] [PubMed] [Google Scholar]
- Chen C., Tian Y.X., Zou X.Y., Pai P.X., Mo J.Y. Using pseudo-amino acid composition and support vector machine to predict protein structural class. J. Theor. Biol. 2006;243:444–448. doi: 10.1016/j.jtbi.2006.06.025. [DOI] [PubMed] [Google Scholar]
- Chen K., Kurgan L., Rahbari M. Prediction of protein crystallization using collocation of amino acid pairs. Biochem. Biophys. Res. Commun. 2007;355:764–769. doi: 10.1016/j.bbrc.2007.02.040. [DOI] [PubMed] [Google Scholar]
- Coeytaux K., Poupon A. Prediction of unfolded segments in a protein sequence based on amino acid composition. Bioinformatics. 2005;21:1891–1900. doi: 10.1093/bioinformatics/bti266. [DOI] [PubMed] [Google Scholar]
- Cornish-Bowden A. The amino acid compositions of proteins are correlated with their molecular sizes. Biochem. J. 1983;213:271–274. doi: 10.1042/bj2130271. [DOI] [PMC free article] [PubMed] [Google Scholar]
- Fisher H.F. A limiting law relating the size and shape of protein molecules to their composition. Proc. Natl. Acad. Sci. 1964;51:1285–1291. doi: 10.1073/pnas.51.6.1285. [DOI] [PMC free article] [PubMed] [Google Scholar]
- Krishnan A., Giuliani A., Zbilut J.P., Tomita M. Network scaling invariants help to elucidate basic topological principles of proteins. J. Proteome Res. 2007;9:3924–3934. doi: 10.1021/pr070162v. [DOI] [PubMed] [Google Scholar]
- Marsili S., Chelli R., Schettino V., Procacci P. Thermodynamics of stacking interactions in proteins. Phys. Chem. Chem. Phys. 2008;10:2573–2585. doi: 10.1039/b718519g. [DOI] [PubMed] [Google Scholar]
- Murzin A.G., Brenner S.E., Hubbard T., Chothia C. SCOP: A structural classification of protein database for the investigation of sequences and structures. J. Mol. Biol. 1995;247:536–540. doi: 10.1006/jmbi.1995.0159. [DOI] [PubMed] [Google Scholar]
- Orengo C.A., Michie A.D., Jones S., Jones D.T., Swindells M.B., Thornton J.M. CATH—a hierarchical classification of protein domain structures. Structure. 1997;5:1093–1108. doi: 10.1016/s0969-2126(97)00260-8. [DOI] [PubMed] [Google Scholar]
- Rose G.D., Wetlaufer D.B. The number of turns in globular proteins. Nature. 1977;268:769–770. doi: 10.1038/268769a0. [DOI] [PubMed] [Google Scholar]
- Shen H., Chou K.-C. Using optimized evidence-theoretic K-nearest classifier and pseudo-amino acid composition to predict membrane protein types. Biochem. Biophys. Res. Commun. 2005;334:288–292. doi: 10.1016/j.bbrc.2005.06.087. [DOI] [PubMed] [Google Scholar]
- The UniProt Consortium. The Universal Protein Resource (UniProt) Nucleic Acids Res. 2007;35:D193–D197. doi: 10.1093/nar/gkl929. [DOI] [PMC free article] [PubMed] [Google Scholar]
- Yuan Z. Better prediction of protein contact number using a support vector regression analysis of amino acid sequence. BMC Bioinformatics. 2005;6:248. doi: 10.1186/1471-2105-6-248. [DOI] [PMC free article] [PubMed] [Google Scholar]