

Abstract
We used a novel graph-based approach to extract RNA tertiary motifs. We cataloged them all and clustered them using an innovative graph similarity measure. We applied our method to three widely studied structures: Haloarcula marismortui 50S (H.m 50S), Escherichia coli 50S (E. coli 50S), and Thermus thermophilus 16S (T.th 16S) RNAs. We identified 10 known motifs without any prior knowledge of their shapes or positions. We additionally identified four putative new motifs.
Keywords: RNA tertiary structure, clustering, graph similarity
INTRODUCTION
RNA adopts complex three-dimensional (3D) folds to perform biological functions in the cell. This molecular packing is the tertiary structure. Structural studies have revealed that RNA tertiary structure is modular and composed of conserved building blocks called “motifs,” the formation of which is sequence-dependent (Batey et al. 1999; Moore 1999; Westhof and Auffinger 2000; Hendrix et al. 2005; Holbrook 2005). Thus, the identification and classification of RNA structural motifs based on both sequence and structure information is useful for RNA folding prediction and modeling.
A number of representations of RNA tertiary structure at different levels of detail have been generated and used to develop automated methods for identifying motifs within RNA molecules. The first basic representations were Cartesian coordinates of the atoms or backbone torsion angles found in 3D structures (X-ray or NMR) (Duarte et al. 2003; Hershkovitz et al. 2003; Wadley and Pyle 2004; Huang et al. 2005; Oranit et al. 2005; Sarver et al. 2008). Further studies used these representations to develop graph-theoretical representations (Harrison et al. 2003; Artymiuk et al. 2005). In 2001, a descriptive base-pairing nomenclature was proposed by Leontis and Westhof (LW) to systematically annotate and classify non-Watson–Crick (non-WC) base pairs (Leontis and Westhof 2001; Leontis et al. 2002b; Lemieux and Major 2002; Yang et al. 2003; Jossinet and Westhof 2005). In a LW nomenclature-based representation, the tertiary structure is viewed as a (topological) general graph with vertices representing bases labeled by their sequence letter and residue number, and the edges representing the interactions between bases labeled by their type of interaction. This high-level and unambiguous representation of sequence and structure information will allow improved understanding of sequence-structure relations.
Motif recognition in structural genomics requires two problems to be addressed:
Given a description of a “known” motif, how to identify this motif in target structures?
Given a structure, how to identify “unknown” motifs within it?
Using graph theory, the problem of identifying a known pattern in a target graph reduces to the following: (1) searching for isomorphic occurrences of the pattern. This problem, known as subgraph isomorphism, is NP-complete on general graphs, i.e., is computationally intractable (Garey and Johnson 1979); or (2) finding similar occurrences of the pattern. Practically, this consists of identifying a maximum common subgraph (MCS) of two input graphs and calculating a score of similarity based on that common substructure. If the similarity score fulfils certain preset conditions, the two graphs are considered similar. However, the MCS problem is NP-complete too (Garey and Johnson 1979) and such an approach is not feasible except for very small graphs such as those in chemoinformatics (Le et al. 2004) in which data objects to be identified are chemical compounds described by planar graphs of small size (up to 15 nodes).
The identification of unknown motifs is made more difficult by the fact that the pattern is equally unknown. Thus, different approaches have been proposed. In particular, one study (Wadley and Pyle 2004) used a previous work on RNA worms (Duarte et al. 2003) to identify recurrent backbone conformations. However, and as pointed out by the authors, these motifs displayed no apparent secondary or primary structure signature and are thus unsuitable for prediction or modeling of RNA. Other studies used the Cartesian coordinates or a derived graph model to search for new patterns in RNA structures (Harrison et al. 2003; Oranit et al. 2005). Neither approach, however, addressed the problem of identifying occurrences with inserted bases or base pairs. Indeed, occurrences of a same motif are not always identical but rather display very similar features (Lescoute et al. 2005). The variations observed may be due to natural changes induced by evolution or experimental errors in data collection.
In this paper, we propose a new method for identifying and classifying similar occurrences of a priori unknown RNA motifs using the (topological) graph of the tertiary structure. RNA structural motifs are defined as small, recurrent, directed, and ordered stacked arrays of isosteric non-WC base pairs that intersperse the WC two-dimensional (2D) helices as seen in 2D representations of RNA structure and fold into essentially identical 3D structures (Leontis and Westhof 2003; Leontis et al. 2006). Two noncanonical base pairs are isosteric if they belong to the same geometric family and can substitute each other without distorting the fundamental 3D structure of the motif (Leontis and Westhof 2003). In the following, we write “secondary structure elements” for those regions of the secondary structure that correspond to the bulges, and internal, junction, and terminal loops, and “structural elements” for secondary structure elements to which we add the local non-WC base pairs.
In the next section, we introduce our proposed approach for discovering putative RNA motifs.
MATERIALS AND METHODS
Data
We downloaded crystal structures from the NDB database (Berman et al. 1992). We used the annotation program Rnaview (Yang et al. 2003) to produce the corresponding RNA graph (see details below). We considered 14 types of interactions: the phosphodiester (backbone) link, the canonical WC pairing GC and AU (to which the wobble pairing GU is commonly added), and the 12 non-WC base pairs defined in the LW nomenclature (Leontis and Westhof 2001; Leontis et al. 2002b). This classification is based on the observation that a noncanonical interaction involves three distinct edges: the WC edge, the Hoogsteen edge, and the Sugar edge. The bases interact in either of two orientations with respect to the glycosidic bonds; cis or trans relative to the hydrogen bonds.
Methods
Overview
We used a graph-based representation of the RNA tertiary structure with vertices representing the nucleotides labeled by their sequence letter and their residue number in the sequence, and edges representing the observed interactions between the nucleotides, labeled by the type of interaction. These interactions are:
Phosphodiester bonds (backbone) linking nucleotides adjacent in the sequence;
The WC or canonical pairings (GC, AU) and the wobble pairing GU forming the skeleton of the secondary structure; and
The 12 non-WC (noncanonical) base pairs defined by LW nomenclature.
We considered wobble pairings to be canonical. Backbone links are directed from 5′ to 3′ and noncanonical pairings with different interacting edges are directed according to the rule WC>Hoogsteen>Sugar edge. The rest of the interactions are symmetrical.
We undertook the following three steps:
Identify all secondary structure elements of the RNA tertiary structure;
Calculate a similarity measure for each pair of structural elements; and
Cluster the structural elements according to the similarity measure.
These steps are detailed below.
Identifying secondary structure elements
A previous study (Lescoute et al. 2005) identifying RNA motifs described local RNA motifs as “often embedded within regular helical regions forming internal loops, but may also comprise hairpin or junction loops.” Based on these observations, we took the following approaches: we first only considered backbone and canonical interactions (not including pseudoknots). Then, using a classical tree representation of the secondary structure (Zuker and Sankoff 1984; Shapiro 1988), we extracted the elements corresponding to the bulges, and internal, junction, and terminal loops modeled by graphs given by their vertices (the nucleotides) and their edges (the flanking canonical base pairs). Then, for each secondary structure element, and given that we were looking for local motifs, we restored all noncanonical edges between each of its vertices. We thus obtain the list of the structural elements of the input structure.
To remove pseudoknots, we used secrna, a program developed by Ponty (2006), which inputs an RNA pseudoknotted structure and returns its corresponding secondary structure without pseudoknots. The interested reader is referred to Smit et al. (2008) for a survey on the related computational methods.
Computing a similarity measure between two structural elements
The similarity measure between two structural elements involves computing the largest extensible common noncanonical subgraph (LECNS). The following definitions and notations are needed to understand this notion. The size of a graph G is defined by the number of its edges. The noncanonical size of G, denoted ║G║, is the number of its noncanonical edges. A graph containing only noncanonical edges is noncanonical. A common noncanonical subgraph of two graphs G 1 and G 2 is a noncanonical graph H that occurs in both G 1 and G 2.
The completion of a noncanonical subgraph H in graph G is the graph obtained by adding to H all canonical and backbone edges of G with at least one end in H. A common noncanonical subgraph of two graphs G 1 and G 2 is extensible if its completions in G 1 and in G 2, respectively, are isomorphic. Now, the LECNS of G 1 and G 2 is an extensible common noncanonical subgraph of G 1 and G 2 whose size is maximal. Figure 1 illustrates the notion of LECNS.
FIGURE 1.

Two structural elements containing 16S K-turn motifs. Dashed backbone indicates free nucleotides. In A on the left panel, a common noncanonical subgraph of size 3 is shown in bold. The completions of this common noncanonical subgraph, shown on the right panel, are not isomorphic due to the insertion of two free nucleotides (boxed). In B, a common noncanonical subgraph of size 2 is shown in bold on the left panel, with isomorphic completions on the right panel. The LECNS of these two structural elements is, thus, of size 2.
We implemented an algorithm for computing the LECNS of two given structural elements. Our algorithm makes use of Valiente's graph isomorphism algorithm (Valiente 2002). To identify the sequence signature of a motif, only the labels of the edges were considered relevant for the mapping.
The similarity between two graphs G 1 and G 2, denoted Sim(G 1, G 2), is defined by:
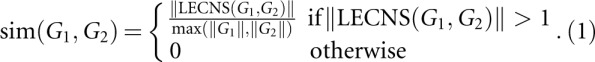 |
We consider a single common noncanoical edge not to be a relevant motif, and thus included the condition ║LECNS (G 1, G2)║>1 in the formula. The following properties hold:
0 ≤ sim (G 1,G 2) ≤ 1;
sim(G 1,G 2) = sim (G 2, G 1);
sim(G 1,G 2) = 1⇒ completions of the largest noncanonical subgraphs of G 1 and G 2 are isomorphic; and
sim(G 1,G 2) = 0 ⇒ G 1 and G 2 have no common noncanonical subgraph of size >1.
Clustering structural elements
We clustered the structural elements in three steps:
Step 1
We performed a classical hierarchical clustering with average linkage (UPGMA algorithm) analysis based on the measure of similarity defined above. We used the hclust function of the R project for statistical computing (http://www.r-project.org/). The resulting dendrogram is presented in Figure 2. Note that since hclust requires a dissimilarity measure, we set dis (G 1, G2) = 1 − sim (G 1, G 2).
FIGURE 2.

Dendrogram of hierarchical clustering of H.m 23S RNA produced with hclust. The structural elements are numbered from 1 to 209 (see Catalog, section 3.1). Rectangular boxes correspond to clusters obtained using the 0.6 similarity threshold. Structural elements clustered with a null similarity value are not shown. See Supplemental Material.
A threshold value was needed to obtain distinct clusters from the tree. This involved defining the minimal similarity value required within a single cluster. Thus, we took the known motifs of Haloarcula marismortui 23S (H.m 23S) (E-loop, sarcin–ricin, C-loop, K-turn) as a reference (Leontis et al. 2002a; Lescoute et al. 2005). The value giving optimal clustering of these motifs was 0.6 (Fig. 2). In particular, it distinguished a perturbed sarcin–ricin occurrence (Helix 23S Junction G475) in H.m 23S (Fig. 4 of Leontis et al. 2002a) from a variant of the 23S E-loop motif (23S G720) (Fig. 15 of Leontis et al. 2002a). We checked that all similar members of the same cluster had the same backbone orientation. Structural elements with a different backbone orientation from the other cluster members were not retained. The structural element 2 was thereby excluded from the cluster E (Fig. 2).
FIGURE 4.

Crystal structures of four putative new motifs superimposed. The RMS deviation values were calculated with Pymol by aligning the noncanonical core of all members of the cluster. Note that high values of RMS are due to inserted base pairs (dashed boxes on the 2D diagrams).
This first step clustered 41 of the 209 structural elements in H.m 23S. We identified 13 clusters, nine of which corresponded to known RNA motifs. Notably, although this threshold value was set using one reference structure H.m 23S, it also proved optimal for the other structures.
Step 2
Once the clusters had been generated, we extracted a representative common subgraph, called the noncanonical core, for each cluster and used it to identify a consensus structure for the cluster. The noncanonical core of a cluster is the largest extensible noncanonical subgraph common to >50% of the total number of members in the cluster. For each cluster, we checked whether the structural environment surrounding the noncanonical core shared common features at the level of the secondary structure. Clusters L, M, and N did not display common features such as these. Each of these clusters contained an internal loop and a junction loop from which no consensus structure could be derived. The clustering of these structural elements based solely on graph-similarity criteria could not be explained biologically; thus, the corresponding clusters were not considered to be relevant potential motifs.
Step 3
We used the noncanonical core of clusters retained for further analysis to perform graph-based comparisons with given structural elements. Thus, structural elements not belonging to any cluster but containing this core and consistent with the consensus structure were detected and added to their “natural” cluster. Indeed, the similarity threshold value of 0.6 was a good indicator of pairwise similarity when the noncanonical edges of the motif contributed to more than three-fifths of the noncanonical sizes of the two input graphs. Most structural elements (i.e., clustered at step 1) fulfilled this criterion. Those that did not, like the sarcin–ricin element (Fig. 2, see structural element 3), had a pairwise similarity value with each member of their expected cluster below the threshold because the number of the noncanonical edges of the motif in these structural elements contributed to less than three-fifths of their noncanonical size.
We thus clustered eight additional structural elements including the sarcin element S3 (see Supplemental Material).
RESULTS
We validated the identified motifs in two ways:
By verifying that the known RNA motifs (C-loops, K-turns, sarcin–ricins, E-loops) were correctly clustered; and
By calculating the RMSD between all members within a cluster.
To compare our results with previous findings (Leontis et al. 2002a; Lescoute et al. 2005), we used the same ribosomal crystal structures: H. marismortui 50S (pdb 1s72), Escherichia coli 50S (pdb 2aw4), and Thermus thermophilus 16S (pdb 1j5e).
The catalog
The database is available at http://www.lri.fr/∼md/RNA/CATALOGUE/catalogue.htm. We listed all structural elements for each chain in each structure. We gave the following data for each structural element:
An identifier: a sequential number corresponding to its rank in the tree representation.
The set of its noncanonical labels. These are codes used for the names of the interactions between nucleotides. The codes with the corresponding names of the interactions are summarized in a table on the home page of the URL cited above.
A descriptor: the detailed list of its nucleotides and all interactions between them.
A 2D view of its corresponding graph produced with Graphviz (http://www.graphviz.org/). This layout is unclear for some structural elements; in these cases, it might be helpful to refer back to the descriptor. The colors used are black for backbone, red for WC base pairs, and blue for noncanonical interactions.
A 3D view: a pdb file that isolates the structural element in the molecule.
Clustering
Clustering results are given for H.m 23S, E. coli 23S, and T.th 16S (Fig. 3; Table 1). No clusters were formed in the 5S chain of either H.m or E. coli. Figure 3 shows the 2D diagram of the consensus structure of each motif found (i.e., a structure observed in more than half the number of occurrences). For each motif, Table 1 lists the molecule it was observed in, the number of occurrences found, and the reference of any corresponding known motif. Modified occurrences of known motifs that were not clustered with their expected families are mentioned in the last column of the table. Further details for each motif are given in Supplemental Material.
FIGURE 3.

Recurrent motifs found in ribosomal structures. For further details on each motif see Supplemental Material.
TABLE 1.
List of the clusters formed in H.m 23S, E. coli 23S, and T.th 16S

Known motifs
C-loop (family C)
Two of three occurrences of the C-loop motif (C-96 and C-50) were clustered into family C for H.m 23S and E. coli 23S. The C-38 C-loop motif was not clustered into this family because the completion of its largest common noncanonical subgraph was not isomorphic to the completion of the same noncanonical subgraph in the reference C-96 motif. Moreover, the U2721–A2761 pairing in C-96 is canonical whereas its mapped base pair C963–A1005 in C-38 is a noncanonical cis WC/WC.
K-turn (family K)
This motif was observed in H.m 23S and T.th 16S. In H.m 23S, KT-7 and KT-38 were grouped together in cluster K. The trans Sugar-edge/Sugar-edge base-pairing in KT-46 and KT-58 (id 99 and 123) were not included in the annotation program output; therefore, they were not considered similar to the reference occurrence KT-7 and were clustered into family T. KT-15 did not match the definition of a motif embedded within a secondary structural element. Indeed, a canonical pairing, A248–U265, “cuts” the internal loop into two bulges (id 23 and 24). Moreover, the reported cis Sugar-edge/Sugar-edge base pair G249–U265 was not output by Rnaview. Finally, in KT-42 (internal loop 89), two noncanonical base pairs forming the noncanonical core of a typical K-turn were not output by Rnaview, and thus this structural element was not considered similar to a typical K-turn. Composite K-turns do not correspond to any secondary structural element and thus were not identified by our method. In T.th 16S, neither known occurrences, KT-11 or KT-23, were similar according to our similarity measure (Fig. 1) and hence did not form a cluster.
Sarcin–ricin (family S)
In T.th 16S, both known occurrences of the sarcin–ricin motif were clustered into family S. Six known local occurrences of this motif observed in H.m 23S were also clustered into this family. One composite occurrence, Helix36 Junction G911, was not recognized as a sarcin–ricin motif for the following reasons: The trans Hoogsteen/Hoogsteen base pair A913–G1071, which is part of the noncanonical core of a typical sarcin, was not output by Rnaview. Additionally, the discontinuous backbone between residues G1071 and G1292 prevented mapping the completions of the subgraphs corresponding to the noncanonical core. This F72 occurrence was clustered with two other occurrences of sarcin-like motifs, F76 and F30, into the 23S E-loop family F.
Five of six occurrences observed in E. coli 23S were clustered together in family S. G2664 was not recognized as a sarcin motif because A2654–C2666 was output by Rnaview as a trans Hoogsteen/WC and not a trans Hoogsteen/Hoogsteen, as in the sarcin core. This F199 occurrence was clustered with the E-loop family F.
E-loop (families E, F, G)
The bacterial E-loop motif consists of two isosteric submotifs related by 180° rotation (Leontis et al. 2002a):
trans Hoogsteen/Sugar edge;
trans WC/Hoogsteen or trans Sugar edge/Hoogsteen; and
cis bifurcated or trans Sugar edge/Hoogsteen.
Some examples of 23S rRNA E-loops have also been described (see Fig. 15 of Leontis et al. 2002a). Family E is similar to a 23S rRNA E-loop variant, which has a trans WC/Hoogsteen rather than a trans Sugar edge/Hoogsteen at the second base pair of the submotif. E22 and E35 motifs (see Supplemental Material), together with families F and G, despite lacking one sheared base pair, still qualify as another variant of the 23S E-loop (see Fig. 15 of Leontis et al. 2002a). Sarcin-like motifs F72, F76, and F30 may also be classified as bulged-G motifs (Corell et al. 2003).
Hook-turn (family H)
The H161 motif of family H was identified as a hook-turn (see Fig. 5 of Szep et al. 2003). In addition to the significant number of occurrences observed in both H.m 23S and E. coli 23S, this family is conspicuous in that the sequence signature of the noncanonical core is strikingly conserved (see Supplemental Material). Furthermore, all occurrences of this motif seem to occur at corresponding positions in both structures.
A-minor (family A)
A close examination of the three family A occurrences revealed that A60 is an A-minor motif, similar to that previously reported in Lescoute and Westhof (2006a).
This motif is termed A-minor because it involves the insertion of the smooth minor groove edges of adenine residues into the minor groove of neighboring helices, preferentially at CG base pairs. This motif plays an important role in stabilizing the tertiary structure of RNA (Nissen et al. 2001).
Reverse K-turn (family R)
Family R was previously identified as a reverse K-turn (see Fig. 2 of Leontis et al. 2006). Of note, R175 did not superimpose well with other occurrences of this motif (RMSD > 4 Å).
Tandem sheared (family T)
Family T is the well characterized tandem sheared GA motif. Three occurrences of this motif, T53, T131, and T3, in E. coli 23S and two, T65 and T1, in H.m 23S may also be 23S E-loops. The clustering of these occurrences with tandem sheared motifs is not inconsistent since both families share a common noncanonical core.
Putative new motifs
We did not identify any known motifs in clusters B, D, I, and J. Figure 4 shows the 2D diagram corresponding to each new motif together with the stereoview of its superimposed occurrences. In motif B, the occurrence B170 was identified as a three-way junction belonging to family B (see Fig. 7 of Lescoute and Westhof 2006b).
DISCUSSION
This study describes the first automated method for cataloging all structural elements of an RNA molecule and extracting similar occurrences of structural motifs on the basis of a graph of the tertiary structure. Using an innovative graph similarity measure, we identified several occurrences of structural motifs despite the presence of base and base pair insertions in some of these motifs. Such information regarding variation in base-pairing and position of insertions and deletions will allow the analysis and prediction of the 3D structure of RNA motifs based on sequence signature in homologous RNA molecules and the structure-based alignment of homologous sequences. A large proportion of the motifs found correspond to known structural motifs. Further expert examination of the putative new motifs will be required to confirm whether they represent real structural motifs.
Our approach relies on the LECNS algorithm, which identifies the largest common noncanonical subgraph of any two graphs, and hence determines the noncanonical core of an RNA motif. Our results showed that this algorithm successfully detects theoretical structural similarities within the graph model of the tertiary structure. However, the detection of composite occurrences of a motif made of discontinuous strands of backbone is still limited, even at this high level of representation.
The whole method detects clusters of potential recurrent motifs provided that at least two occurrences of any motif are present in the structure, with a similarity value of at least 0.6. From a probabilistic point of view, one may find it natural to expect that larger molecules are more likely to contain motifs. However, our findings suggest that molecule size and richness in terms of (recurrent) motifs, which cannot be determined a priori, are not related. Our method puts no limitations on the size of the input structure. Therefore, a short molecule would be similarly processed and, if it proves that it contains similar occurrences of the same motif, these occurrences would be detected and returned.
To increase the possibility of forming significant clusters, a set of structures could be used as input rather than just one. For instance, we know that the 5S rRNA chain of H.m contains one sarcin–ricin occurrence (internal loop 8). When applied to this chain, our method generated no clusters because this occurrence is unique in the chain. However, using both 23S and 5S chains of H.m as input, this unique 5S sarcin–ricin would have been clustered within its natural family S. More generally, using a set of molecules as input, even if each contained only a single occurrence of a potential motif, would increase the possibility of forming clusters with similar occurrences from other structures, whether they are new or have been previously identified. Once again, the clusters would form only if the occurrences belong to the same motif; and this information cannot be a priori inferred from either the size or the type of RNA chosen.
With the expected increase in the number of crystal structures available, this automated method, which rapidly identifies and classifies recurrent RNA motifs, will be useful in assessing their abundance in an RNA structure or in compiled databases such as the RNAJunction database (Bindewald et al. 2008). This will yield more insight into the mechanisms underlying the folding process of RNA and the biological roles mediated by these motifs in the cell.
SUPPLEMENTAL DATA
Supplemental material can be found at http://www.rnajournal.org.
ACKNOWLEDGMENTS
We thank Eric Westhof for helpful discussions and valuable suggestions. We are also grateful to Y. Ponty for providing secrna, and to J. Allali, R. Rivière, and F. Lemoine for helping with implementation details. This research was supported in part by the DIGITEO PASAPAS project, and by grants to M.D. from the Direction des Relations Internationales of Paris-Sud 11 University and from the Région Île-de-France.
Footnotes
Article published online ahead of print. Article and publication date are at http://www.rnajournal.org/cgi/doi/10.1261/rna.1061108.
REFERENCES
- Artymiuk P.J., Spriggs R.V., Willett P. Graph theoretic methods for the analysis of structural relationships in biological macromolecules: Research articles. J. Am. Soc. Inf. Sci. Technol. 2005;56:518–528. [Google Scholar]
- Batey R.T., Rambo R.P., Doudna J.A. Tertiary motifs in RNA structure and folding. Angew. Chem. Int. Ed. 1999;32:2326–2343. doi: 10.1002/(sici)1521-3773(19990816)38:16<2326::aid-anie2326>3.0.co;2-3. [DOI] [PubMed] [Google Scholar]
- Berman H.M., Olson W.K., Beveridge D.L., Westbrook J., Gelbin A., Demeny T., Hsieh S.-H., Srinivasan A.R., Schneider B. The nucleic acid database: A comprehensive relational database of three-dimensional structures of nucleic acids. Biophys. J. 1992;63:751–759. doi: 10.1016/S0006-3495(92)81649-1. [DOI] [PMC free article] [PubMed] [Google Scholar]
- Bindewald E., Hayes R., Yingling Y.G., Kasprzak W., Shapiro B.A. RNAJunction: A database of RNA junctions and kissing loops for three-dimensional structural analysis and nanodesign. Nucleic Acids Res. 2008;36:392–397. doi: 10.1093/nar/gkm842. [DOI] [PMC free article] [PubMed] [Google Scholar]
- Corell C.C., Beneken J., Plantinga M.J., Lubbers M., Chan Y.-L. The common and the distinctive features of the bulged-G motif based on a 1.04 Å resolution RNA structure. Nucleic Acids Res. 2003;31:6806–6818. doi: 10.1093/nar/gkg908. [DOI] [PMC free article] [PubMed] [Google Scholar]
- Duarte C.M., Wadley L.M., Pyle A.M. RNA structure comparison, motif search and discovery using a reduced representation of RNA conformational space. Nucleic Acids Res. 2003;31:4755–4761. doi: 10.1093/nar/gkg682. [DOI] [PMC free article] [PubMed] [Google Scholar]
- Garey M.R., Johnson D.S. Computers and intractability: A guide to the theory of NP Completeness. Freeman; New York: 1979. [Google Scholar]
- Harrison A., South D.R., Willett P., Artymiuk P.J. Representation, searching and discovery of patterns of bases in complex RNA structures. J. Comput. Aided Mol. Des. 2003;17:537–549. doi: 10.1023/b:jcam.0000004603.15856.32. [DOI] [PubMed] [Google Scholar]
- Hendrix D.K., Brenner S.E., Holbrook S.R. RNA structural motifs: Building blocks of a modular molecule. Q. Rev. Biophys. 2005;38:221–243. doi: 10.1017/S0033583506004215. [DOI] [PubMed] [Google Scholar]
- Hershkovitz E., Tannenbaum E., Howerton S.B., Sheth A., Tannenbaum A., Williams L.D. Automated identification of RNA conformational motifs: Theory and application to the HM LSU 23S rRNA. Nucleic Acids Res. 2003;31:6249–6257. doi: 10.1093/nar/gkg835. [DOI] [PMC free article] [PubMed] [Google Scholar]
- Holbrook S.R. RNA structure: The long and the short of it. Curr. Opin. Struct. Biol. 2005;15:302–308. doi: 10.1016/j.sbi.2005.04.005. [DOI] [PMC free article] [PubMed] [Google Scholar]
- Huang H.C., Nagaswamy U., Fox G.E. The application of cluster analysis in the intercomparison of loop structures in RNA. RNA. 2005;11:412–423. doi: 10.1261/rna.7104605. [DOI] [PMC free article] [PubMed] [Google Scholar]
- Jossinet F., Westhof E. Sequence to Structure (S2S): Display, manipulate and interconnect RNA data from sequence to structure. Bioinformatics. 2005;21:3320–3321. doi: 10.1093/bioinformatics/bti504. [DOI] [PubMed] [Google Scholar]
- Le S.Q., Ho T.B., Phan T.T.H. A novel graph-based similarity measure for 2D chemical structures. Genome Inform. 2004;15:82–91. [PubMed] [Google Scholar]
- Lemieux S., Major F. RNA canonical and noncanonical base-pairing types: A recognition method and complete repertoire. Nucleic Acids Res. 2002;30:4250–4263. doi: 10.1093/nar/gkf540. [DOI] [PMC free article] [PubMed] [Google Scholar]
- Leontis N.B., Westhof E. Geometric nomenclature and classification of RNA base pairs. RNA. 2001;7:499–512. doi: 10.1017/s1355838201002515. [DOI] [PMC free article] [PubMed] [Google Scholar]
- Leontis N.B., Westhof E. Analysis of RNA motifs. Curr. Opin. Struct. Biol. 2003;13:300–308. doi: 10.1016/s0959-440x(03)00076-9. [DOI] [PubMed] [Google Scholar]
- Leontis N.B., Stombaugh J., Westhof E. Motif prediction in ribosomal RNAs. Lessons and prospects for automated motif prediction in homologous RNA molecules. Biochimie. 2002a;84:961–973. doi: 10.1016/s0300-9084(02)01463-3. [DOI] [PubMed] [Google Scholar]
- Leontis N.B., Stombaugh J., Westhof E. Survey and summary. The non-Watson–Crick base pairs and their associated isostericity matrices. Nucleic Acids Res. 2002b;30:3497–3531. doi: 10.1093/nar/gkf481. [DOI] [PMC free article] [PubMed] [Google Scholar]
- Leontis N.B., Lescoute A., Westhof E. The building blocks and motifs of RNA architecture. Curr. Opin. Struct. Biol. 2006;16:1–9. doi: 10.1016/j.sbi.2006.05.009. [DOI] [PMC free article] [PubMed] [Google Scholar]
- Lescoute A., Westhof E. The A-minor motifs in the decoding recognition process. Biochimie. 2006a;88:993–999. doi: 10.1016/j.biochi.2006.05.018. [DOI] [PubMed] [Google Scholar]
- Lescoute A., Westhof E. Topology of three-way junctions in folded RNAs. RNA. 2006b;12:83–93. doi: 10.1261/rna.2208106. [DOI] [PMC free article] [PubMed] [Google Scholar]
- Lescoute A., Leontis N.B., Massire C., Westhof E. Recurrent structural RNA motifs, isostericity matrices and sequence alignments. Nucleic Acids Res. 2005;33:2395–2409. doi: 10.1093/nar/gki535. [DOI] [PMC free article] [PubMed] [Google Scholar]
- Moore P.B. Structural motifs in RNA. Annu. Rev. Biochem. 1999;68:287–300. doi: 10.1146/annurev.biochem.68.1.287. [DOI] [PubMed] [Google Scholar]
- Nissen P., Ippolito J.A., Ban N., Moore P.B., Steitz T.A. RNA tertiary interactions in the large ribosomal subunit: The A-minor motif. Proc. Natl. Acad. Sci. 2001;98:4899–4903. doi: 10.1073/pnas.081082398. [DOI] [PMC free article] [PubMed] [Google Scholar]
- Oranit D., Nussinov R., Wolfson H. ARTS: Alignment of RNA tertiary structures. Bioinformatics. 2005;21:ii47–ii53. doi: 10.1093/bioinformatics/bti1108. [DOI] [PubMed] [Google Scholar]
- Ponty Y. 2006. Modélisation de séquences génomiques structurées, génération aléatoire et application. Ph.D. thesis, Université Paris-Sud 11. [Google Scholar]
- Sarver M., Zirbel C.L., Stombaugh J., Mokdad A., Leontis N.B. FR3D: Finding local and composite recurrent structural motifs in RNA 3D structures. J. Math. Biol. 2008;56:215–252. doi: 10.1007/s00285-007-0110-x. [DOI] [PMC free article] [PubMed] [Google Scholar]
- Shapiro B.A. An algorithm for comparing multiple RNA secondary structures. Comput. Appl. Biosci. 1988;4:387–393. doi: 10.1093/bioinformatics/4.3.387. [DOI] [PubMed] [Google Scholar]
- Smit S., Rother K., Heringa J., Knight R. From knotted to nested RNA structures: A variety of computational methods for pseudoknot removal. RNA. 2008;14:410–416. doi: 10.1261/rna.881308. [DOI] [PMC free article] [PubMed] [Google Scholar]
- Szep S., Wang J., Moore P.B. The crystal structure of a 26-nucleotide RNA containing a hook-turn. RNA. 2003;9:44–51. doi: 10.1261/rna.2107303. [DOI] [PMC free article] [PubMed] [Google Scholar]
- Valiente G. Algorithms on trees and graphs. Springer; Berlin: 2002. [Google Scholar]
- Wadley L.M., Pyle A.M. The identification of novel RNA structural motifs using COMPADRES: An automated approach to structural discovery. Nucleic Acids Res. 2004;32:6650–6659. doi: 10.1093/nar/gkh1002. [DOI] [PMC free article] [PubMed] [Google Scholar]
- Westhof E., Auffinger P. RNA tertiary structure. In: Meyers R.A., editor. Encyclopedia of analytical chemistry. J. Wiley; Chichester, UK: 2000. pp. 5222–5232. [Google Scholar]
- Yang H., Jossinet F., Leontis N., Chen L., Westbrook J., Berman H.M., Westhof E. Tools for the automatic identification and classification of RNA base pairs. Nucleic Acids Res. 2003;31:3450–3460. doi: 10.1093/nar/gkg529. [DOI] [PMC free article] [PubMed] [Google Scholar]
- Zuker M., Sankoff D. RNA secondary structures and their prediction. Bull. Math. Biol. 1984;46:591–621. [Google Scholar]