Abstract
Longitudinal studies of neurocognitive function in prediagnosis Huntington disease (pre-HD) have been few, and duration of follow-up has been brief. In the current study, 155 individuals at-risk for HD completed a battery of cognitive and motor tasks at two study visits approximately 10 years apart. Participants were classified as: 1) at-risk, without the CAG expansion (normal controls, NC; n = 112), or 2) CAG expanded (CAG+; n = 43). To examine the rate of decline at different stages of the pre-HD period, participants in the CAG+ group were further characterized as converters (i.e., individuals who developed manifest HD over the course of the study; n = 21) or nonconverters (n = 22), and their performances were compared. The CAG+ group exhibited faster rates of neurocognitive decline over the course of the study, relative to the NC group. In addition, more rapid decline was associated with closer proximity to estimated age of disease onset in the CAG+ group. Faster rates of motor and psychomotor decline were observed in the CAG+ converter group, relative to the nonconverters. These findings suggest that neurocognitive decline in pre-HD, particularly in motor and psychomotor domains, begins insidiously and accelerates as individuals approach disease onset.
Keywords: Huntington disease, prediagnosis, longitudinal, neurocognitive
Introduction
Huntington disease (HD) is an autosomal dominant, neurodegenerative disorder caused by the unstable expansion of a normal trinucleotide (CAG) repeat1 resulting in motor, cognitive, and psychiatric abnormalities. Onset is insidious, and abnormalities gradually worsen until the individual reaches the point of clinical diagnosis, which is based on findings in the neurological examination of unequivocal motor signs (e.g., chorea, bradykinesia) consistent with HD.
Certain neurocognitive domains appear particularly vulnerable in the early stages (even prior to clinical diagnosis) of HD (pre-HD). Tasks that index executive functions, learning and memory, motor and psychomotor speed, timing and movement sequencing, and face/emotion processing have shown sensitivity to early disease processes2-14. It has been suggested that such tasks may be employed as outcome measures in future clinical trials of compounds designed to delay HD progression. However, to determine the potential value of these clinical outcome measures for interventional trials, we must first understand the temporal pattern and rate of neurocognitive decline during pre-diagnosis and early HD.
Cross-sectional studies have stratified pre-HD samples according to the participants' estimated proximity to disease onset (i.e., clinical diagnosis) and compared neurocognitive performance across groups11,15-17. These studies suggest that neurocognitive function remains relatively unaffected in individuals who are far from disease onset; however, as individuals near onset, significant abnormalities become evident, particularly in domains that engage fronto-striatal circuitry (e.g., executive functions, motor and psychomotor speed).
Longitudinal studies offer a direct assessment of the pattern of neurocognitive decline as it develops and progresses throughout pre- and early HD. However, few longitudinal studies have examined neurocognitive function in pre-HD, and the duration of follow-up in these studies has been brief; in some cases, too brief even to detect appreciable decline, much less to assess differences in the rate of decline at various stages of the pre-HD period. Nevertheless, some longitudinal data suggest that even over a 2-3 year period, significant decline is detectable6,9,18,19.
The current study is the lengthiest longitudinal assessment of a group of CAG expanded (CAG+) individuals. We anticipated that individuals who inherited the HD CAG expansion would show faster rates of decline on measures of reaction time, motor speed, and cognitive function, relative to individuals without the CAG expansion. Further, we examined the relationship between rate of neurocognitive decline and estimated proximity to disease onset, with the expectation that faster rates of decline would be associated with fewer estimated years to onset. Finally, to examine the rate of decline for individual neurocognitive measures at different stages of the pre-HD period, we compared the performance of CAG+ participants who converted to manifest HD over the course of the study with that of CAG+ participants who remained pre-diagnosis at follow-up.
Materials and Methods
Participants
The National Research Roster for Huntington Disease Patients and Families (HD Roster) recruited participants for both the initial and longitudinal visit. Of the original group of individuals who participated in the first visit (n = 665), 141 were lost to follow-up and 15 were deceased. An additional 76 were over the age of 65 and thus ineligible for the longitudinal visit. The remaining 433 participants were sent a letter by the HD Roster which provided the inclusion criteria for the longitudinal study (i.e., the individual must still be considered pre-HD or, if diagnosed, must be within 2 years of the diagnosis). Two hundred thirteen individuals requested more information about the study, and of these, 174 eventually participated in the study. Forty individuals responded that they no longer met the study eligibility criteria, presumably because they were diagnosed for more than 2 years, and 21 were not interested in participating. At the initial visit, 32% of the participants were CAG+. At the second visit, 28% of the subjects were CAG+.
Clinical Evaluation
Study neurologists were aware that participants were at-risk for HD but were blinded to results of molecular testing and other assessments. At the first study visit3,13, motor function was assessed with a quantified neurologic examination adapted from previously described protocols20,21. The neurologist assigned an overall rating: 0 = normal; 1 = minor soft signs; 2 = major soft signs; or 3 = definite HD. At the second visit, the motor portion of the Unified Huntington's Disease Rating Scale (UHDRS)22 was administered and the neurologist provided an overall rating: 0 = normal (no abnormalities); 1 = non-specific motor abnormalities (less than 50% confidence that observed abnormalities were indicative of HD); 2 = motor abnormalities that may be signs of HD (50-89% confidence); 3 = motor abnormalities that are likely signs of HD (90-98% confidence); or 4 = motor abnormalities that are unequivocal signs of HD (≥ 99% confidence).
In addition to the neurological exam, participants were screened for other disorders. Participants (n = 8) reporting a concurrent neurological illness, major psychiatric diagnosis (i.e. schizophrenia, bipolar disorder), or current alcohol or drug abuse were excluded from analysis.
Molecular Testing and Estimated Time to Diagnosis
Molecular testing to determine the number of CAG repeats in the huntingtin gene23 was used to classify participants as: 1) normal controls (NC) with two unexpanded HD alleles (< 28 CAG repeats); or 2) CAG expanded (CAG+) with at least one expanded allele (≥ 39 CAG repeats). Individuals with ambiguous CAG repeats (n = 11; 28 - 36 repeats) were excluded from subsequent analyses.
A total of 155 participants (112 NC; 43 CAG+) were employed in the analyses (Table 1). Of the 43 CAG+ participants, 22 were considered non-converters (i.e., they were still pre-diagnosis at the second study visit). The 21 participants who were prediagnosis at their first visit but received a UHDRS confidence rating of 4 at their second visit were considered to have converted to clinically recognizable disease (converters).
Table 1.
Participant characteristics
| Demographic | NC | CAG+ |
|---|---|---|
| Number of subjects | 112 | 43 |
| Age (yr)a,b | 38 ± 8 | 37 ± 8 |
| Education (yr)b | 15 ± 3 | 16 ± 3 |
| Male-female ratioc,d | 27/85 | 19/24 |
| Race (%white)c | 98 | 98 |
| Handedness (% right)c | 87 | 93 |
| Auditory reaction time (ms)b,d | 0.004 ± 0.002 | 0.005 ± 0.003 |
| Visual reaction time (ms)b,e | 0.001 ± 0.002 | 0.002 ± 0.002 |
| Decision reaction time (ms)b,e | 0.001 ± 0.003 | 0.003 ± 0.004 |
| Movement time (ms)b,e | -0.0003 ± 0.003 | 0.001 ± 0.004 |
| Decision movement time (ms)b,e | -0.001 ± 0.003 | 0.000001 ± 0.003 |
| Button tapping (30 × 0.1 s)b,e | -0.27 ± 0.27 | -0.10 ± 0.34 |
| WAIS-R arithmeticb | 0.021 ± 0.22 | -0.03 ± 0.24 |
| WAIS-R picture arrangementb,d | 0.15 ± 0.34 | -0.01 ± 0.44 |
| WAIS-R digit symbolb,e | -0.64 ± 0.81 | -1.112 ± 0.95 |
Age at initial study visit
Mean ± Standard Deviation
Ratio and percentages (%) were evaluated by Fisher's exact test statistic. All other comparisons performed using t-test
p < .05
p ≤ .01
For the CAG+ participants, the estimated age of diagnosis was computed using the CAG repeat length for the larger allele and the participant's age at the time of the first visit24. Estimated time to diagnosis (ETD) was computed as the difference between the participant's estimated age of diagnosis and age at the first study visit. Average ETD was 18 years.
Neurocognitive Battery
Three subtests of the Wechsler Adult Intelligence Scale – Revised (WAIS-R) were administered. The Arithmetic subtest was used to index working memory processes, the Picture Arrangement subtest assessed nonverbal reasoning and planning (executive functions), and the Digit Symbol subtest measured visual attention and psychomotor speed. Scores were calculated as total correct.
Six tests from the computerized H-scan system (Hoch Co., Corona del Mar CA 92625) were administered7,25 The protocol included three tests of reaction time/motor initiation (Auditory Reaction Time, Visual Reaction Time, Decision Reaction Time) and three tests of motor speed (Movement Time, Decision Movement Time, Alternate Button Tapping). Participants were tested using the dominant hand only.
Statistical Analysis
The rate of change for each neurocognitive measure was computed for each participant as follows: Rate of change = (score2 − score1)/(age2− age1). One participant was excluded from further analysis because of extreme values on more than one measure's rate of change.
Initially, one-sided t-tests were used to test whether the rate of decline for each variable was significantly faster in the CAG+ group as compared with the NC group. Subsequent analyses focused on the CAG+ group to examine whether rates of decline on study measures varied as a function of disease progression. We first assessed whether rate of decline accelerated as participants approached their estimated age of diagnosis; Spearman correlation analysis was employed to test for a significant association between the rate of change for each study measure and ETD. We then used the clinical information gathered from the neurological evaluation at the second visit to separate the CAG+ group into two subsets: 1) those who converted to manifest HD over the course of the study, and 2) those who remained prediagnosis at follow-up. Using the nonparametric, one-sided Wilcoxon rank sum test, we tested whether the rate of decline on study measures differed between converters and nonconverters.
Results
Preliminary Analyses
The NC and CAG+ groups did not differ in age, years of education, handedness, or race (Table 1). There was a significant difference in the male:female ratio in the two groups.; the proportion of male subjects in the CAG+ group was greater than that in the NC group.
As a group, the CAG+ participants demonstrated significantly faster rates of decline on most measures of cognitive and motor/psychomotor function, relative to the NC group, p ≤ .03 (Table 1). The only exception was the Arithmetic subtest of the WAIS-R, p > .05 (Table 1).
Neurocognitive Decline and Estimated Time to Diagnosis in the CAG+ Group
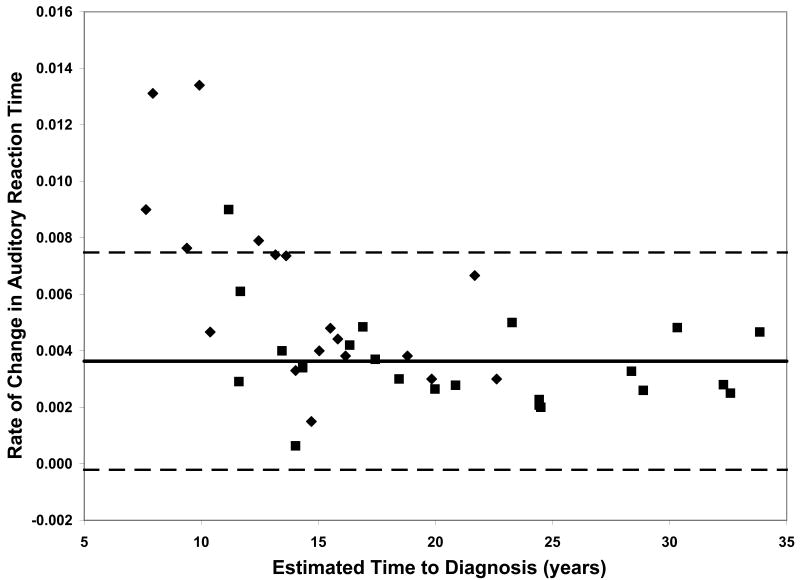
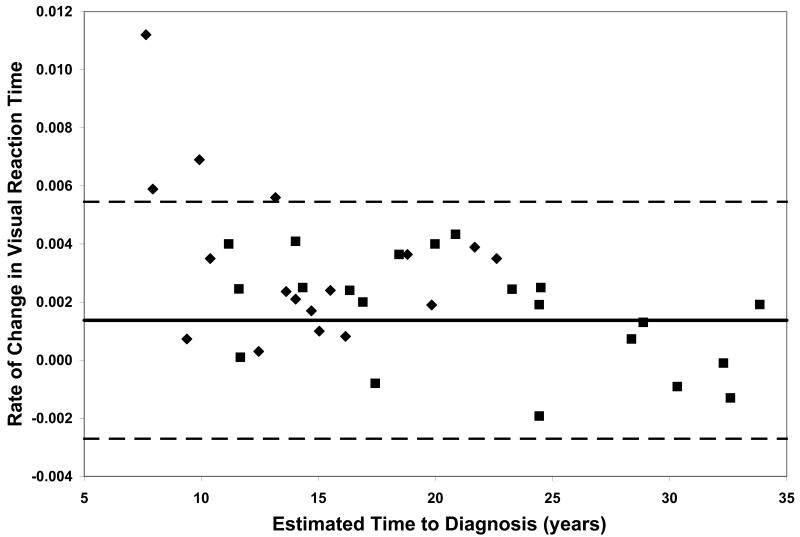
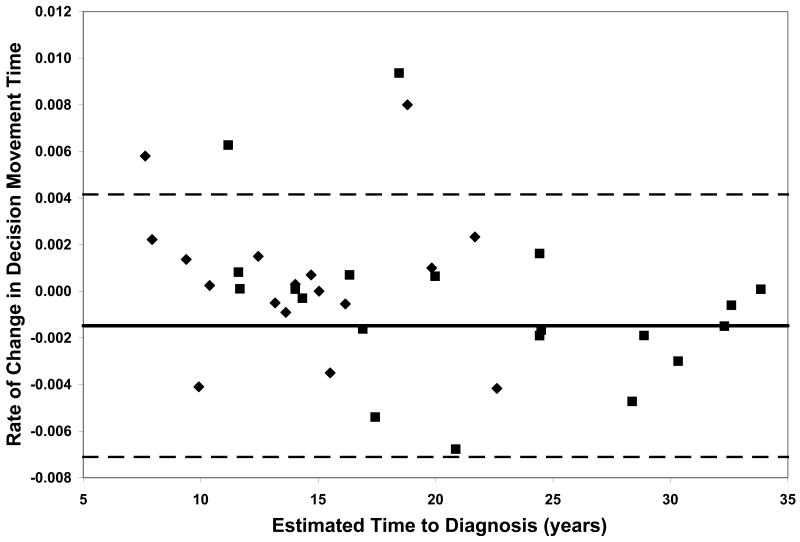
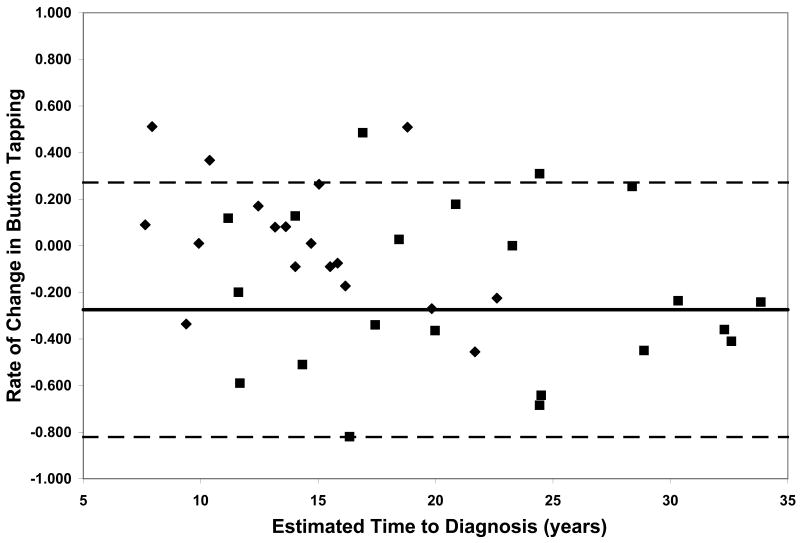
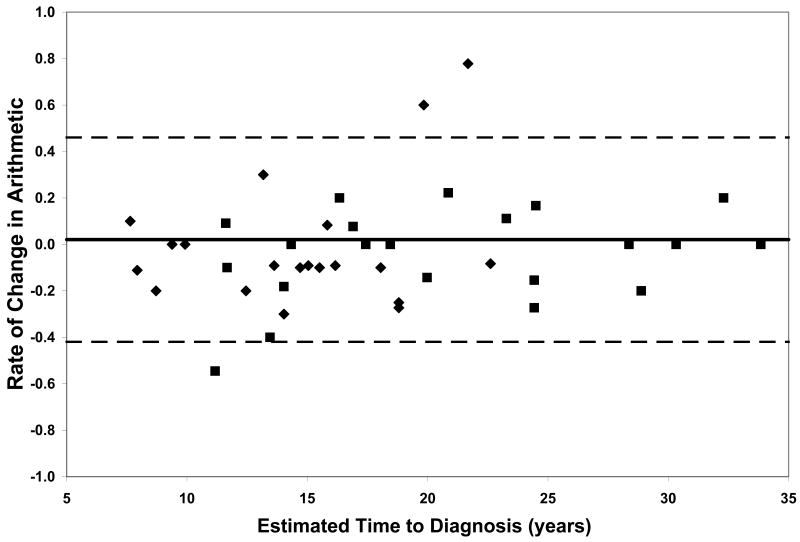
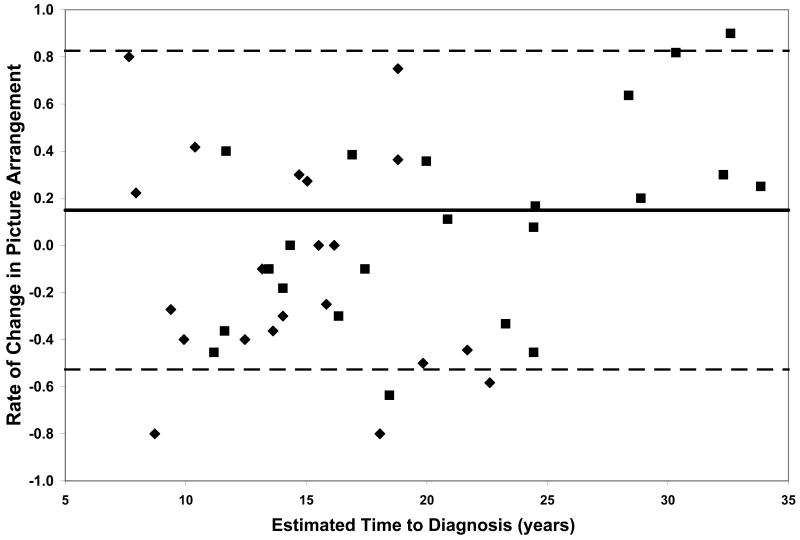
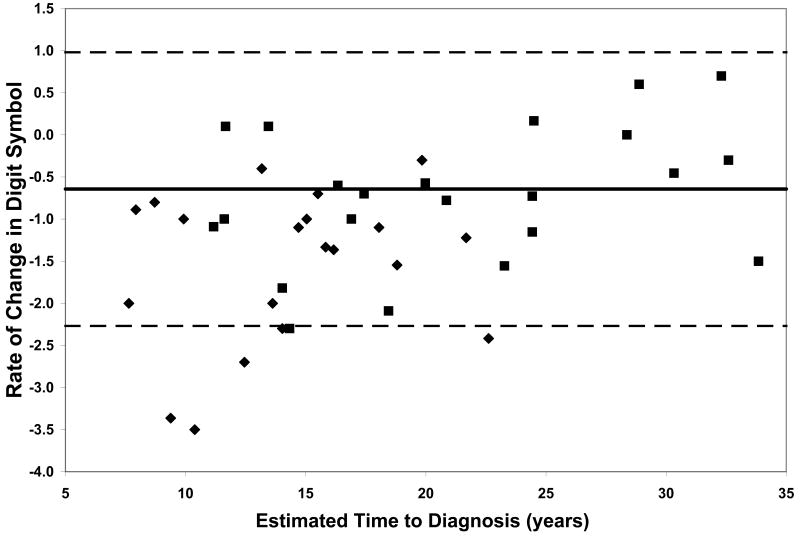
On all measures of reaction time and motor speed, a negative correlation was found between rate of decline and estimated time to diagnosis in the CAG+ group. That is, faster rates of decline in motor and psychomotor function (i.e., greater increases in reaction time and time to task completion) were observed in individuals who were closer to their estimated age of onset (-.56 ≤ r ≤-.36, p ≤ .03, Table 2). On only one of the WAIS-R subtests was rate of decline related to estimated time to diagnosis; larger differences between scores at visit 1 and visit 2 on the Digit Symbol task were associated with closer proximity to disease onset (r = .35, p < .03, Table 2). Figure 1 plots the rates of change of CAG+ individuals against their ETD.
Table 2.
Correlation Analysis
| Rate of Change Measure | Spearman Correlation1,2 |
|---|---|
| Auditory Reaction Time (milliseconds) † | -0.56 |
| Visual Reaction Time (milliseconds) ** | -0.42 |
| Decision Reaction Time (milliseconds) ** | -0.46 |
| Movement Time (milliseconds) ** | -0.40 |
| Decision Movement Time (milliseconds) ** | -0.40 |
| Button Tapping (30 × 0.1 seconds) * | -0.36 |
| WAIS-R Arithmetic | 0.21 |
| WAIS –R Picture arrangement | 0.21 |
| WAIS- R Digit symbol * | 0.35 |
Correlation between the rate of change on each measure and estimated time to disease onset.
Increased reaction time and time to completion on H-scan measures reflect a decline in test performance, and a negative correlation is consistent with the study hypothesis. For the 3 WAIS-R subtests, a lower score indicates a decline in test performance, and a positive correlation is consistent with the study hypothesis.
p < .05
p ≤ .01
p < .001
Figure 1.
Performance of the CAG+ group on study measures. The CAG+ converters are shown with a diamond, the CAG+ nonconverters are shown with a square. The thick black line represents the mean rate of change for the NC group (CAG-). The dashed lines represent ± 2 standard deviations of the mean for the NC group. A. Auditory Reaction Time; B. Visual Reaction Time; C. Decision Reaction Time; D. Movement Time; E. Decision Movement Time; F. Button Tapping; G. WAIS-R Arithmetic; H. WAIS-R Picture Arrangement; I. WAIS-R Digit Symbol
Neurocognitive Decline in CAG+ Converters versus Non-converters
To further characterize rate of neurocognitive decline across various measures and at different stages of the pre-HD period, we compared rates of change in the two subsets of the CAG+ group, those that converted to manifest HD over the course of the study and those that did not convert. This provided a means to further interpret whether more rapid decline occurs in motor, psychomotor, and/or cognitive domains as individuals approach clinical disease onset (i.e., diagnosis). Moreover, this addressed the question of which neurocognitive functions decline more rapidly as individuals approach disease onset. The group of CAG+ participants who converted to manifest HD over the course of the study exhibited faster rates of decline, relative to the CAG+ non-converter group, on several measures of motor and psychomotor function. Specifically, the CAG+ converter group showed more rapid decline on the Auditory Reaction Time task, p < .01, the Movement Time task, p < .05, the Button Tapping task, p < .05, and the Digit Symbol subtest of the WAIS-R, p < .01 (Figure 1).
Discussion
To our knowledge, this is the first longitudinal report of neurocognitive function in pre-HD over such an extended period. We found that the mean rate of neurocognitive decline across the 10 year interval was significantly greater in the CAG+ group as compared with the NC group. In the CAG+ group, faster decline on most study measures was associated with closer proximity to estimated age of disease onset. Furthermore, faster rates of decline in motor and psychomotor function were observed in the CAG+ converter group, relative to the nonconverters. These findings suggest that neurocognitive decline in pre-HD, particularly in motor and psychomotor domains, begins insidiously and accelerates as individuals approach disease onset.
Although our sample is not large enough to quantitatively model the pattern of increasing rates of decline on various measures with decreasing estimated time to diagnosis, the plots of individual participants' rates of decline in Figure 1 reveal some interesting patterns. First, and not unexpectedly, the converters (diamonds) generally entered the study closer to their estimated age of diagnosis than the non-converters (squares), although two participants who were estimated at baseline to be more than 20 years from their age of diagnosis had converted by the second visit. Secondly, the rate of decline on reaction time tests appears to accelerate approximately 15 years prior to diagnosis. In contrast, the point at which decline becomes more rapid on measures of motor/psychomotor speed and cognition is less clear. Decline in performance on the Digit Symbol test, in particular, appears to begin decades before diagnosis, such that most individual's rates of decline are below the mean of the NC group as many as 25 years before their estimated age of diagnosis. Also of note is that although the CAG+ group's rate of decline on the Arithmetic test was not significantly faster than that of the NC group (Table 1), the vast majority of the CAG+ individuals exhibited faster-than-normal rates of decline once they were within 20 years of their estimated age of diagnosis. As longitudinal data become available in larger studies, statistical models can be fitted to the data, which will allow for comparison of these patterns across different measures.
Within each plot in Figure 1, the normal range (mean of the NC group ± 2 SD) of the rate of change for each measure is superimposed on the rates of change of the CAG+ participants. Despite the greater mean rates of decline in the CAG+ group as a whole (Table 1), individual participants' rates of change generally were within the normal range except for a few participants who were closer to their estimated age of diagnosis at baseline. These data suggest that rate of decline is heterogeneous across CAG+ individuals. The graphs in Figure 1 also suggest that having a rate of decline within the normal range does not rule out impending disease onset, but abnormally high rates of decline may suggest greater likelihood of a forthcoming diagnosis.
Although rate of change on most tasks correlated with ETD, the strongest relationships between neurocognitive performance and actual disease onset (as indicated by the comparison of converters and nonconverters) were observed on measures of motor and psychomotor function (i.e., the Auditory Reaction Time, Movement Time, Button Tapping, and Digit Symbol tasks). This finding could be taken to suggest that future pre-HD studies should emphasize motor and psychomotor, rather than cognitive, assessment in order to maximize sensitivity. However, our results also likely reflect the way in which disease onset is defined in HD. Historically, onset has been defined as the point at which an individual exhibits motor abnormalities on clinical examination that are deemed (i.e., by a neurologist or other trained clinical examiner) unequivocal signs of HD. Thus, onset is defined exclusively on the basis of motor signs, with no consideration of cognitive and/or psychiatric data. However, the heterogeneity of HD presentation and progression has been well-documented in the literature, and numerous studies suggest that cognitive and/or psychiatric symptoms may precede the onset of clinically significant motor signs in pre-HD, at least in some individuals. As such, any study that relies on proximity to disease onset/diagnosis as an indication of disease progression/severity gives greater weight to motor signs. Moreover, given the motor-based definition of disease onset, it is not surprising that rate of decline in motor and psychomotor, but not cognitive, domains appears to accelerate as individuals approach their estimated age of diagnosis. Future work is needed to determine the relative sensitivity of various motor, psychomotor, and cognitive tasks across the pre-HD period. Presumably, some tasks are more sensitive in individuals who are very far from frank disease onset and become less useful with advancing disease, whereas other measures may lack sensitivity early on but prove quite useful in later stages of disease progression.
The major strength of this study is the duration of follow-up; this is one of the lengthiest longitudinal studies in pre-HD. Our data are consistent with previous results suggesting that sub-clinical declines in neurocognitive function occur in the prediagnosis stages of HD. Moreover, our findings suggest that disease progression in pre-HD is heterogeneous across individuals as well as across cognitive domains. Finally, although speculative, these data raise the possibility of a nonlinear course in pre-HD, particularly with regard to the development and progression of motor and psychomotor abnormalities. Taken cumulatively with the extant literature, these findings highlight the need for future studies that address the diagnostic challenges in HD. In particular, it will be important to examine whether there exist distinct subtypes of HD, which may vary both in phenotypic presentation and in rate of disease progression across neurocognitive, psychiatric, and motor domains.
Acknowledgments
We gratefully acknowledge the individuals who participated in this study. We thank the anonymous reviewers for their helpful suggestions which substantially improved this manuscript. This work was supported by NIH grants R01 NS042659, N01-NS-3-2357 and MO1 RR-00750.
References
- 1.Huntington's Disease Collaborative Research Group A novel gene containing a trinucleotide repeat that is expanded and unstable on Huntington's disease chromosomes. Cell. 1993;72:971–983. doi: 10.1016/0092-8674(93)90585-e. [DOI] [PubMed] [Google Scholar]
- 2.Feigin A, Ghilardi MF, Huang C, et al. Preclinical Huntington's disease: compensatory brain responses during learning. Ann Neurol. 2006;59:53–59. doi: 10.1002/ana.20684. [DOI] [PMC free article] [PubMed] [Google Scholar]
- 3.Foroud T, Siemers E, Kleindorfer D, et al. Cognitive scores in carriers of Huntington's disease gene compared to noncarriers. Ann Neurol. 1995;37:657–664. doi: 10.1002/ana.410370516. [DOI] [PubMed] [Google Scholar]
- 4.Gomez-Anson B, Alegret M, Munoz E, Sainz A, Monte GC, Tolosa E. Decreased frontal choline and neuropsychological performance in preclinical Huntington disease. Neurology. 2007;68:906–910. doi: 10.1212/01.wnl.0000257090.01107.2f. [DOI] [PubMed] [Google Scholar]
- 5.Johnson SA, Stout JC, Solomon AC, et al. Beyond disgust: impaired recognition of negative emotions prior to diagnosis in Huntington's disease. Brain. 2007;130:1732–1744. doi: 10.1093/brain/awm107. [DOI] [PubMed] [Google Scholar]
- 6.Kirkwood SC, Siemers E, Stout JC, et al. Longitudinal cognitive and motor changes among presymptomatic Huntington disease gene carriers. Arch Neurol. 1999;56:563–568. doi: 10.1001/archneur.56.5.563. [DOI] [PubMed] [Google Scholar]
- 7.Kirkwood SC, Siemers E, Hodes ME, Conneally PM, Christian JC, Foroud T. Subtle changes among presymptomatic carriers of the Huntington's disease gene. J Neurol Neurosurg Psychiatry. 2000;69:773–779. doi: 10.1136/jnnp.69.6.773. [DOI] [PMC free article] [PubMed] [Google Scholar]
- 8.Kirkwood SC, Siemers E, Bond C, Conneally PM, Christian JC, Foroud T. Confirmation of subtle motor changes among presymptomatic carriers of the Huntington disease gene. Arch Neurol. 2000;57:1040–1044. doi: 10.1001/archneur.57.7.1040. [DOI] [PubMed] [Google Scholar]
- 9.Lemiere J, Decruyenaere M, Evers-Kiebooms G, Vandenbussche E, Dom R. Cognitive changes in patients with Huntington's disease (HD) and asymptomatic carriers of the HD mutation--a longitudinal follow-up study. J Neurol. 2004;251:935–942. doi: 10.1007/s00415-004-0461-9. [DOI] [PubMed] [Google Scholar]
- 10.Montagne B, Kessels RP, Kammers MP, et al. Perception of emotional facial expressions at different intensities in early-symptomatic Huntington's disease. Eur Neurol. 2006;55:151–154. doi: 10.1159/000093215. [DOI] [PubMed] [Google Scholar]
- 11.Paulsen JS, Zimbelman JL, Hinton SC, et al. fMRI biomarker of early neuronal dysfunction in presymptomatic Huntington's Disease. AJNR Am J Neuroradiol. 2004;25:1715–1721. [PMC free article] [PubMed] [Google Scholar]
- 12.Peinemann A, Schuller S, Pohl C, Jahn T, Weindl A, Kassubek J. Executive dysfunction in early stages of Huntington's disease is associated with striatal and insular atrophy: a neuropsychological and voxel-based morphometric study. J Neurol Sci. 2005;239:11–19. doi: 10.1016/j.jns.2005.07.007. [DOI] [PubMed] [Google Scholar]
- 13.Siemers E, Foroud T, Bill DJ, et al. Motor changes in presymptomatic Huntington disease gene carriers. Arch Neurol. 1996;53:487–492. doi: 10.1001/archneur.1996.00550060029011. [DOI] [PubMed] [Google Scholar]
- 14.Solomon AC, Stout JC, Johnson SA, et al. Verbal episodic memory declines prior to diagnosis in Huntington's disease. Neuropsychologia. 2007;45:1767–1776. doi: 10.1016/j.neuropsychologia.2006.12.015. [DOI] [PMC free article] [PubMed] [Google Scholar]
- 15.Brandt J, Shpritz B, Codori AM, Margolis R, Rosenblatt A. Neuropsychological manifestations of the genetic mutation for Huntington's disease in presymptomatic individuals. J Int Neuropsychol Soc. 2002;8:918–924. doi: 10.1017/s1355617702870060. [DOI] [PubMed] [Google Scholar]
- 16.Farrow M, Chua P, Churchyard A, Bradshaw JL, Chiu E, Georgiou-Karistianis N. Proximity to clinical onset influences motor and cognitive performance in presymptomatic Huntington disease gene carriers. Cogn Behav Neurol. 2006;19:208–216. doi: 10.1097/01.wnn.0000213914.64772.b6. [DOI] [PubMed] [Google Scholar]
- 17.Robins Wahlin TB, Lundin A, Dear K. Early cognitive deficits in Swedish gene carriers of Huntington's disease. Neuropsychology. 2007;21:31–44. doi: 10.1037/0894-4105.21.1.31. [DOI] [PubMed] [Google Scholar]
- 18.Campodonico JR, Codori AM, Brandt J. Neuropsychological stability over two years in asymptomatic carriers of the Huntington's disease mutation. J Neurol Neurosurg Psychiatry. 1996;61:621–624. doi: 10.1136/jnnp.61.6.621. [DOI] [PMC free article] [PubMed] [Google Scholar]
- 19.Lemiere J, Decruyenaere M, Evers-Kiebooms G, Vandenbussche E, Dom R. Longitudinal study evaluating neuropsychological changes in so-called asymptomatic carriers of the Huntington's disease mutation after 1 year. Acta Neurol Scand. 2002;106:131–141. doi: 10.1034/j.1600-0404.2002.01192.x. [DOI] [PubMed] [Google Scholar]
- 20.Huntington's disease: a disorder of families. Baltimore: Johns Hopkins University Press; 1989. [Google Scholar]
- 21.Penney JB, Jr, Young AB, Shoulson I, et al. Huntington's disease in Venezuela: 7 years of follow-up on symptomatic and asymptomatic individuals. Mov Disord. 1990;5:93–99. doi: 10.1002/mds.870050202. [DOI] [PubMed] [Google Scholar]
- 22.Unified Huntington's Disease Rating Scale-99. Rochester NY: Huntington Study Group; 1999. [Google Scholar]
- 23.Bond CE, Hodes ME. Direct amplification of the CAG repeat of huntingtin without amplification of CCG. Clin Chem. 1996;42:773–774. [PubMed] [Google Scholar]
- 24.Langbehn DR, Brinkman RR, Falush D, Paulsen JS, Hayden MR. A new model for prediction of the age of onset and penetrance for Huntington's disease based on CAG length. Clin Genet. 2004;65:267–277. doi: 10.1111/j.1399-0004.2004.00241.x. [DOI] [PubMed] [Google Scholar]
- 25.Hochschild R. Intervention in the Aging Process, Part A: Quantitation, Epidemiology and Clinical Research. New York: Alan R. Liss; 1983. The H-scan: An instrument for the automatic measurement of physiological markers of aging; pp. 113–125. [Google Scholar]


